DSP NETRA March 2024
Post Pandemic Returns & Where Are We Now
Too Easy or Too Hard?
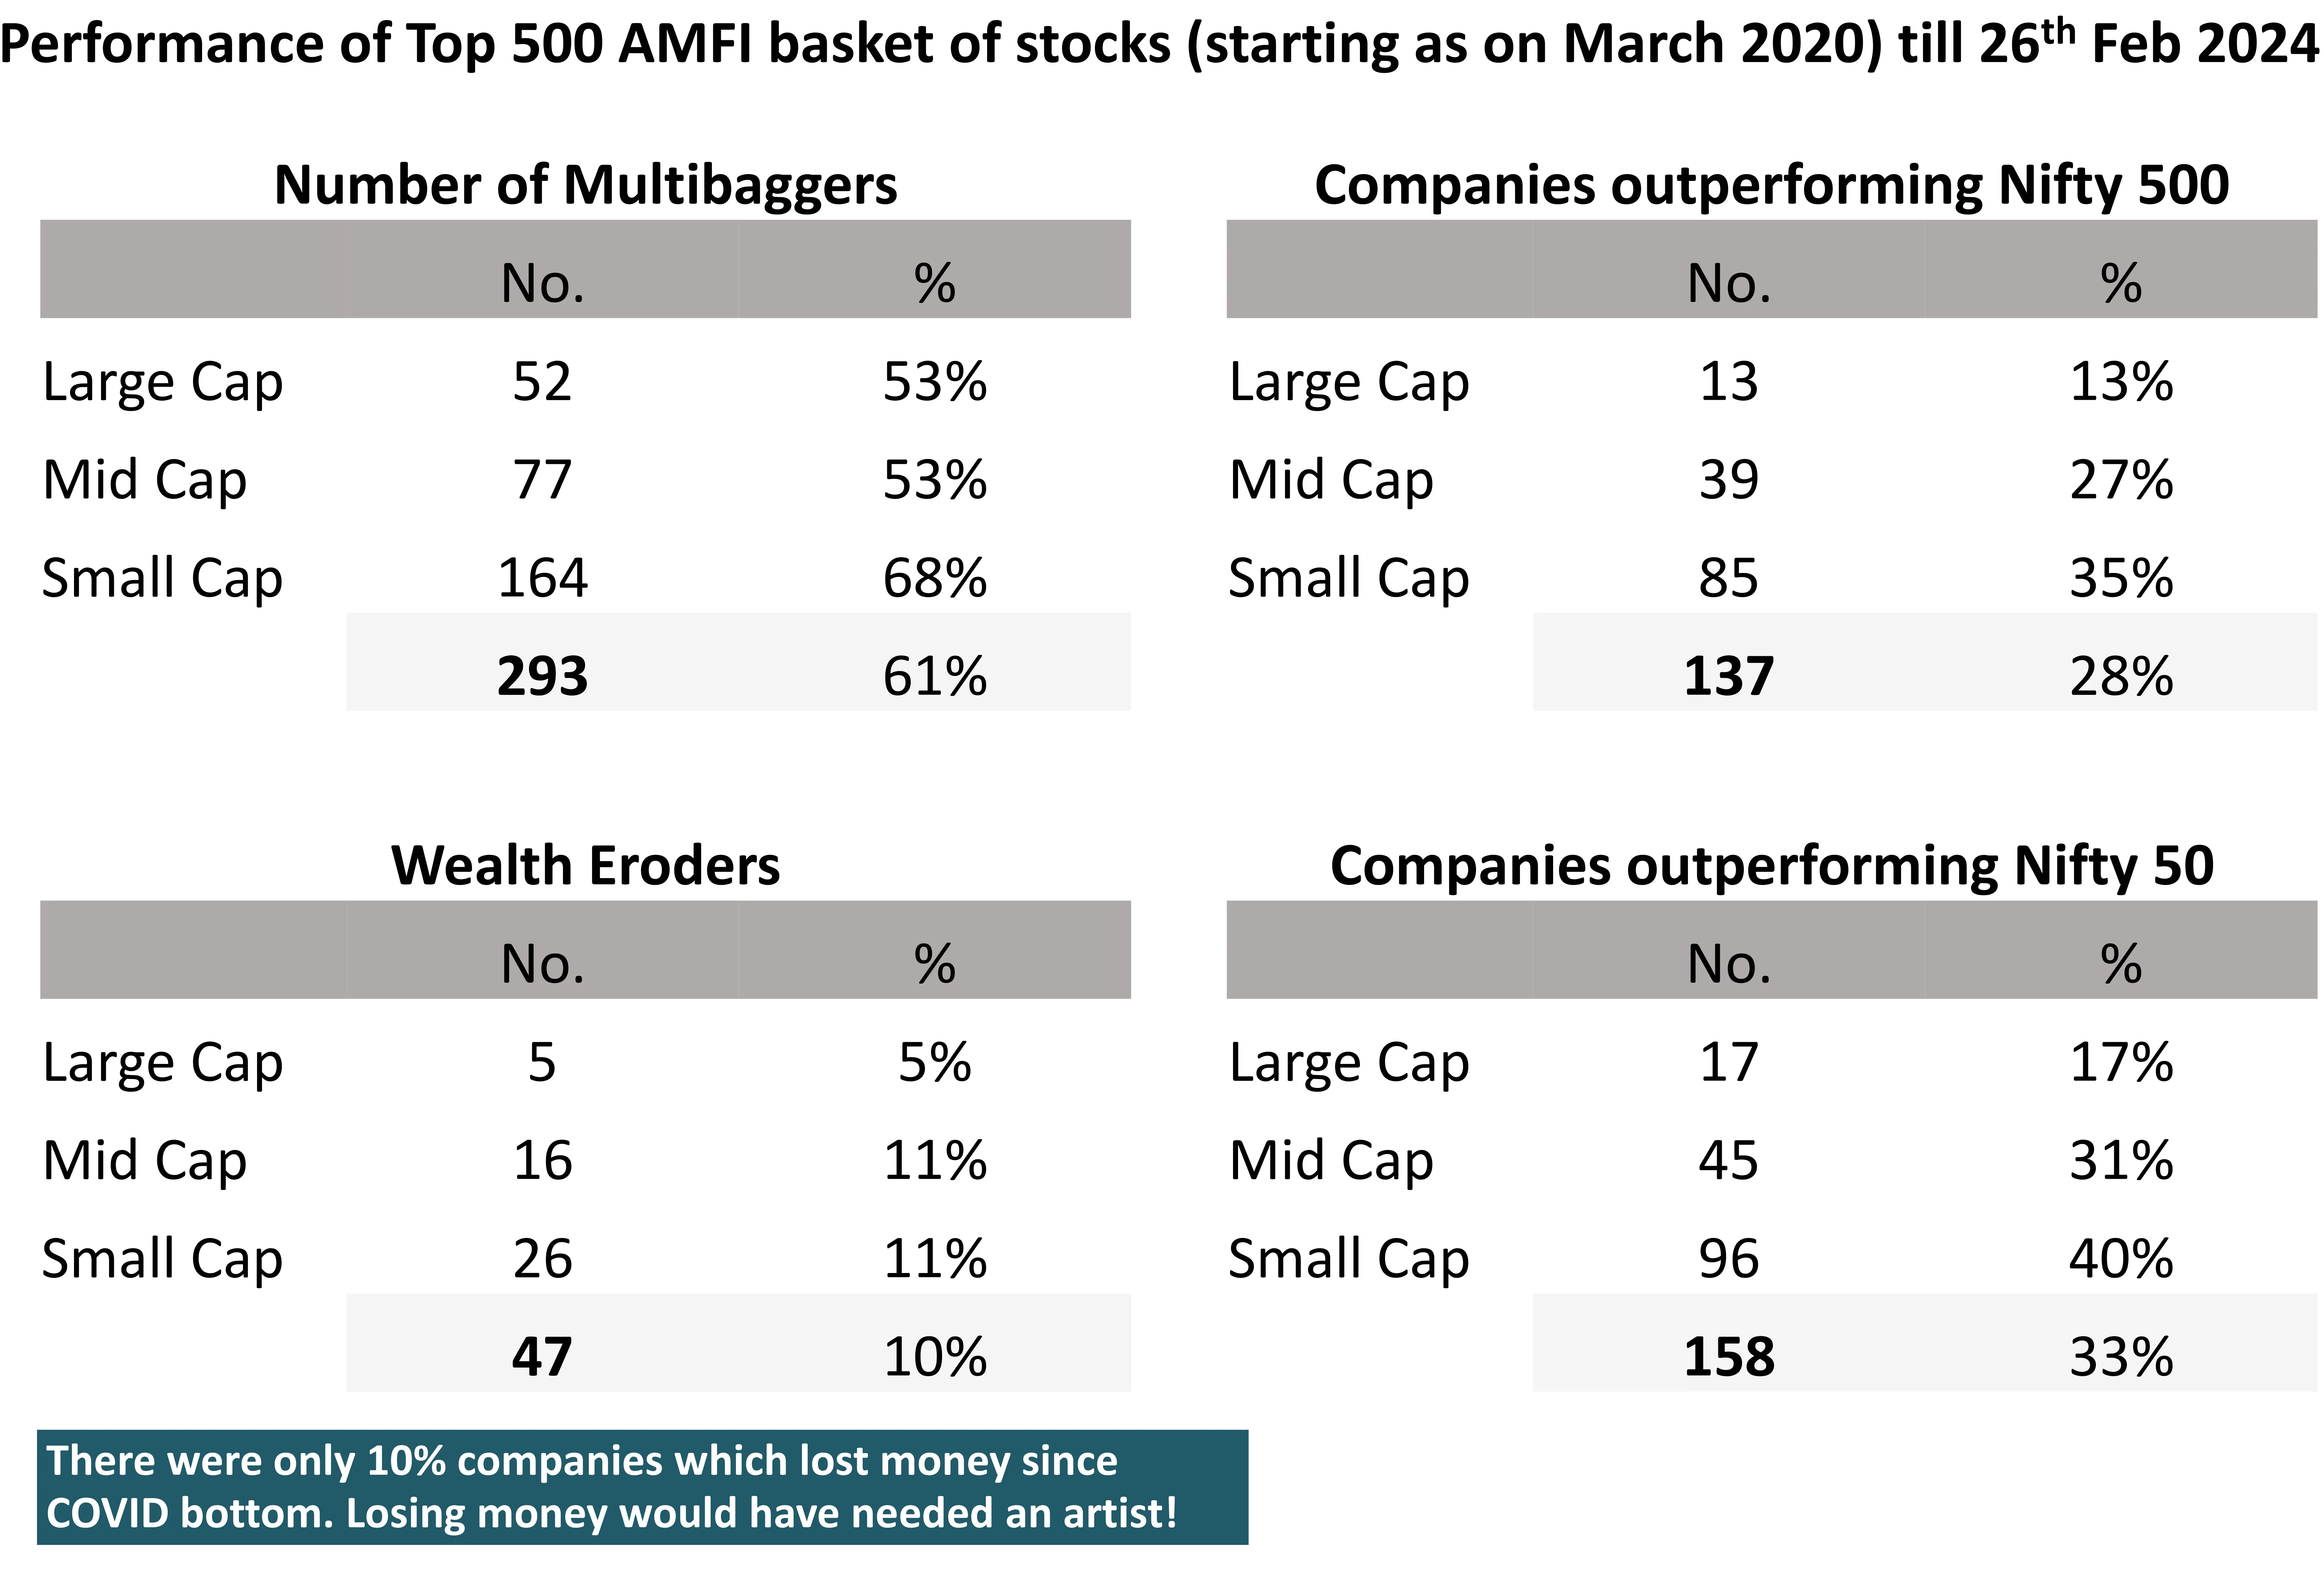
Since the stock market bottom of COVID
- More than two-thirds of all smallcap stocks have become multibaggers.
- One third of companies have outperformed Nifty Index.
- Only 10% firms gave negative returns.
- Top 20 performers ran at a CAGR of 76%, on average. This means tripling every other year.
NSE 500 Index TR CAGR: 35%
Nifty 50 Index TR CAGR: 32%
A sneak-peak at history (2003-07 Bull run)
- More than three-fourth of all stocks had become multibaggers.
- Only 6 stocks had given negative returns.
- Top 20 performers ran at a CAGR of 160%, on average.
NSE 500 Index TR CAGR: 58%
Nifty 50 Index TR CAGR: 53%
Source: Bloomberg, DSP; Data as of Feb 2024
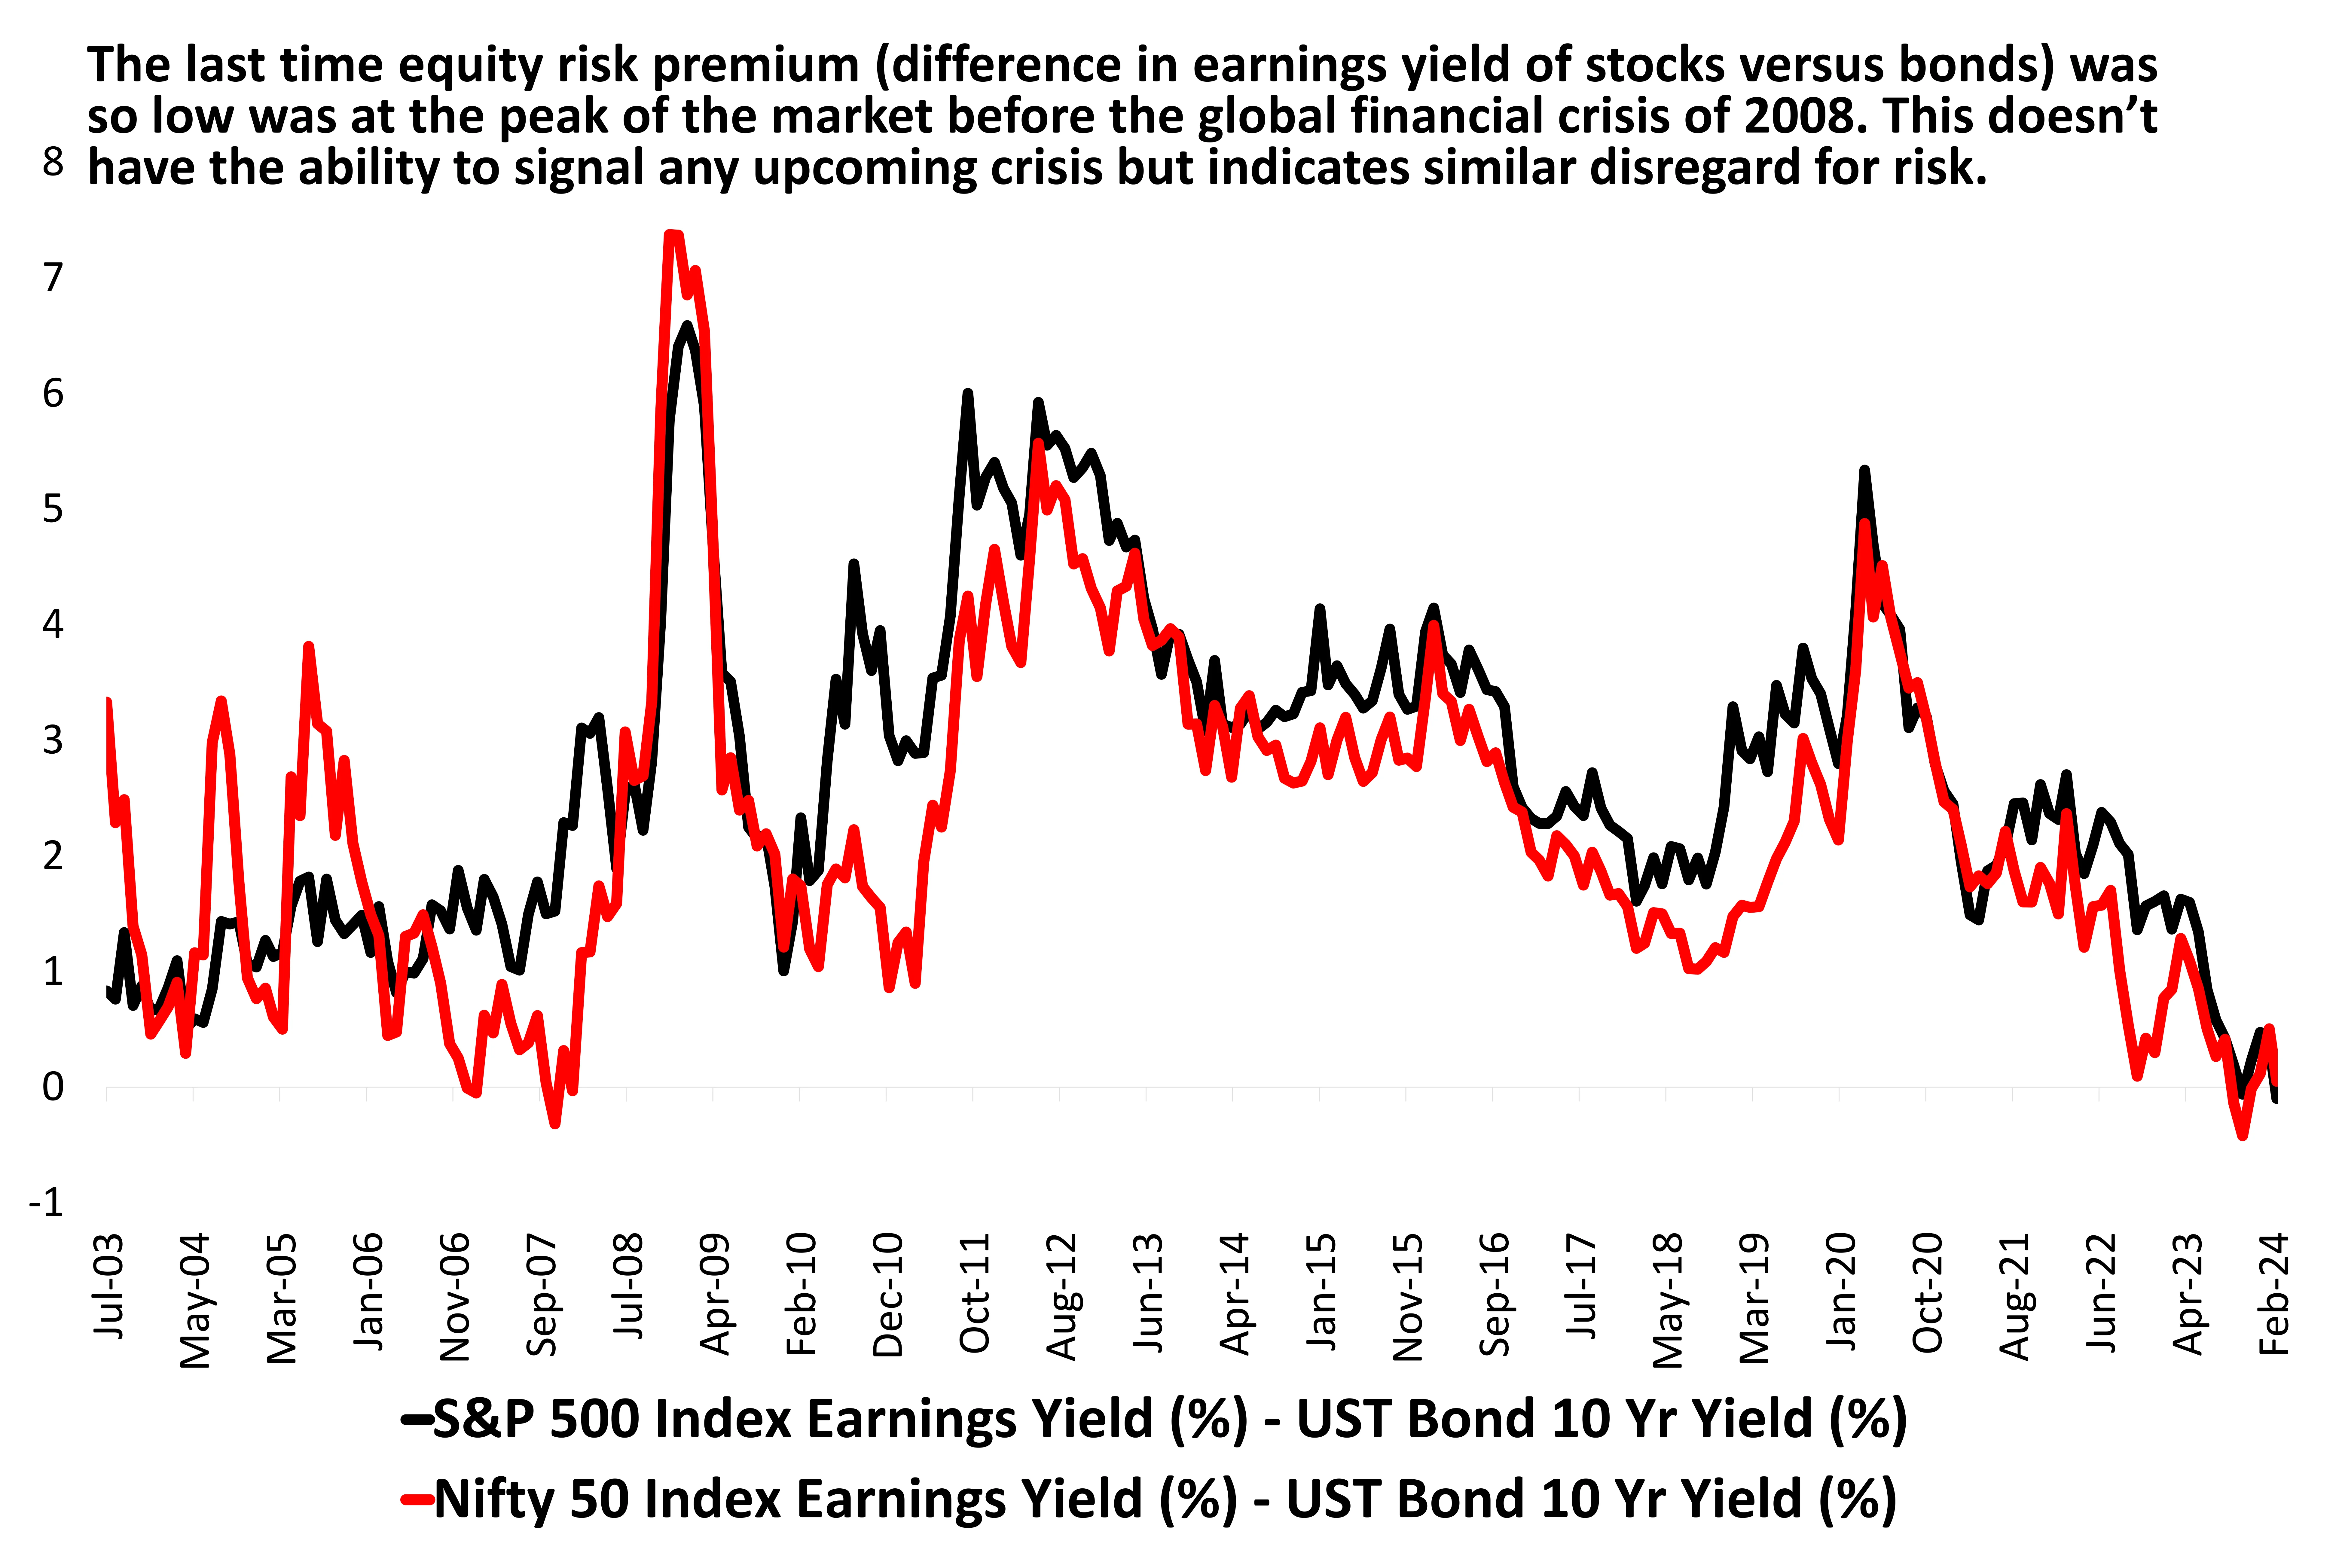
Equity Risk Premium Has Evaporated
What is Equity Risk Premium?
The equity risk premium is the excess return an
investor expects to receive for investing in stocks
(equities) compared to a risk-free investment,
such as government bonds. It's a way of
compensating stock market investors for the
additional risk they take on, which is historically
more volatile than government bonds.
How is Equity Risk Premium Calculated?
The most common way to calculate ERP is:
Equity Risk Premium (ERP) = Expected Return on
the Stock Market - Risk-Free Rate
What does it signify?
The size of the equity risk premium changes
over time depending on the perceived level of
risk in the market. Interestingly perceived risk &
the risk that unfolds in real-time are often at the
opposite end. The lower the risk perception, the
higher the complacency and more are the
chances of sub-par investment returns.
Source: Bloomberg, DSP; Data as of Feb 2024
Stocks, Commodities & FX – All Markets Witnessing Multi-Year Low Volatility Readings
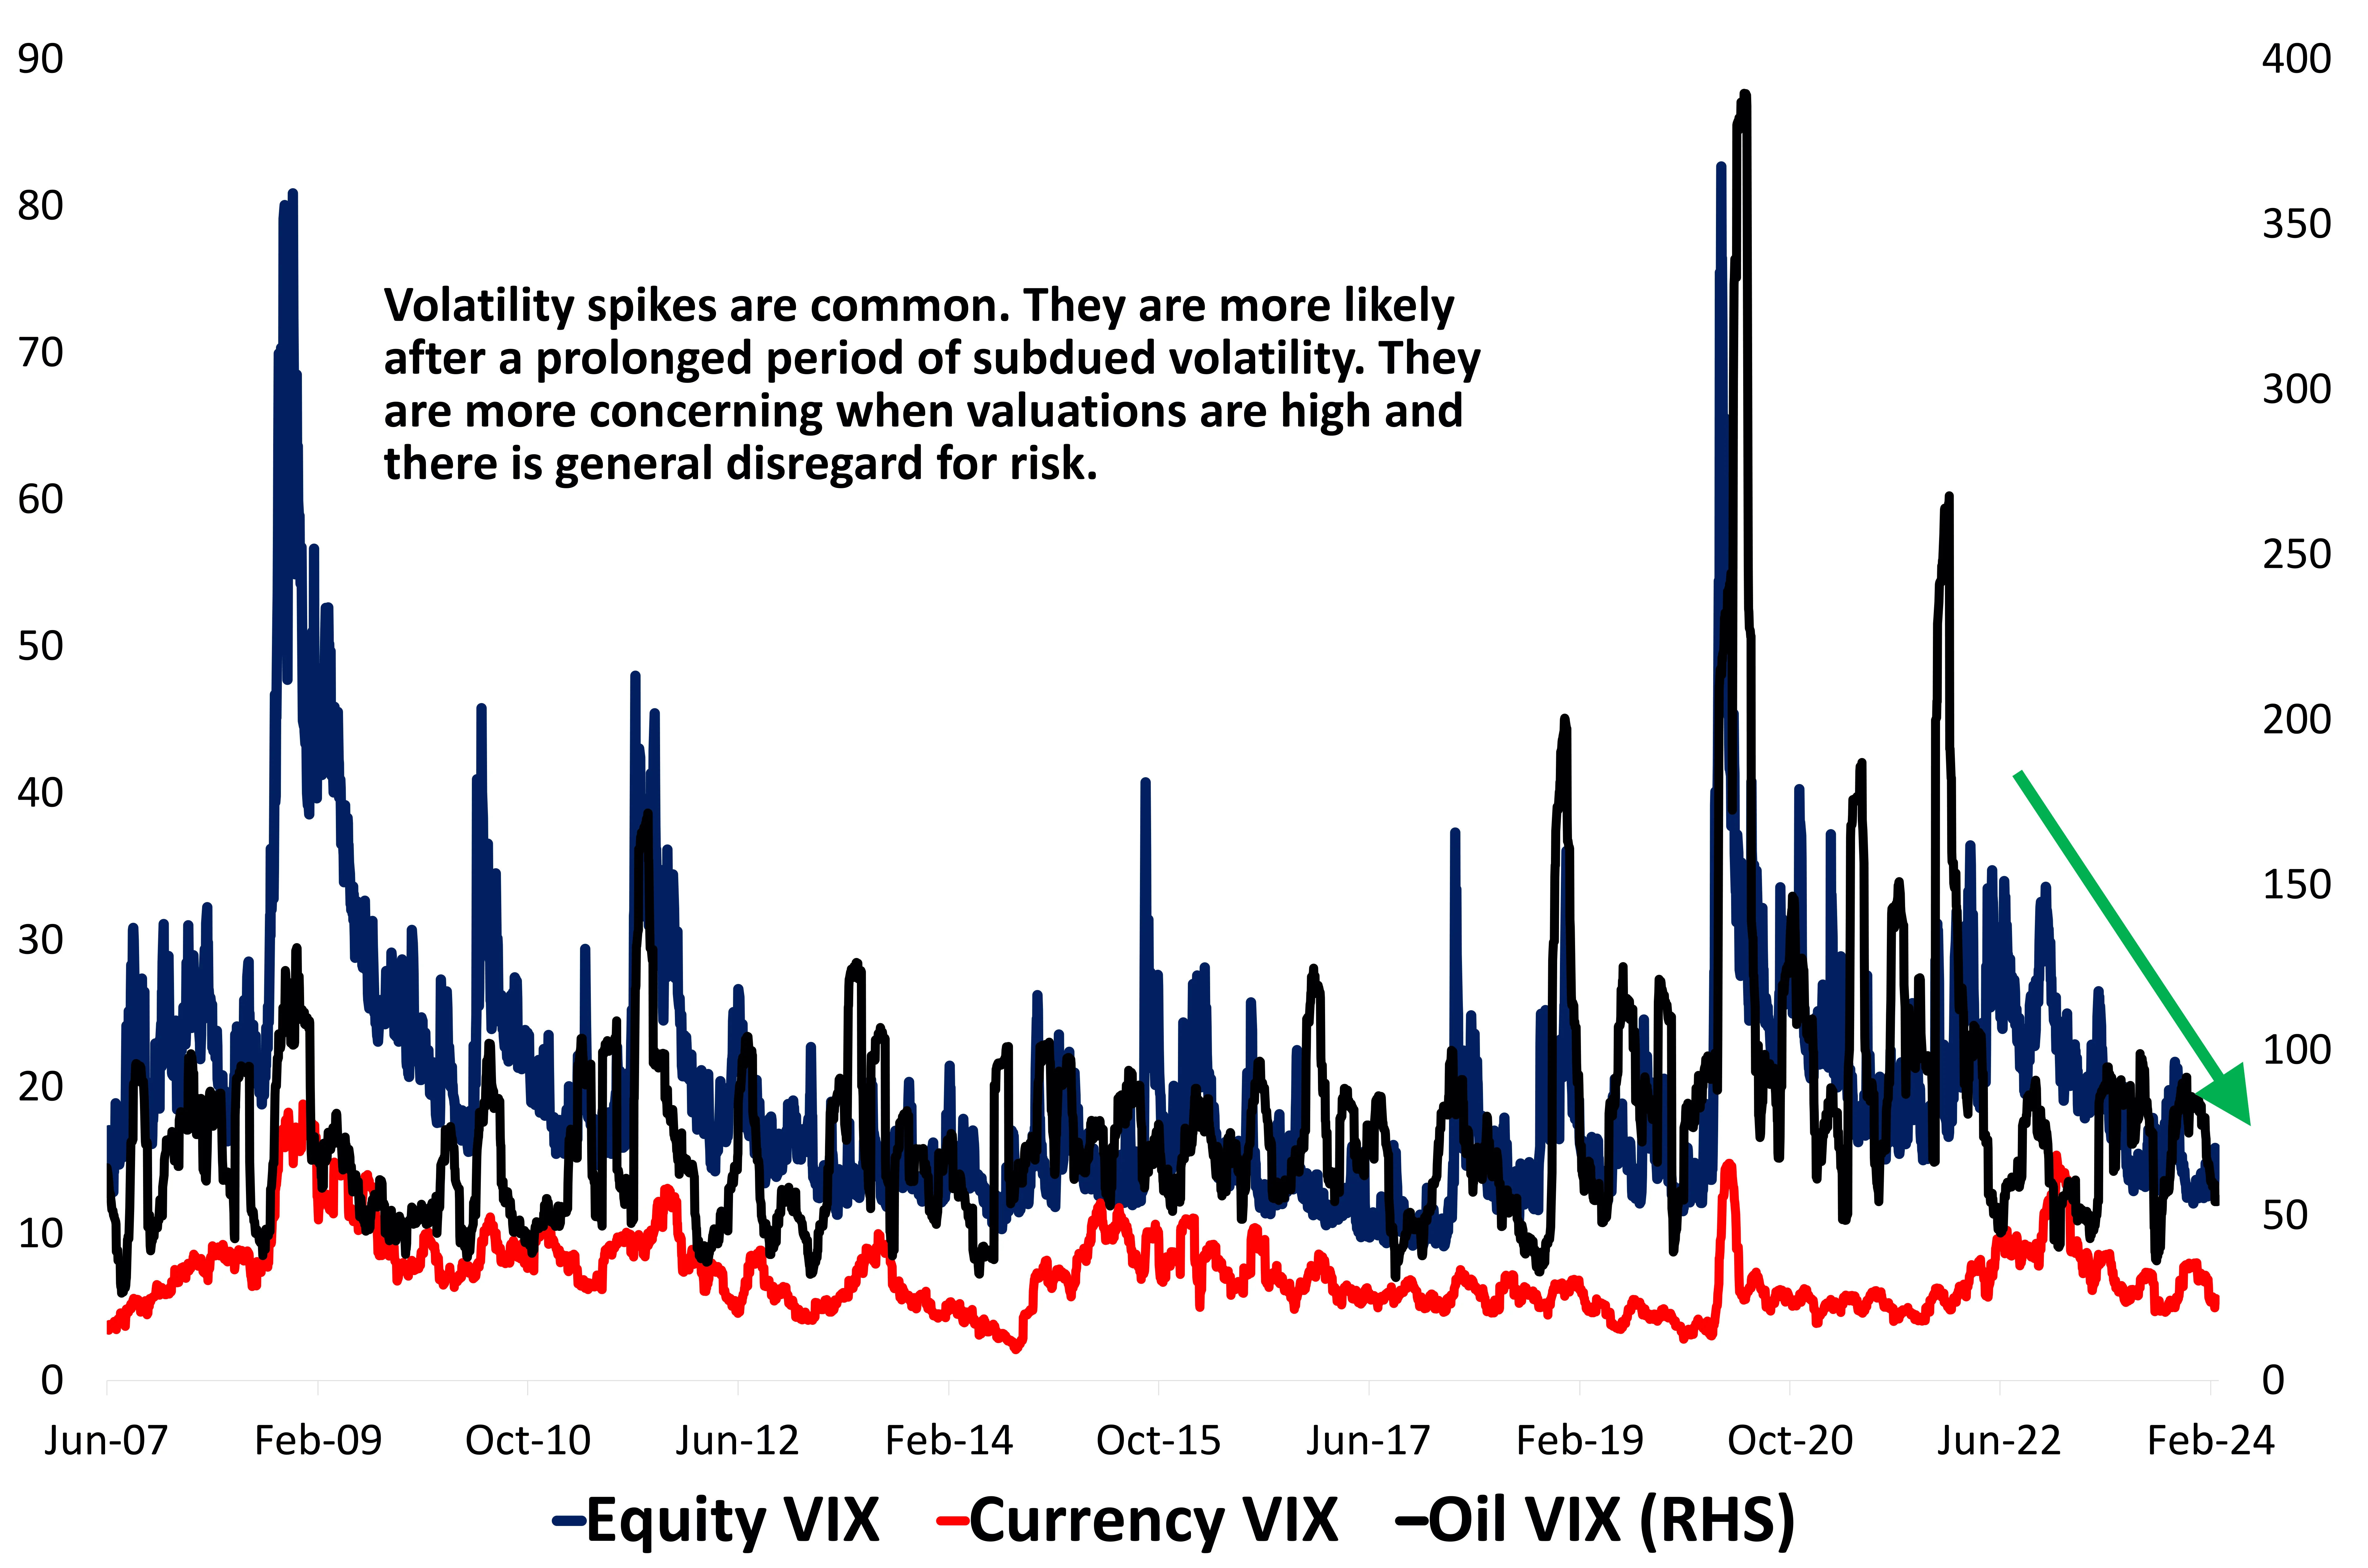
In the past, we have shown how equity markets have entered a period of ‘unsettling calm’ with very shallow drawdowns followed by persistent up moves.
It’s not just equity markets, even currency and commodity markets are witnessing a calmer market environment. This is usually a great sign for mid cycle bull markets in stocks. However, complacency can quickly set in, especially when stock valuations are stretched, global growth is patchy and global trade is slowing.
Intermarket volatility correlations are a great way to measure risk perception of investors across assets. At this time, investors aren’t worried, are excited about high returns and there is little regard for downside protection.
These are conducive conditions for unseen events to disrupt the ‘unsettling calm’. A sign of caution.
Source: Bloomberg, DSP; Data as of Feb 2024
The ‘Lone Wolf’ Tech Juggernaut Stretches To Unchartered Territory
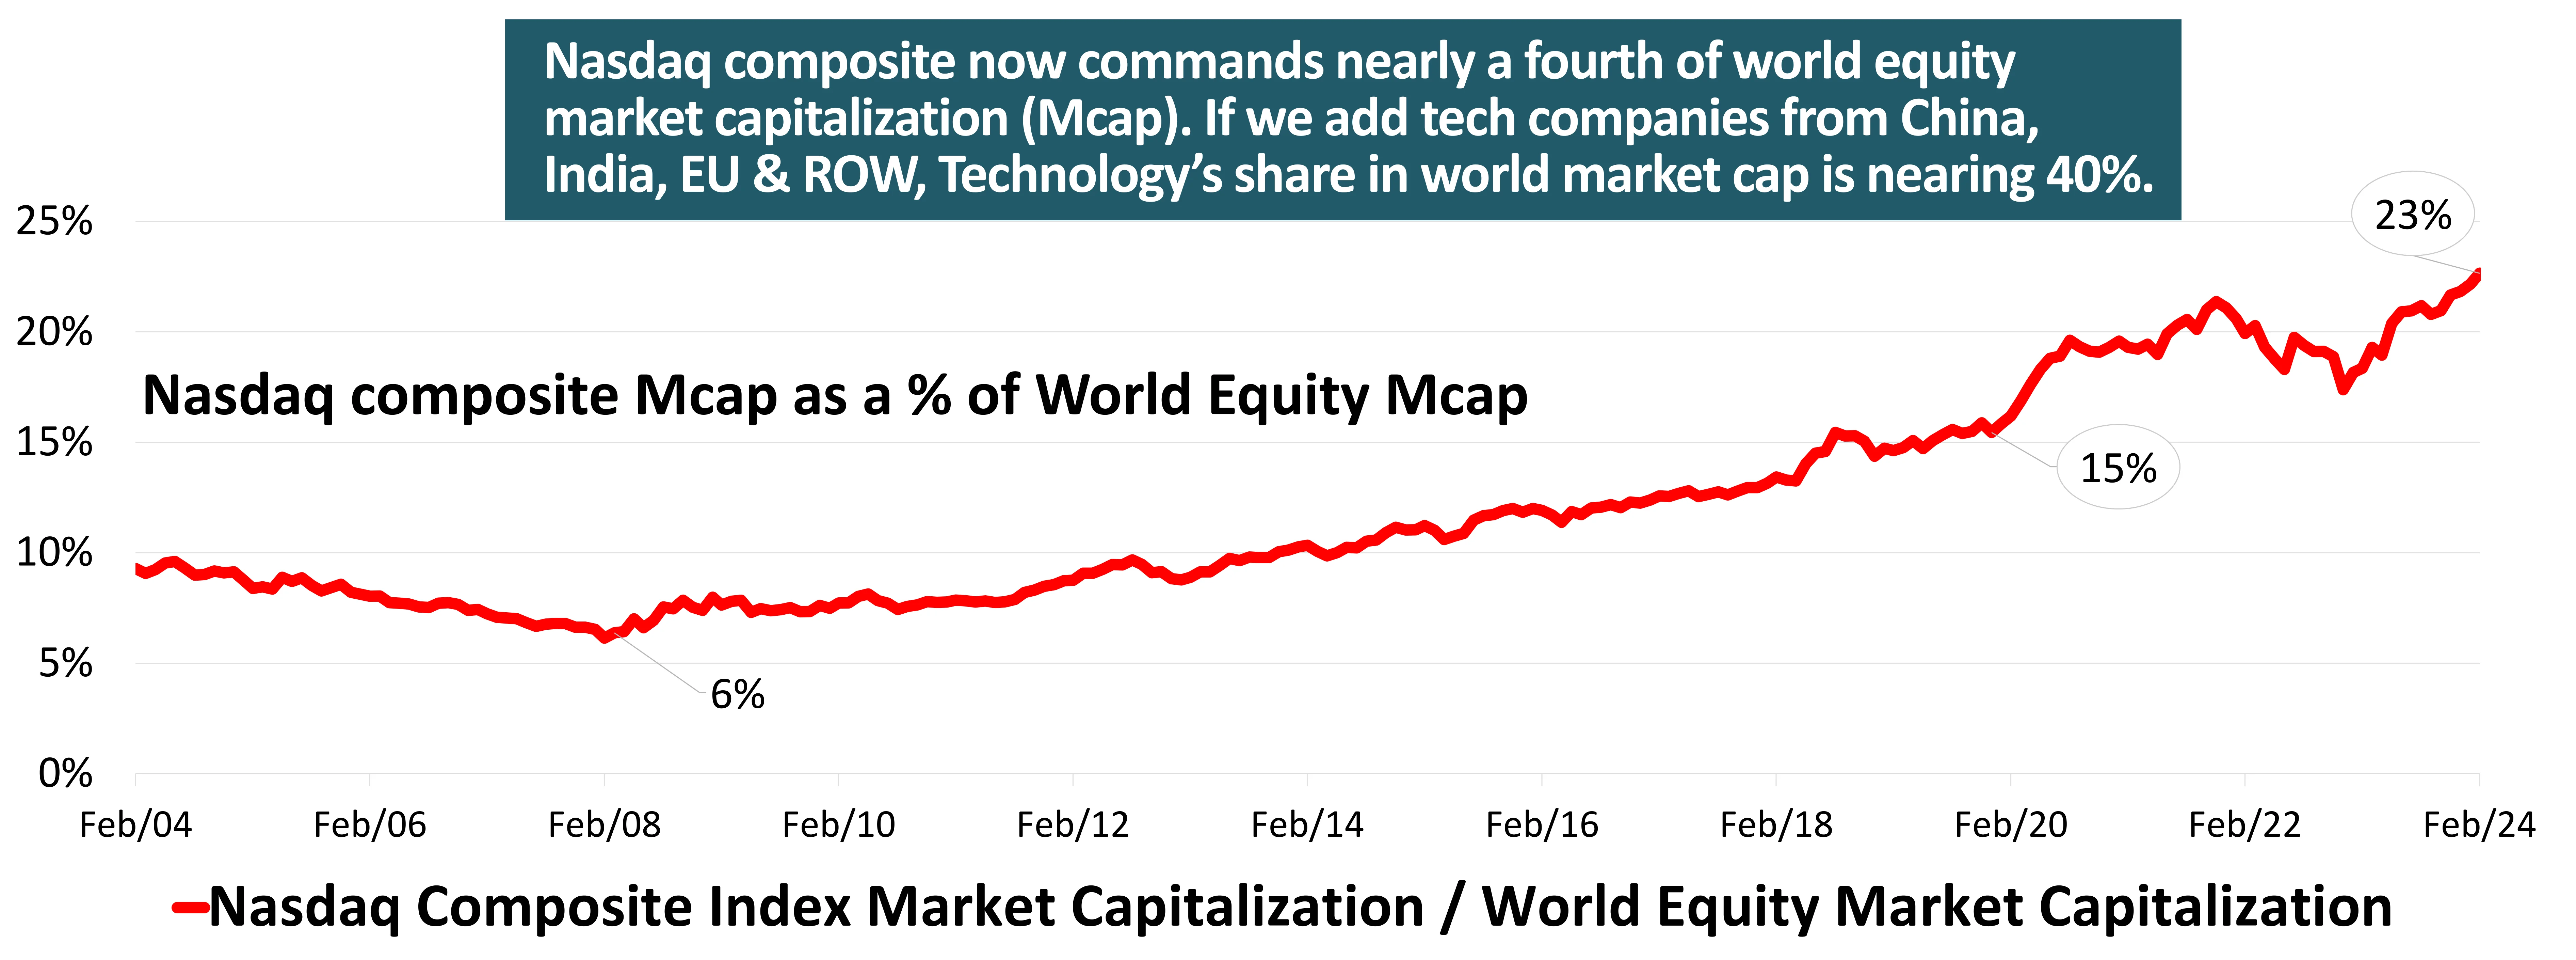
Nasdaq composite now commands nearly a fourth of world equity market capitalization. If we add tech companies from China, India, EU & ROW, Technology’s share in world market cap is nearing 40%.
No sector has reached this level of concentration before. The last record (a derived approximation form past data) suggests that Oil & Gas (the broad energy sector at the time) accounted for nearly a third of world equity market capitalization in 1980s.
Moreover, recently, the technology space has heated up like never before scaling summits not seen earlier. The Nasdaq composite has gained 8% in share of global market cap since the COVID bottom. Over the last year and a half, the IT sector indices have rallied while performance of most other sectors have been subpar. This makes this rally high concentrated.
In worlds of Bob Farrell: “Markets are strongest when they are broad and weakest when they narrow to a handful of blue-chip names.”
Source: Bloomberg, DSP; Data as of Feb 2024
But Even The Tech Rally Is Driven By The Chosen ‘One’
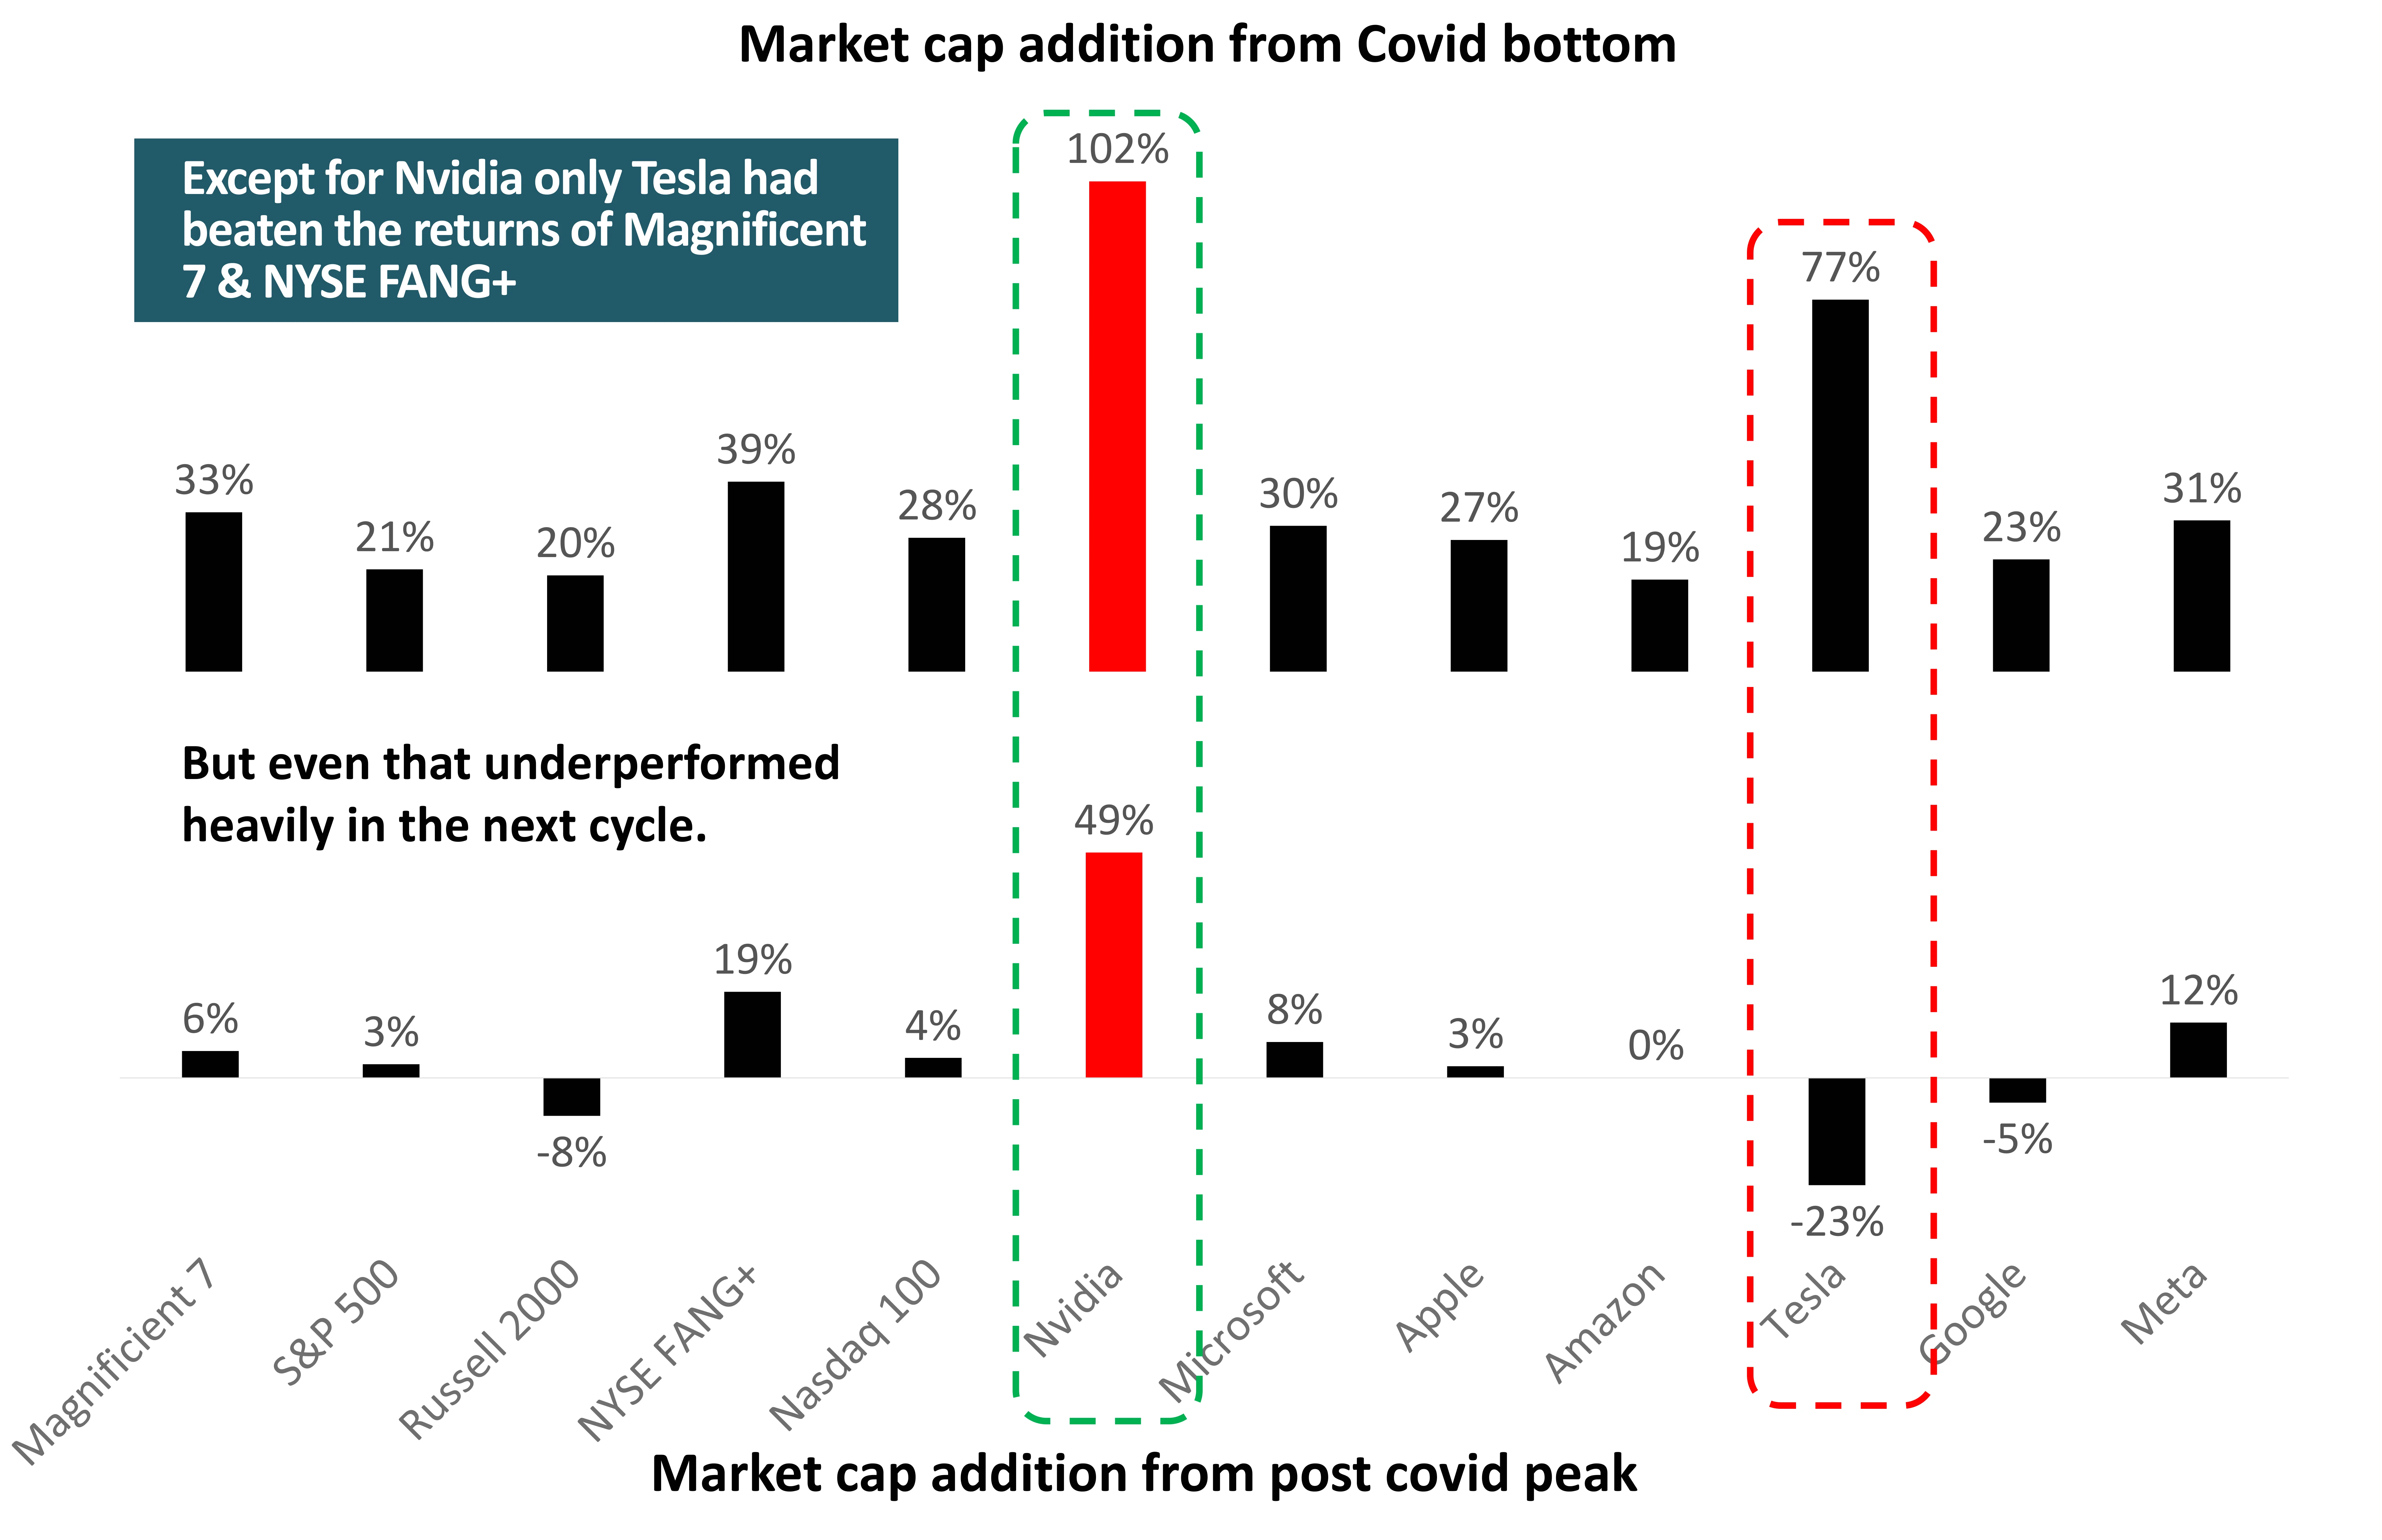
Since the Nasdaq peak of Nov’21 most other major technology names giving subdued performance. NVIDIA accounts for most of the returns of NYSE FANG+ and the Magnificent 7 cohorts. The rally is becoming so narrow that the market narrative is now shifting to the Super Six by excluding Tesla from the mix.
Broadly, it is only the semiconductors space or stocks which have anything to do with AI which have performed since Nov’21. The broader market is much quieter.
When market trends are dependent on a select few names to drive performance, the outlook becomes more and more unsustainable. Watch out.
Source: Bloomberg; Data as of Feb 2024. Post covid peak here is taken as Nov 2021
Semiconductor Index Rises To Record Valuations
Semiconductors, semiconductor equipment and designer, now account for more than 25% of Nasdaq 100’s weight. This is the highest that the industry group has ever weighed in within the technology space.
This has coincided with never ending stories about the ‘blue-sky’ scenario for the sector and its possible ‘never ending growth’. However, the SOX Semiconductor Index is trading at 7.5x price to sales, 41x forward price to earnings and at the highest share of market capitalization, which suggests it is over-owned.
SOX Index Fwd PE has nearly doubled from PreCOVID levels and is now at 41x.
This is a space which is now over-owned, overvalued and overheated in the short term. It’s an ideal and opportune time to tone down expectations for this space until valuations become attractive again.
Source: Bloomberg, DSP; Data as of Feb 2024
Semiconductor Index Rises To Record Valuations
Source: Bloomberg, DSP; Data as of Feb 2024
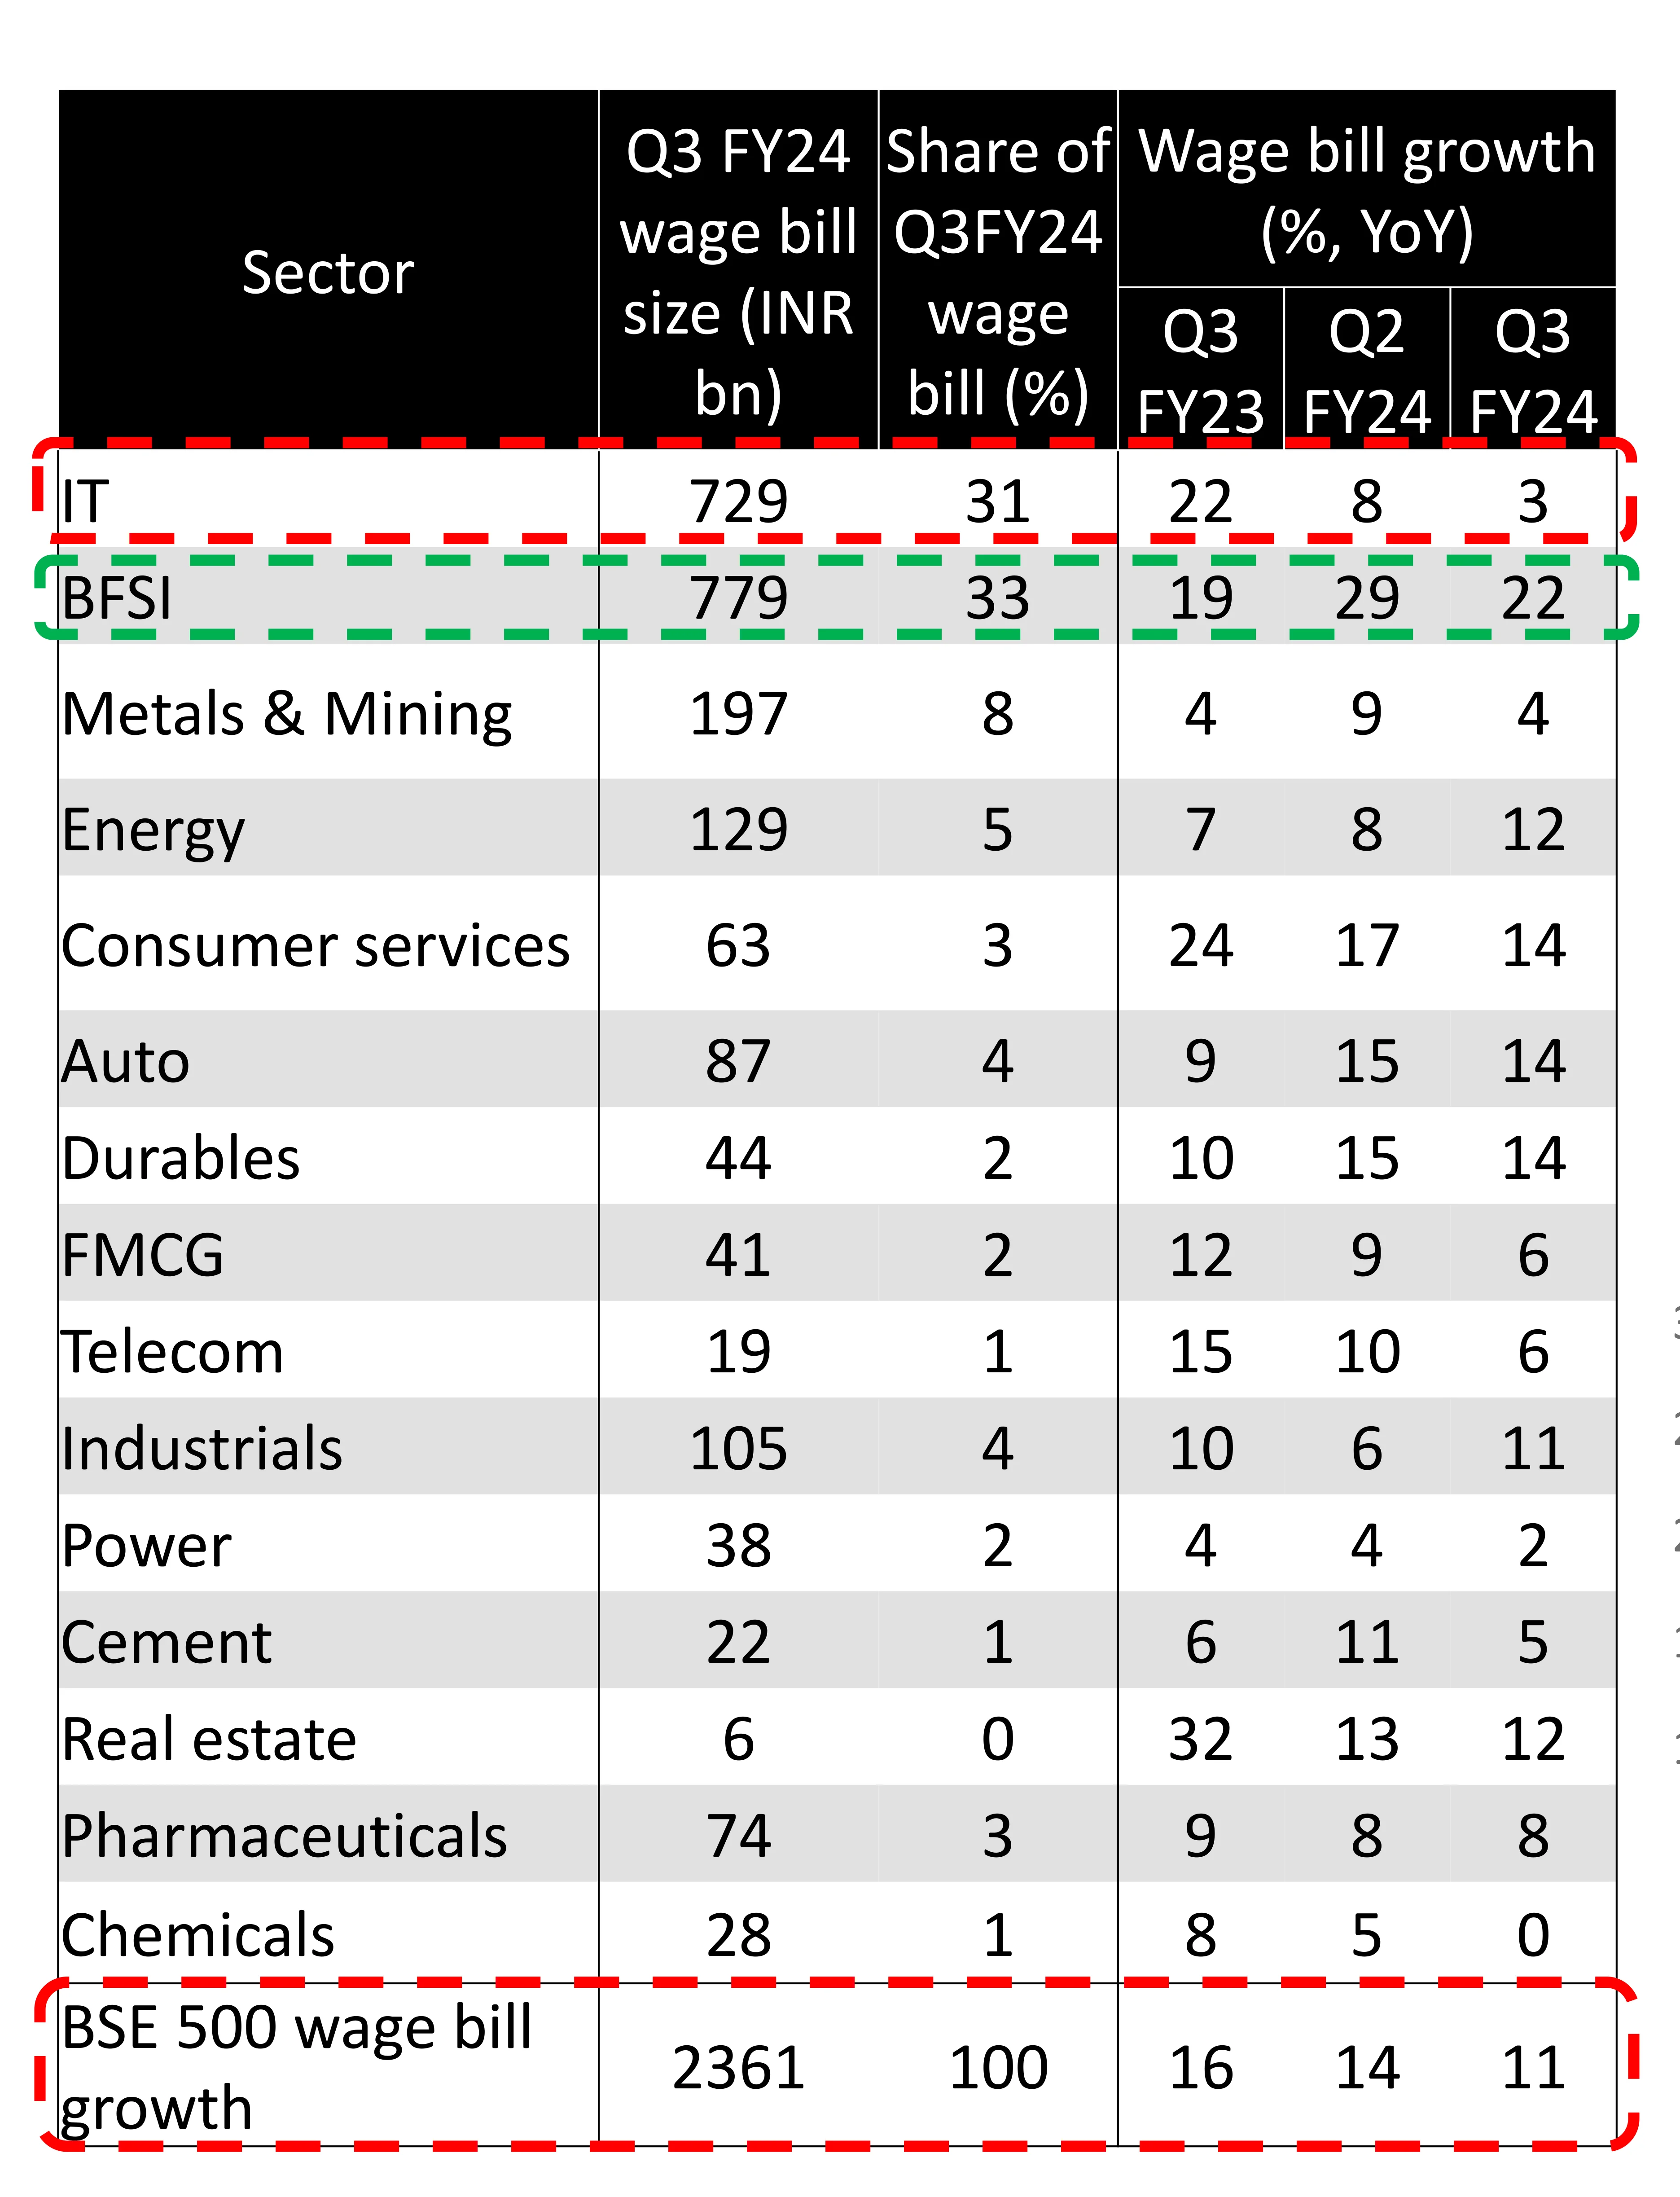
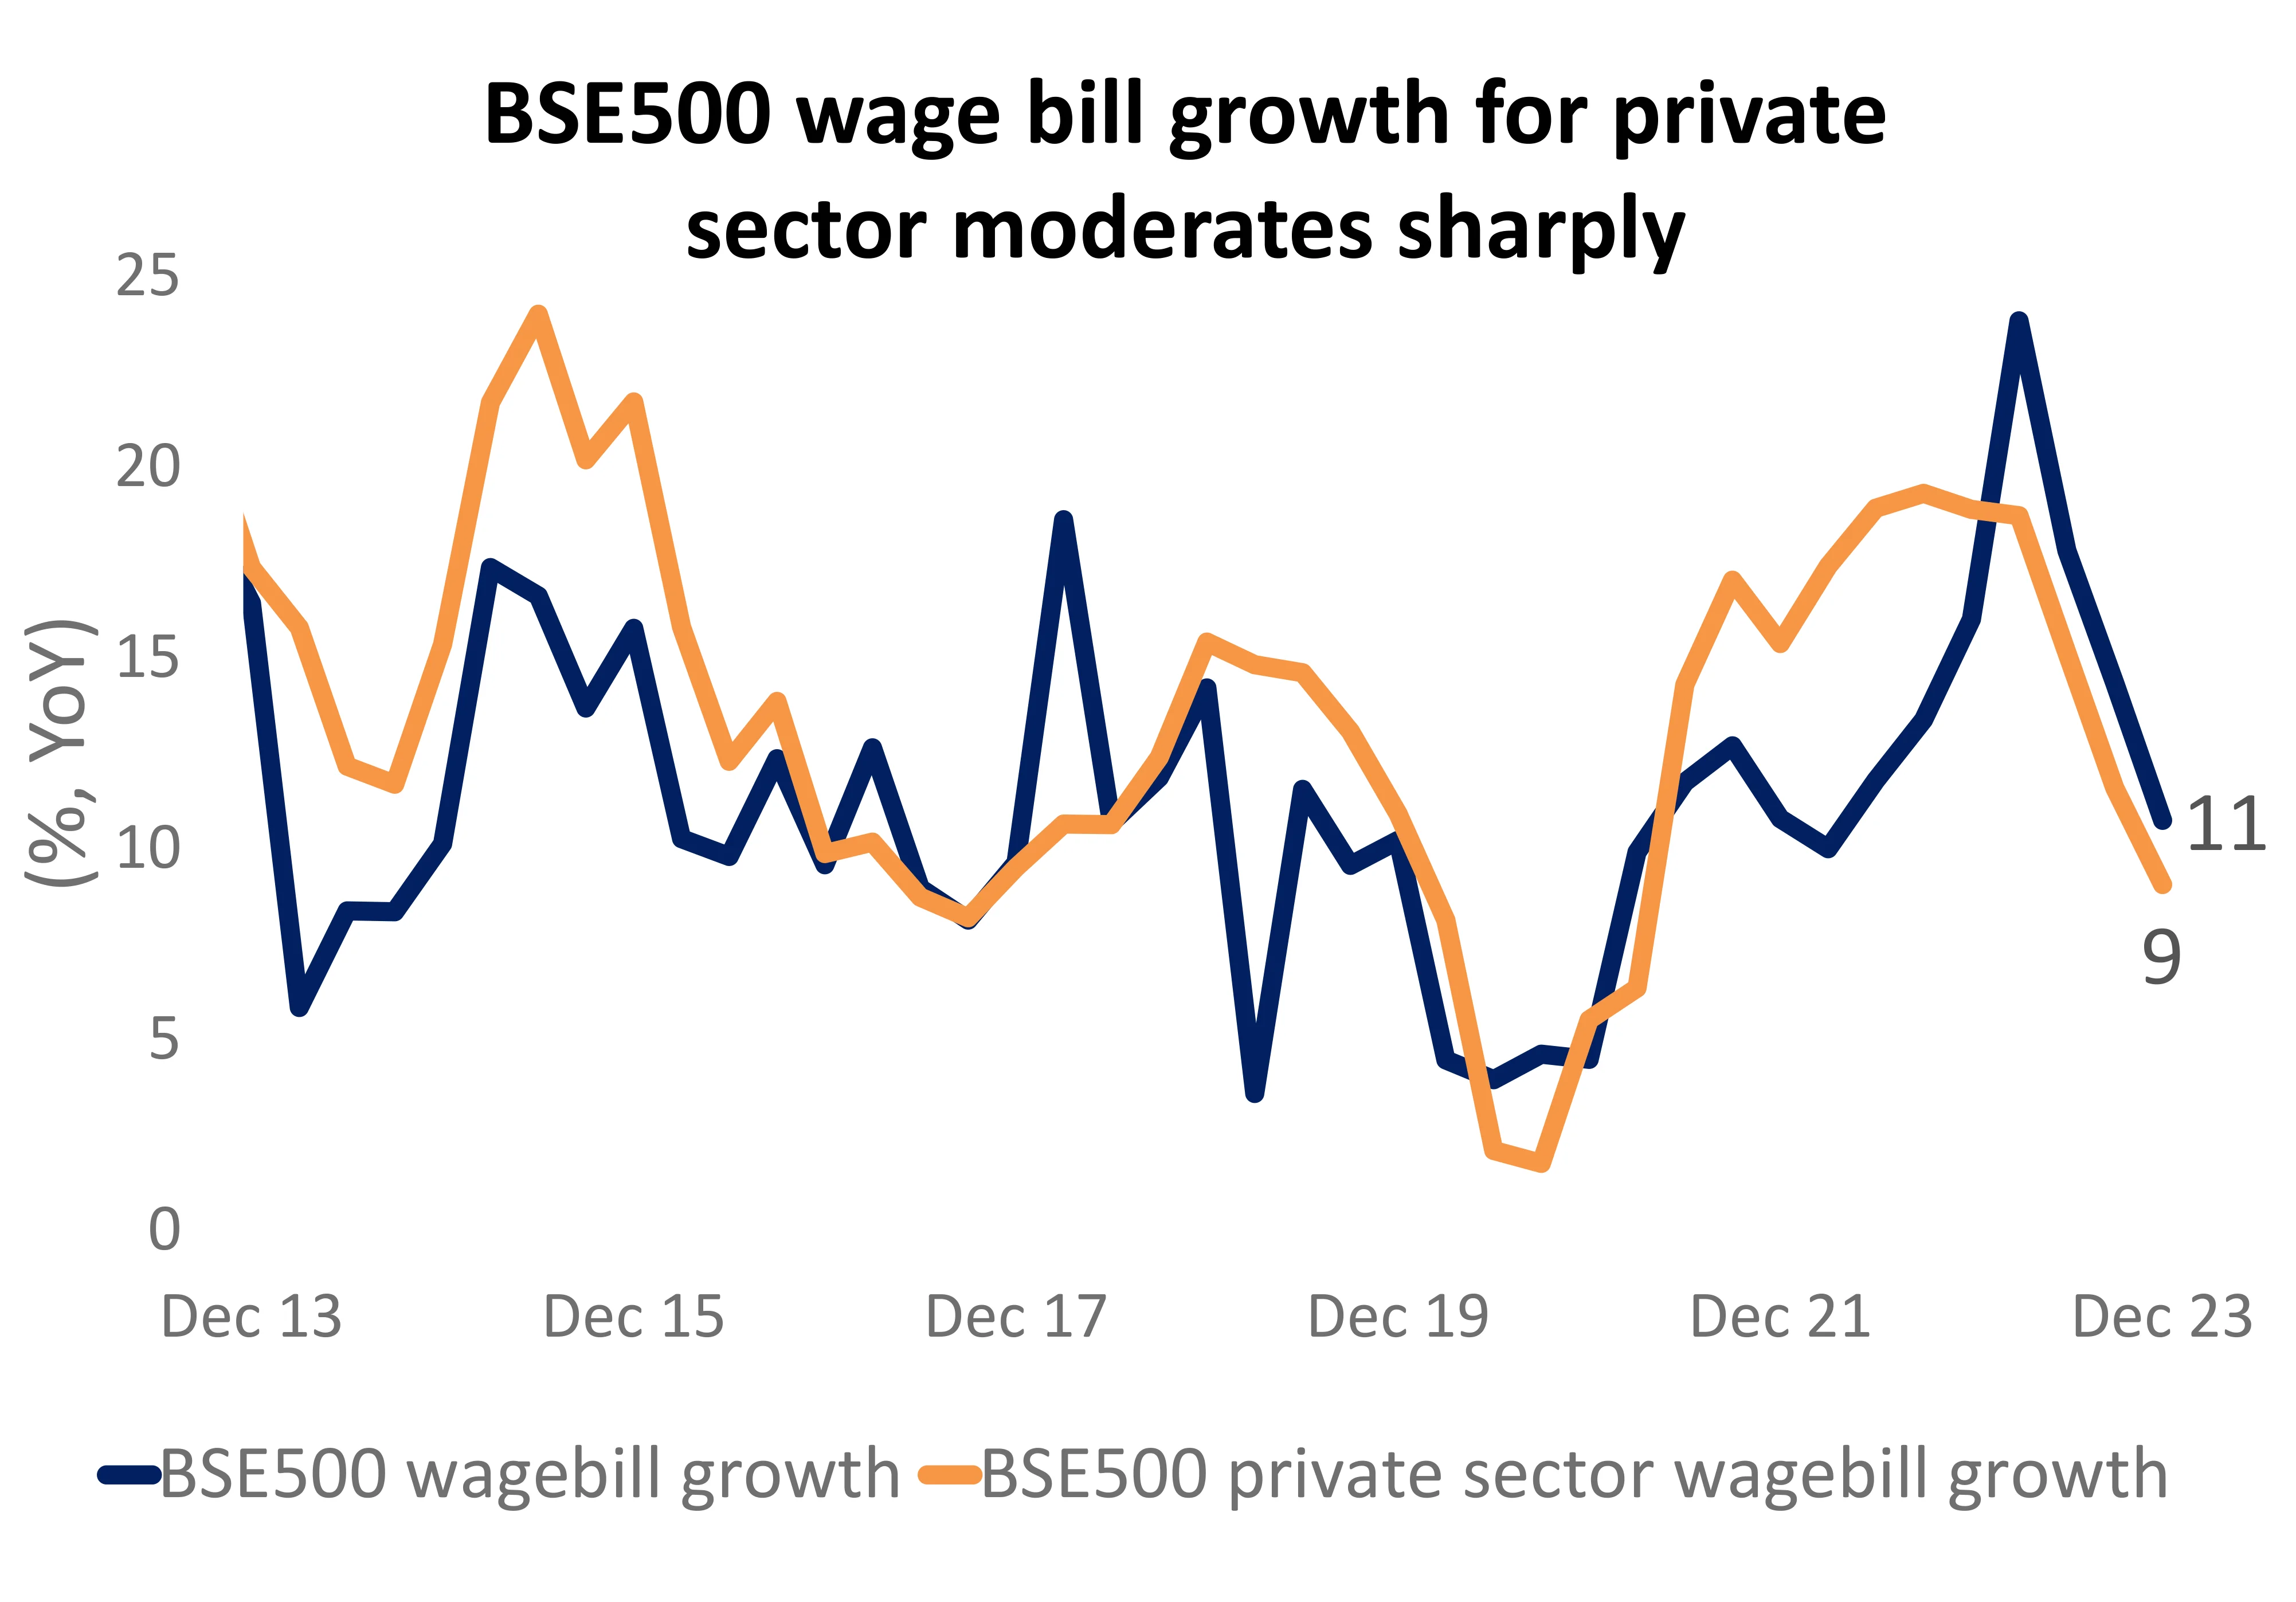
BSE 500 Wage Bill Growth Slows
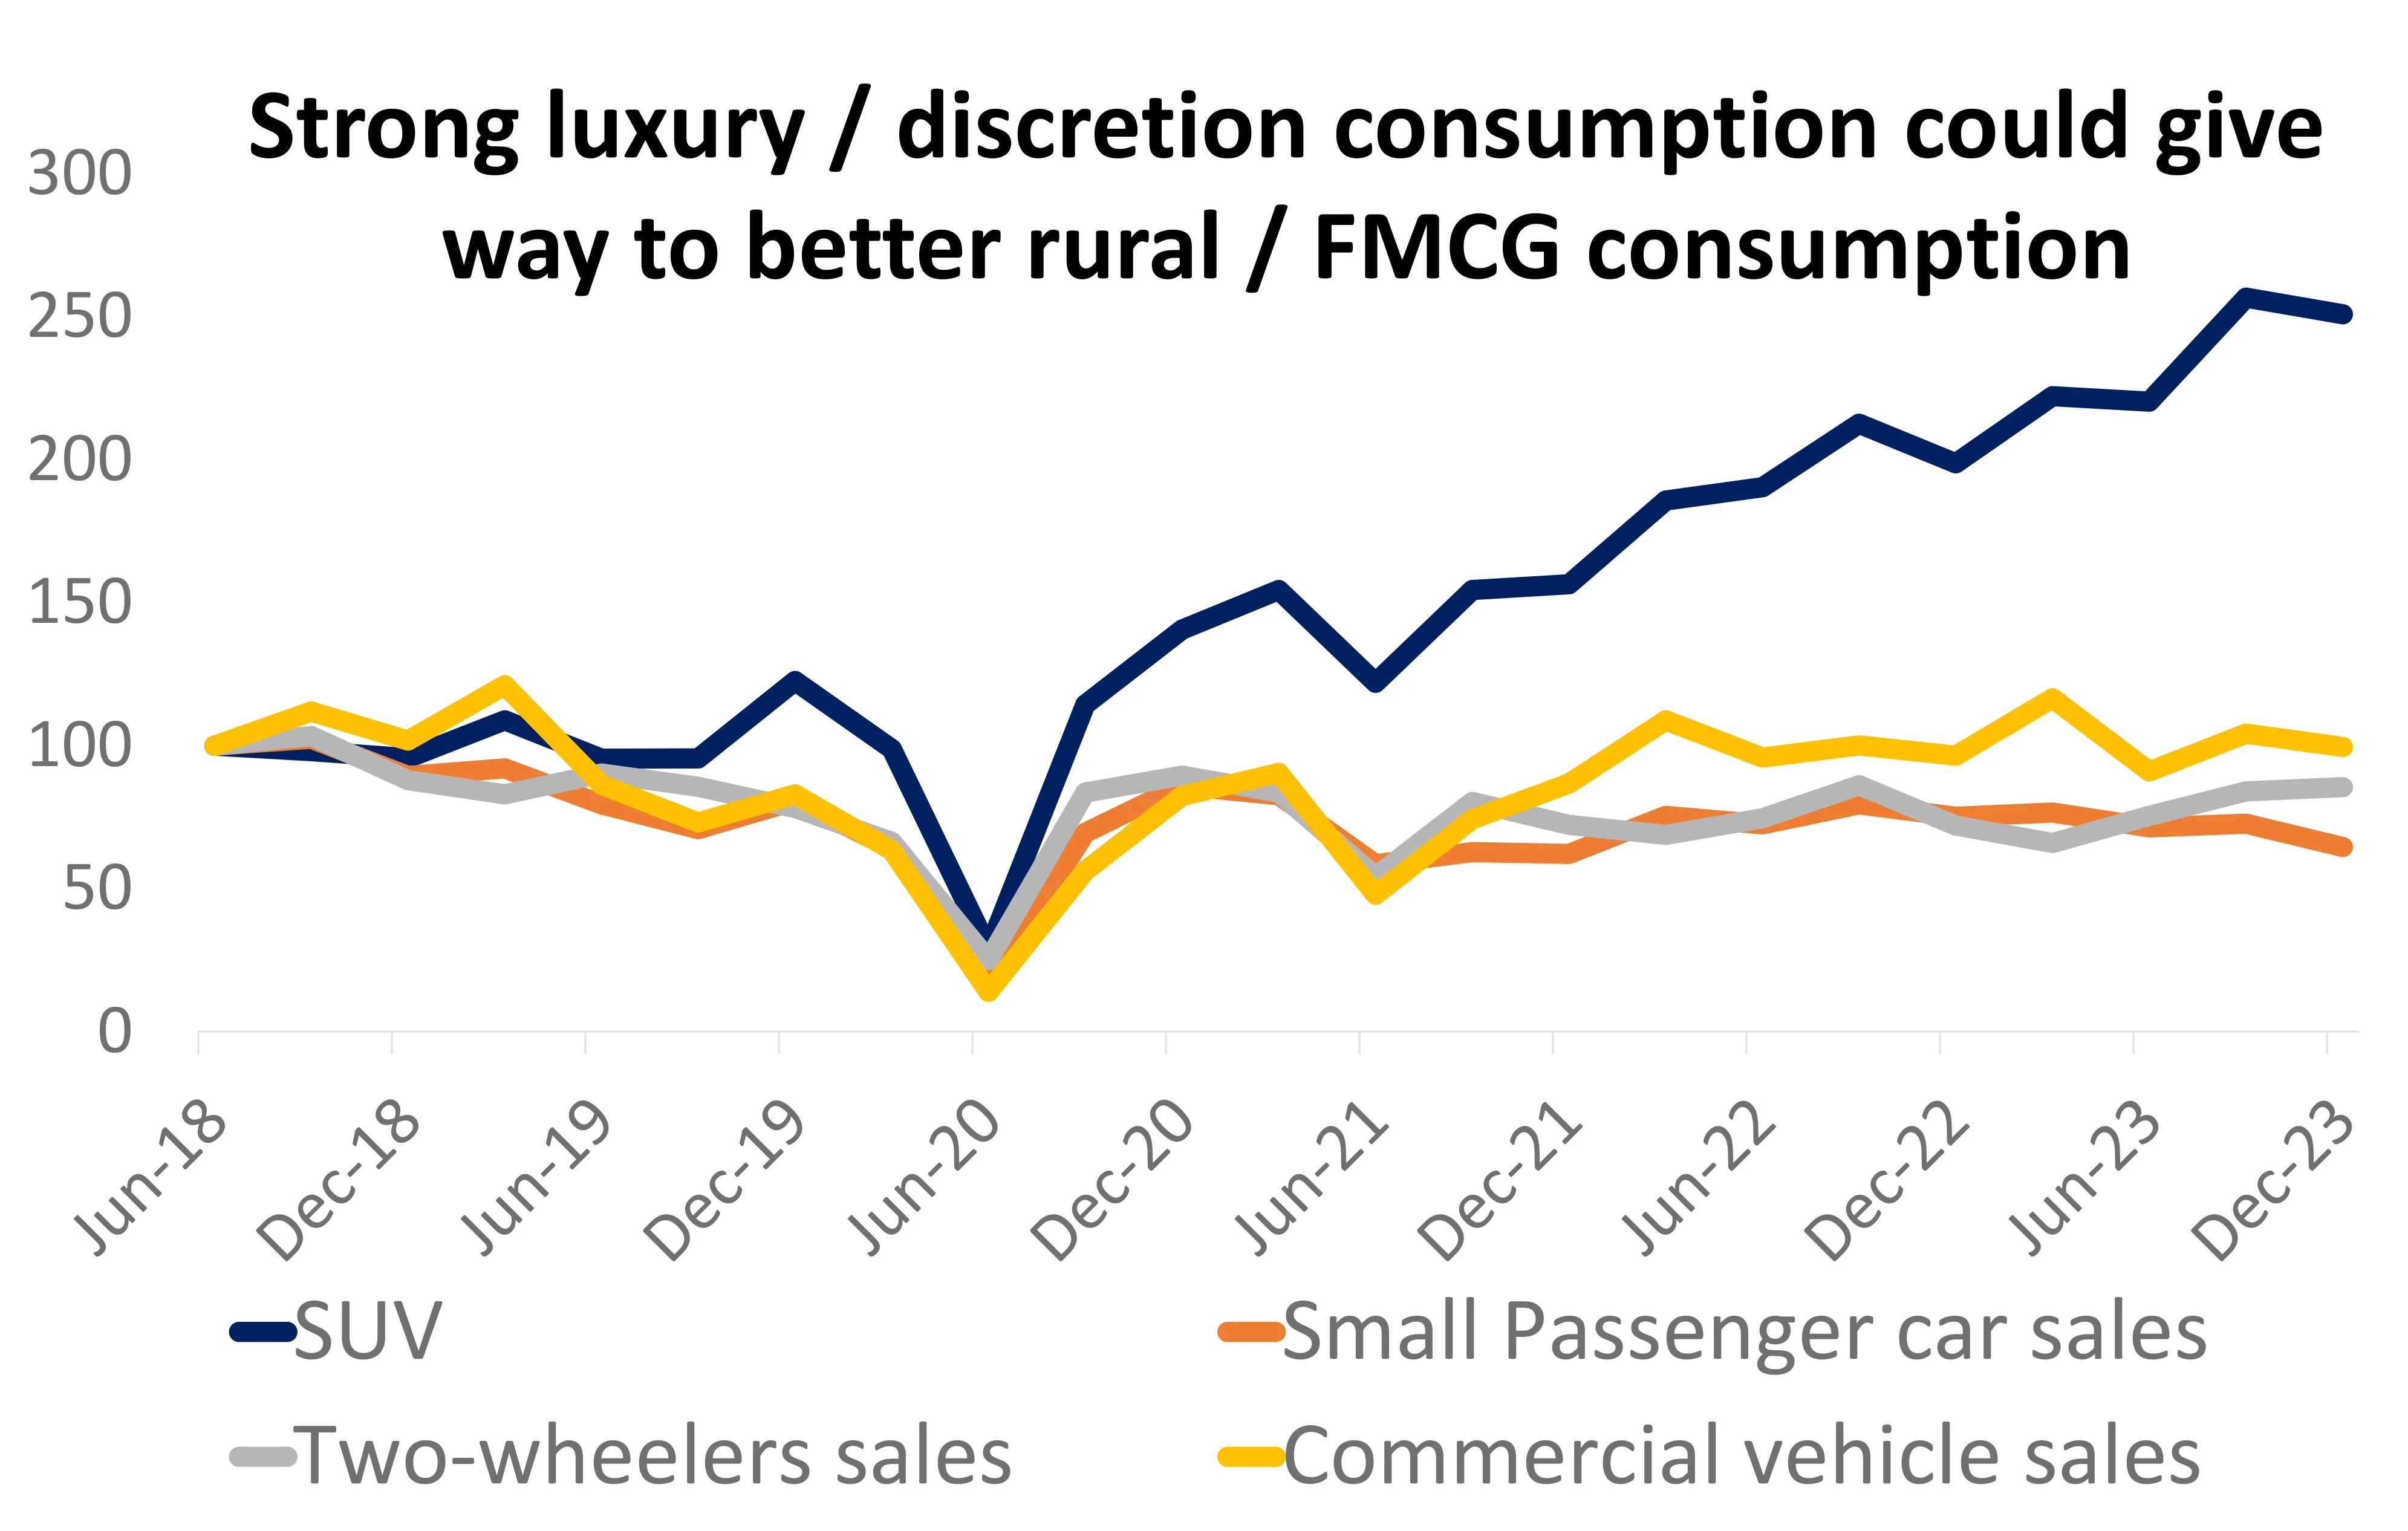
Moderation has now set in wage bill growth. The overall wage bill growth for BSE500 has decelerated to 11%, a notable decline from the 20% observed a couple of quarters ago. Of concern is the more pronounced moderation in the growth of the private sector wage bill, which has slowed to 9% YoY—a ten-year low excluding the impact of COVID-19. If this sharp slowdown continues, it has the potential to impact consumption, especially in the premium segment.
This can also have implications for Small & Midcap stocks which have shown exceptionally strong profit growth led by significantly higher margins. Slowing wages growth, subdued core inflation & expectations of low growth in nominal GDP creates questions about sustainability of SMID earnings momentum and valuations.
Source: Capitalline, Nuvama; Data as on Feb 2024.
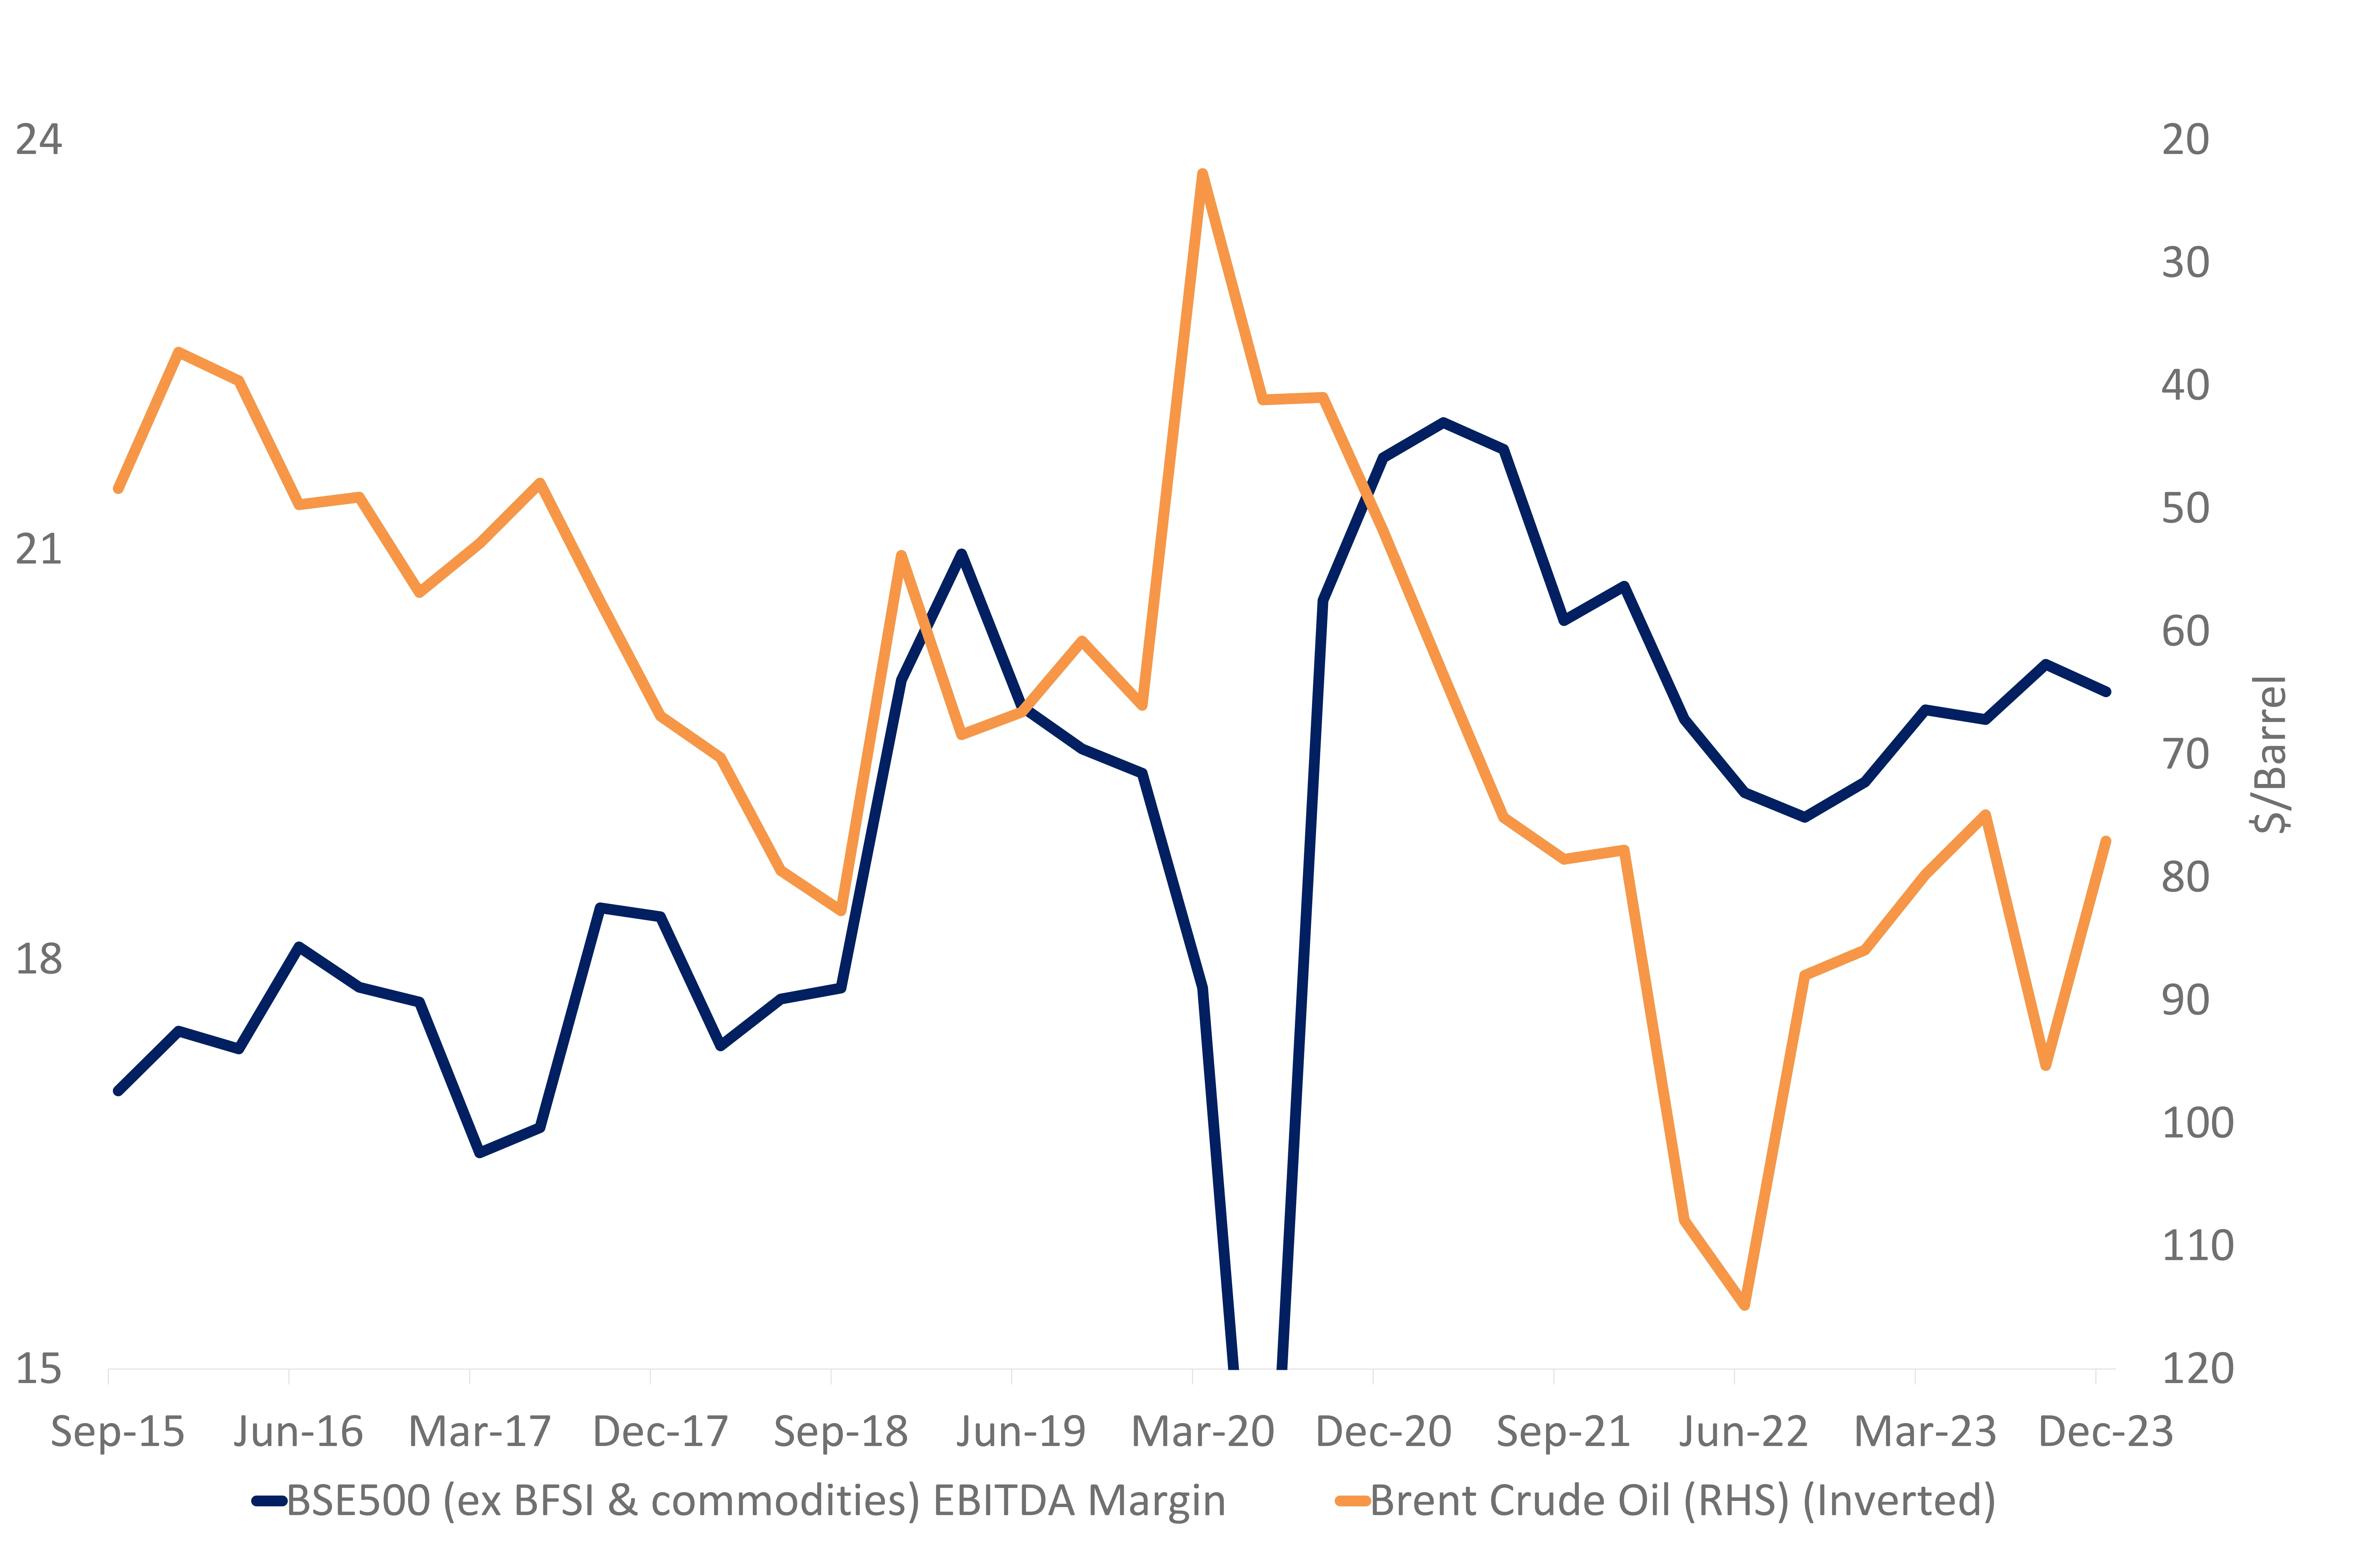
Margin Expansion Advantages are Dwindling
The post COVID price cost cuts and large decline in credit costs helped net profit margins. The subdued WPI inflation levels over the last several quarters helped EBITDA margins recover from higher inflationary pressure of 2022 & early 2023.
However, the margin expansion tailwinds appear to have run their course. Earnings growth of between 18% to 25% over the last 3 years would be hard to repeat for the broader set of firms.
One indication comes from stabilizing Oil prices which move in the opposite direction to BSE 500 (ex BFSI & Commodities) EBITDA margins. This comes at a time when sales growth has slowed to mid single digit.
Market expectation of 18% to 20% profit growth in FY25 & beyond appears stretched. Temper earnings growth expectations & hence return expectations.
Source: Capitalline, Bloomberg; Data as of Feb 2024.
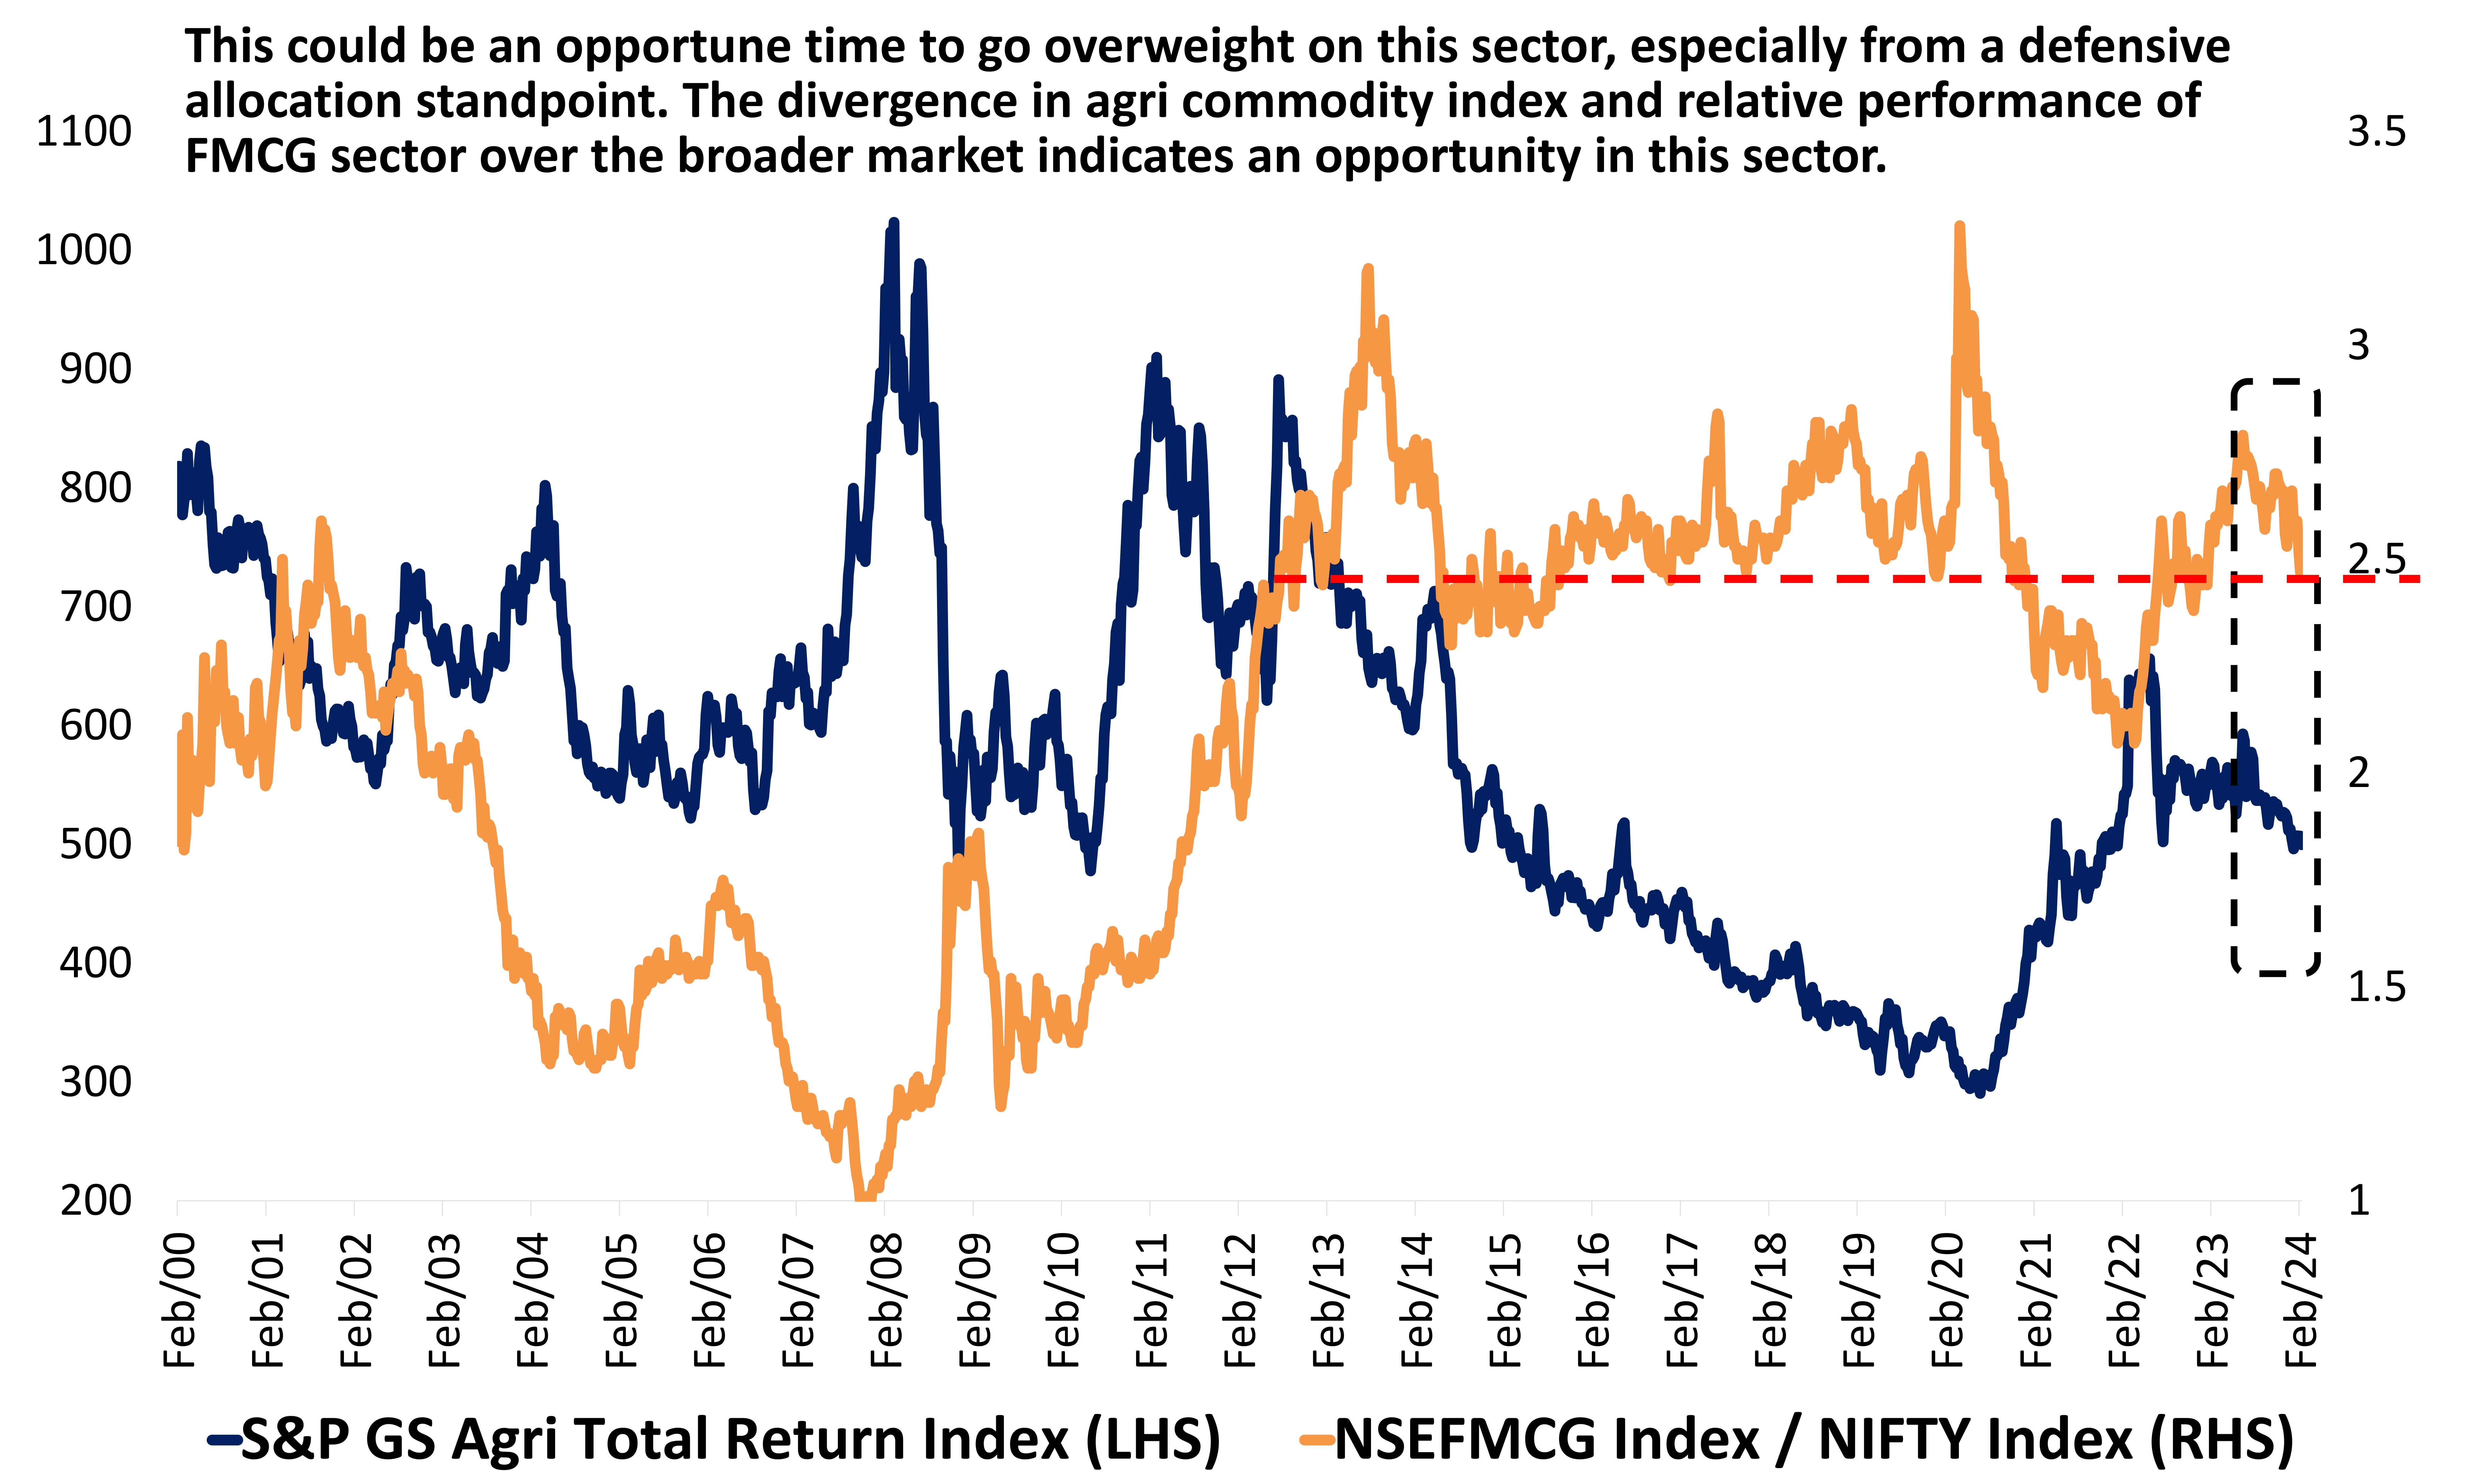
Nifty FMCG Index Enters Zone of Relative Outperformance
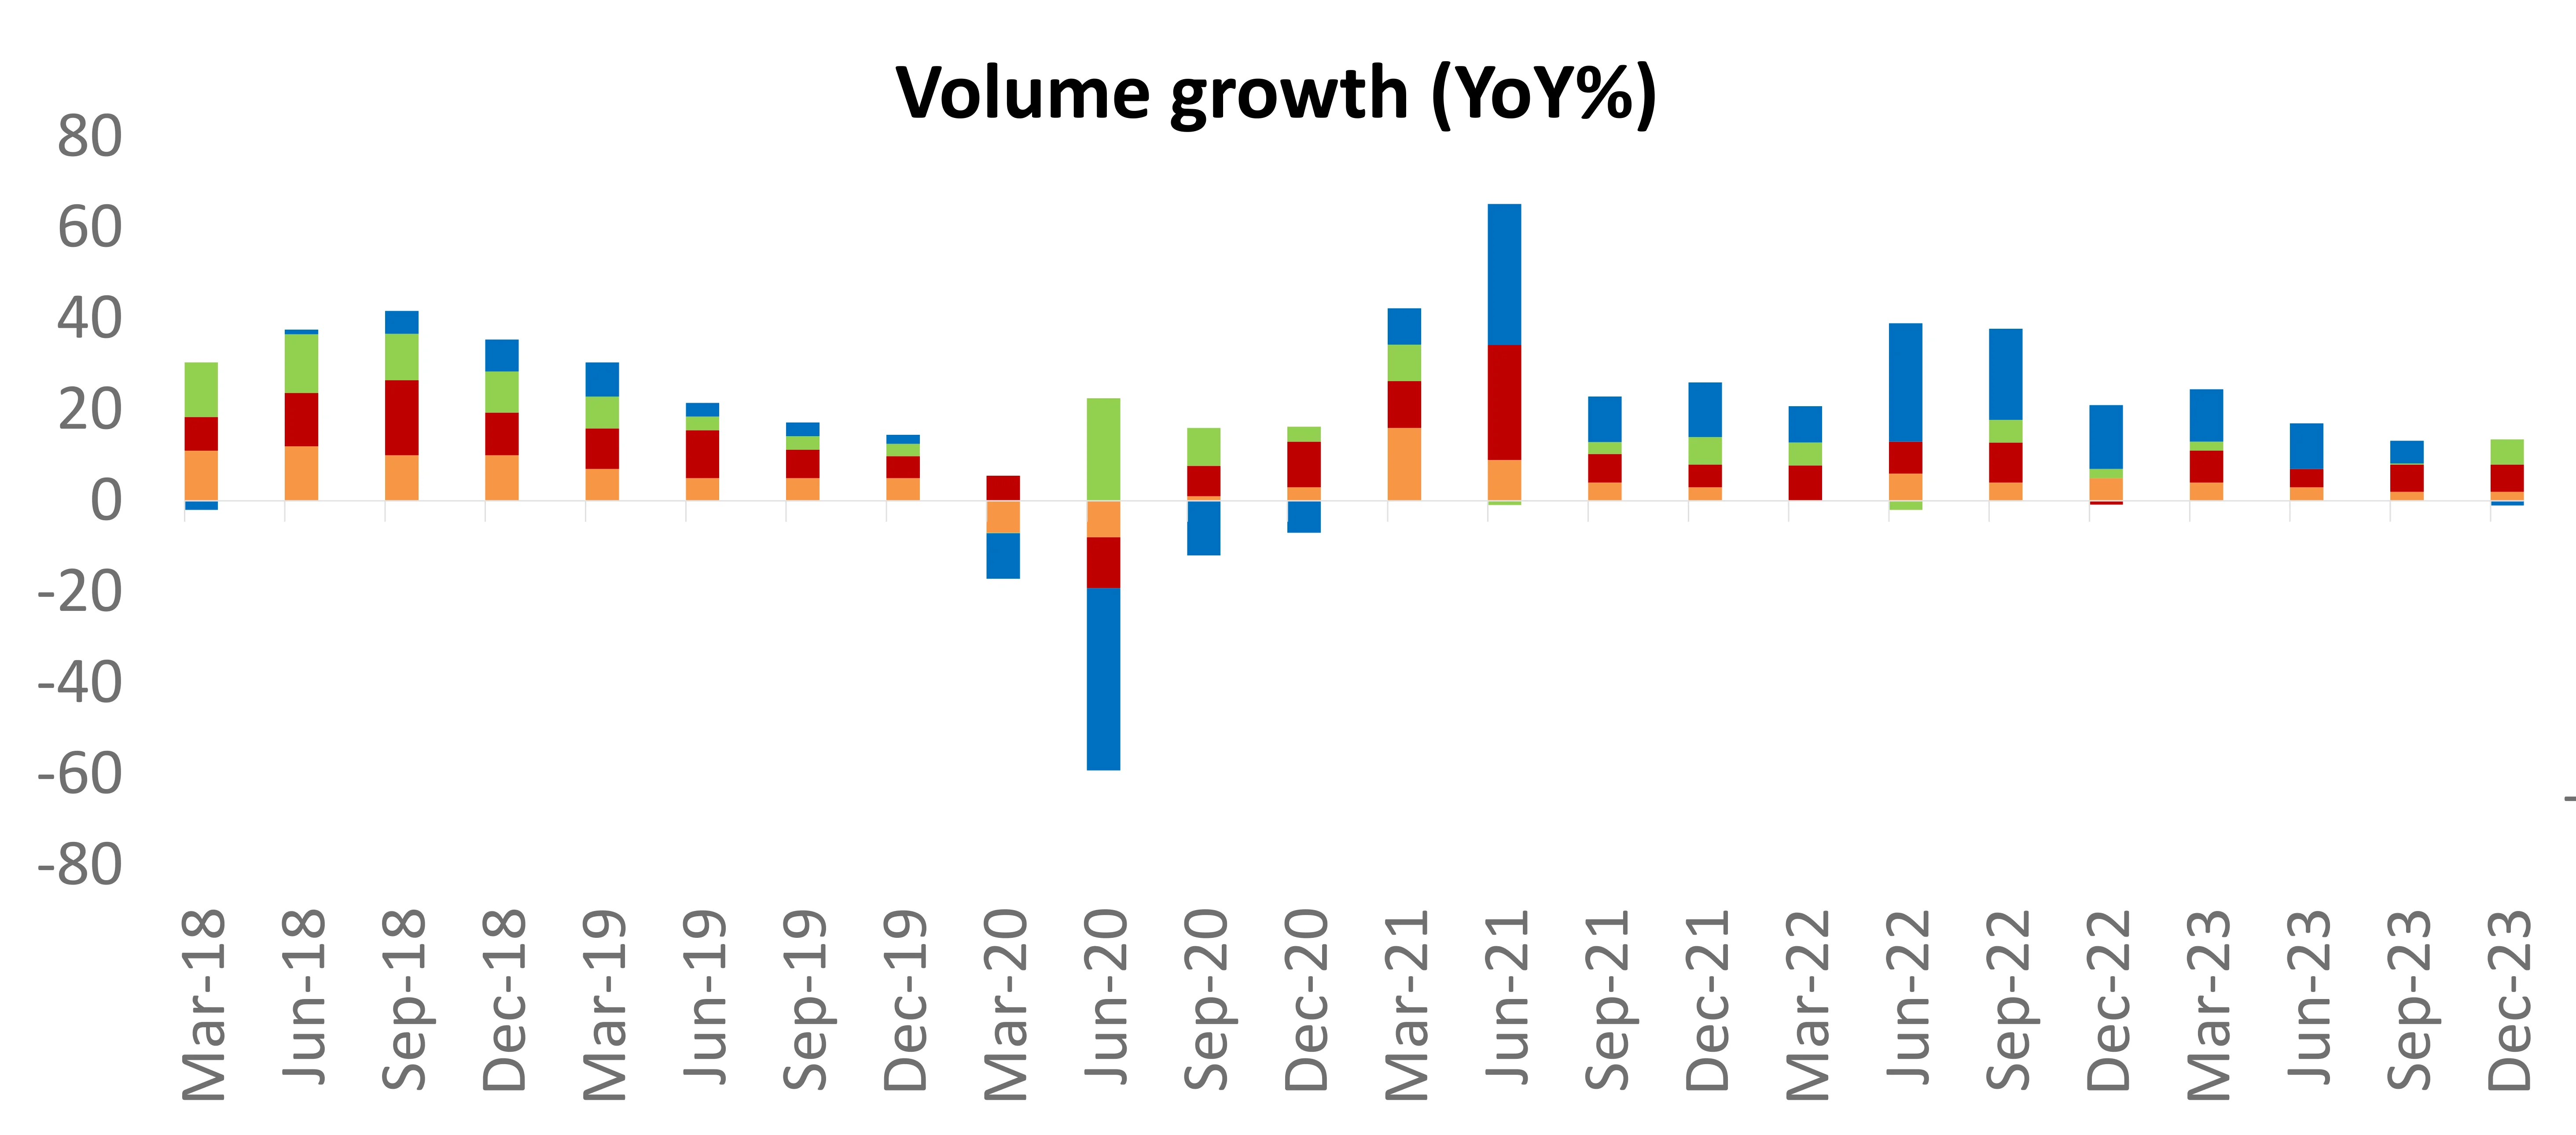
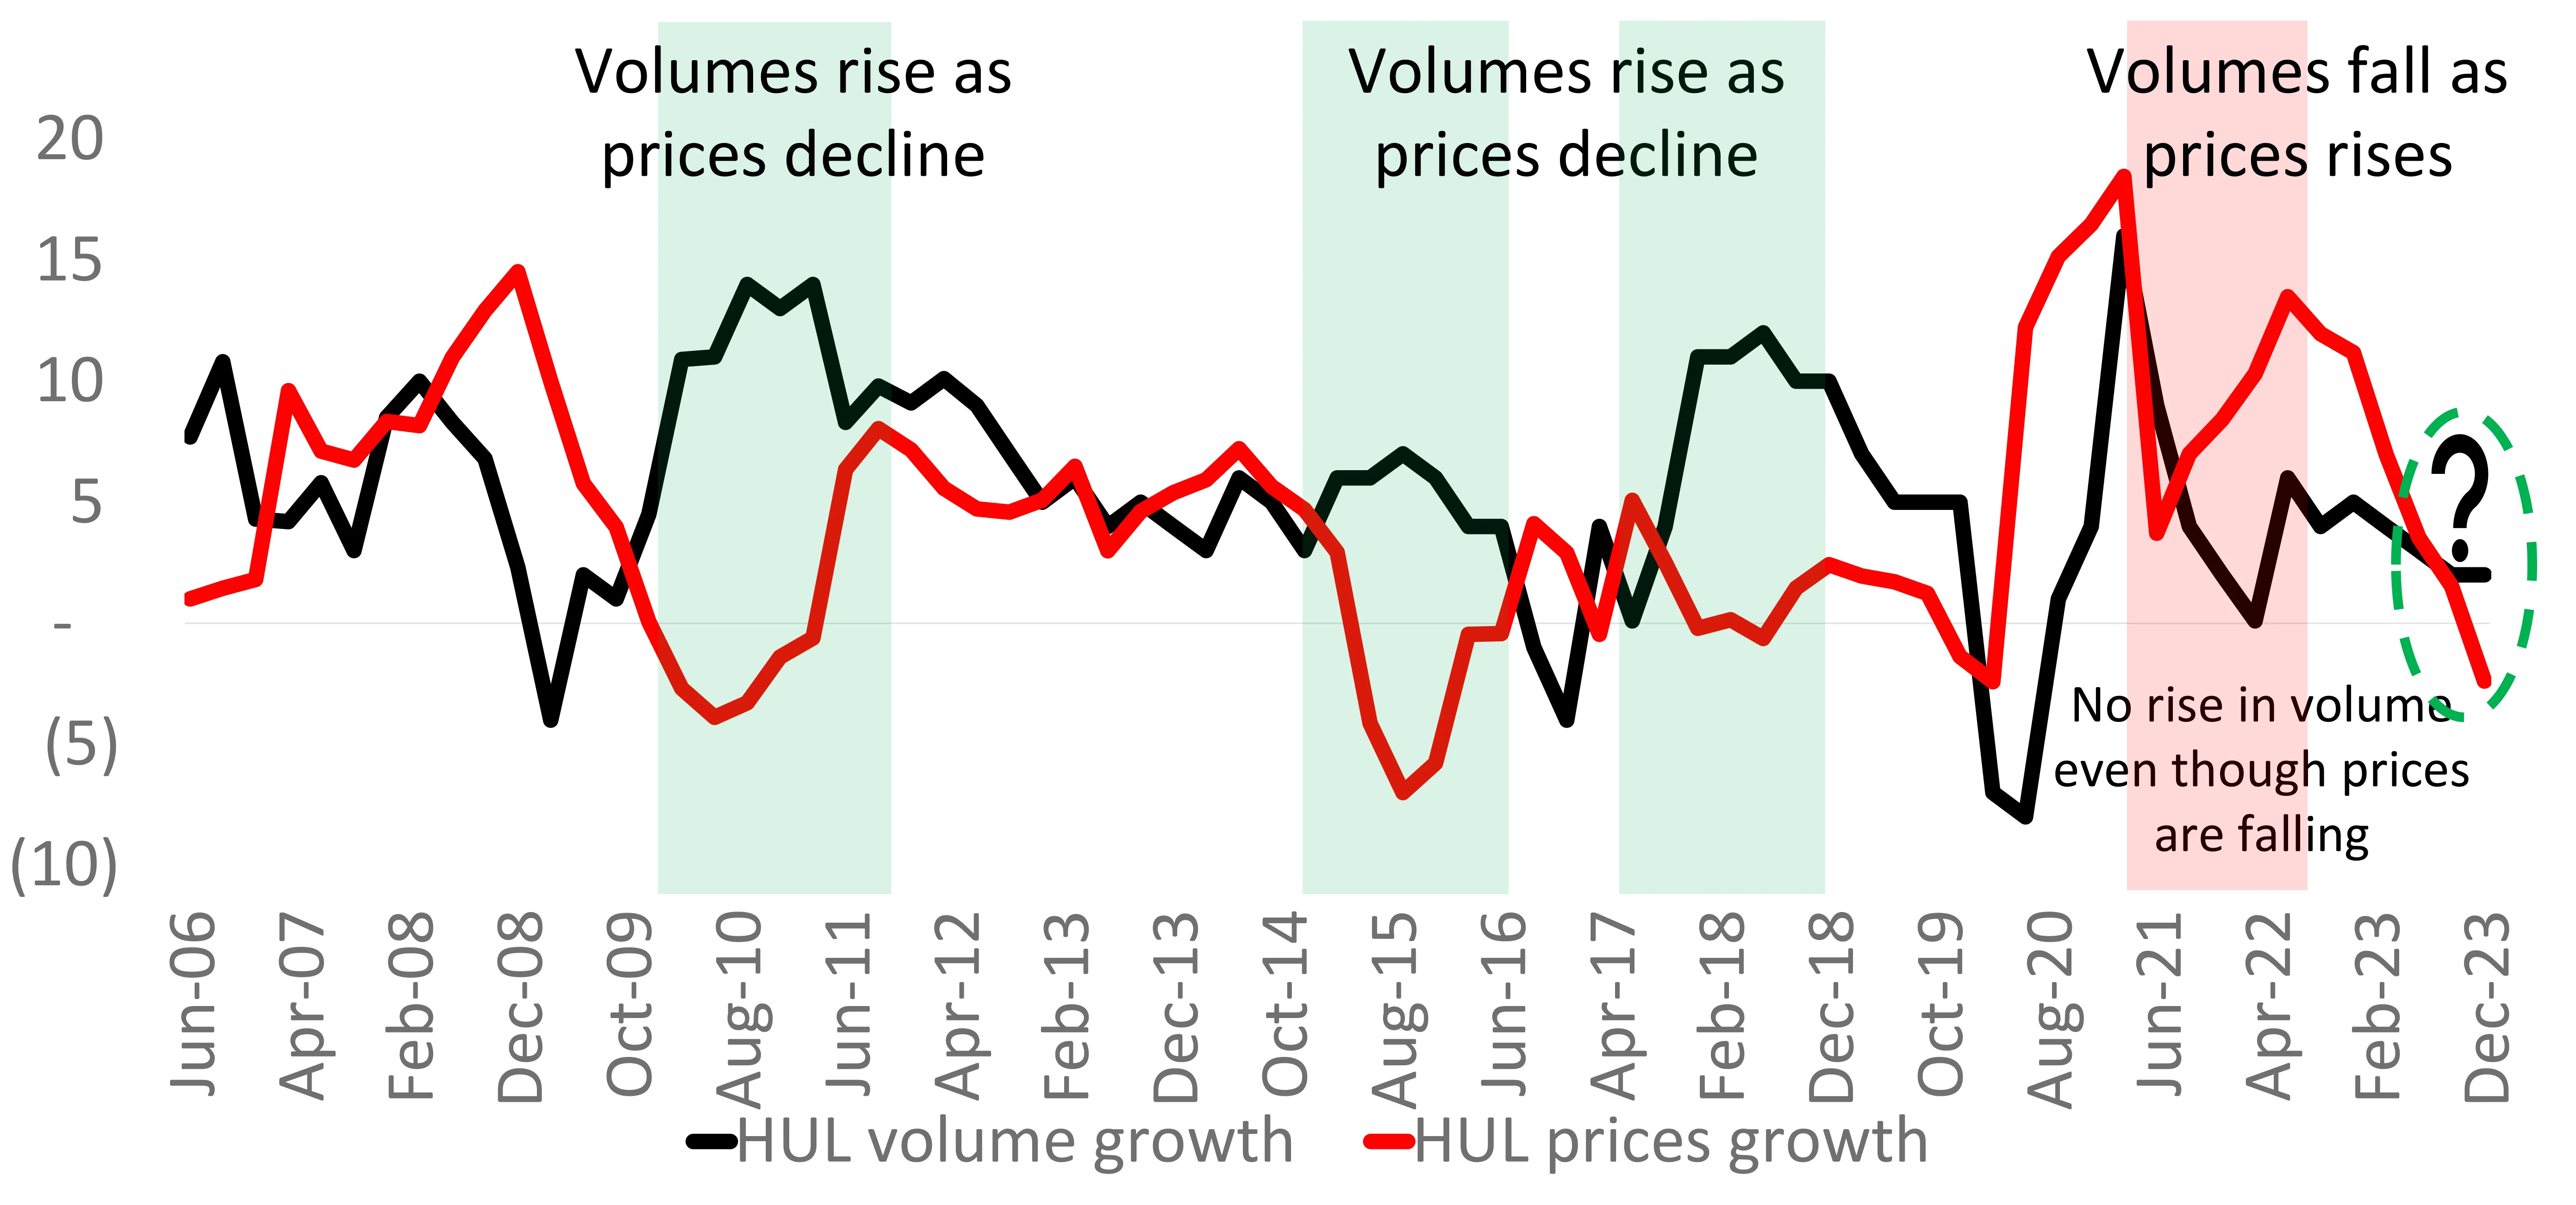
The FMCG sector’s relative performance is mirrored in performance of agricultural commodities. Post the pandemic, the rise in agri commodities & lack of volume growth for the sector has made the sector unattractive. On a relative price performance basis, the index is now trading at levels seen back in 2019, 2015 and 2012.
Additionally, whenever agricultural and other commodity prices decline, it aids the FMCG sector recovery. Recently the S&P GS Agriculture index hit its lowest level in the last 2 years. This comes at a time when the Nifty FMCG Index has been underperforming Nifty Index.
This could be an opportune time to go overweight on this sector, especially from a defensive allocation standpoint.
Source: Bloomberg; Data as of Feb 2024.
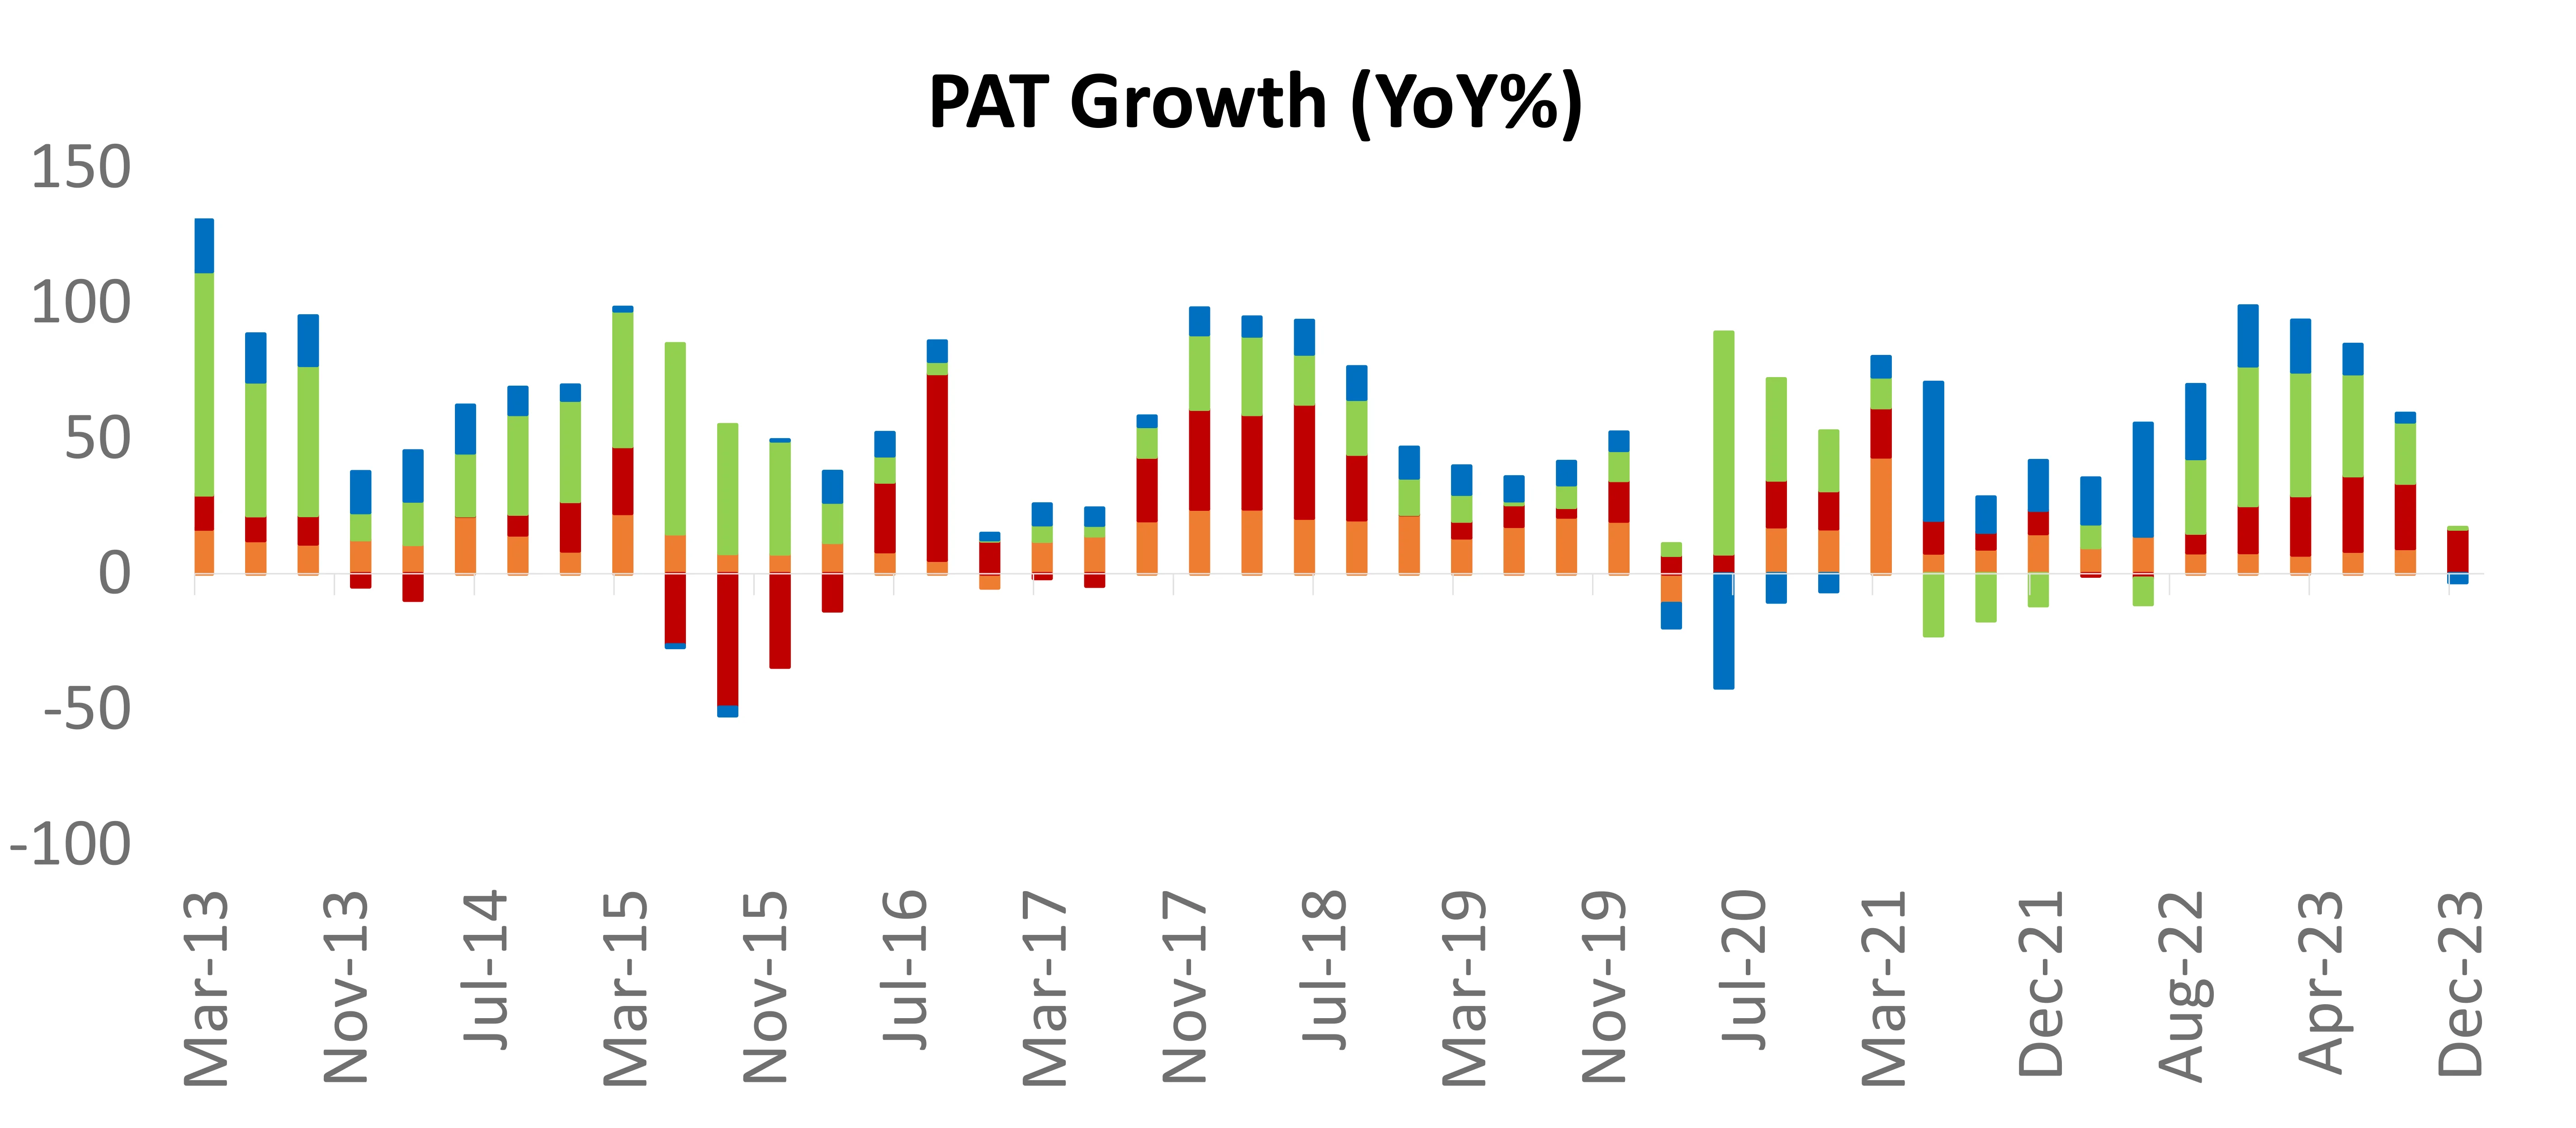
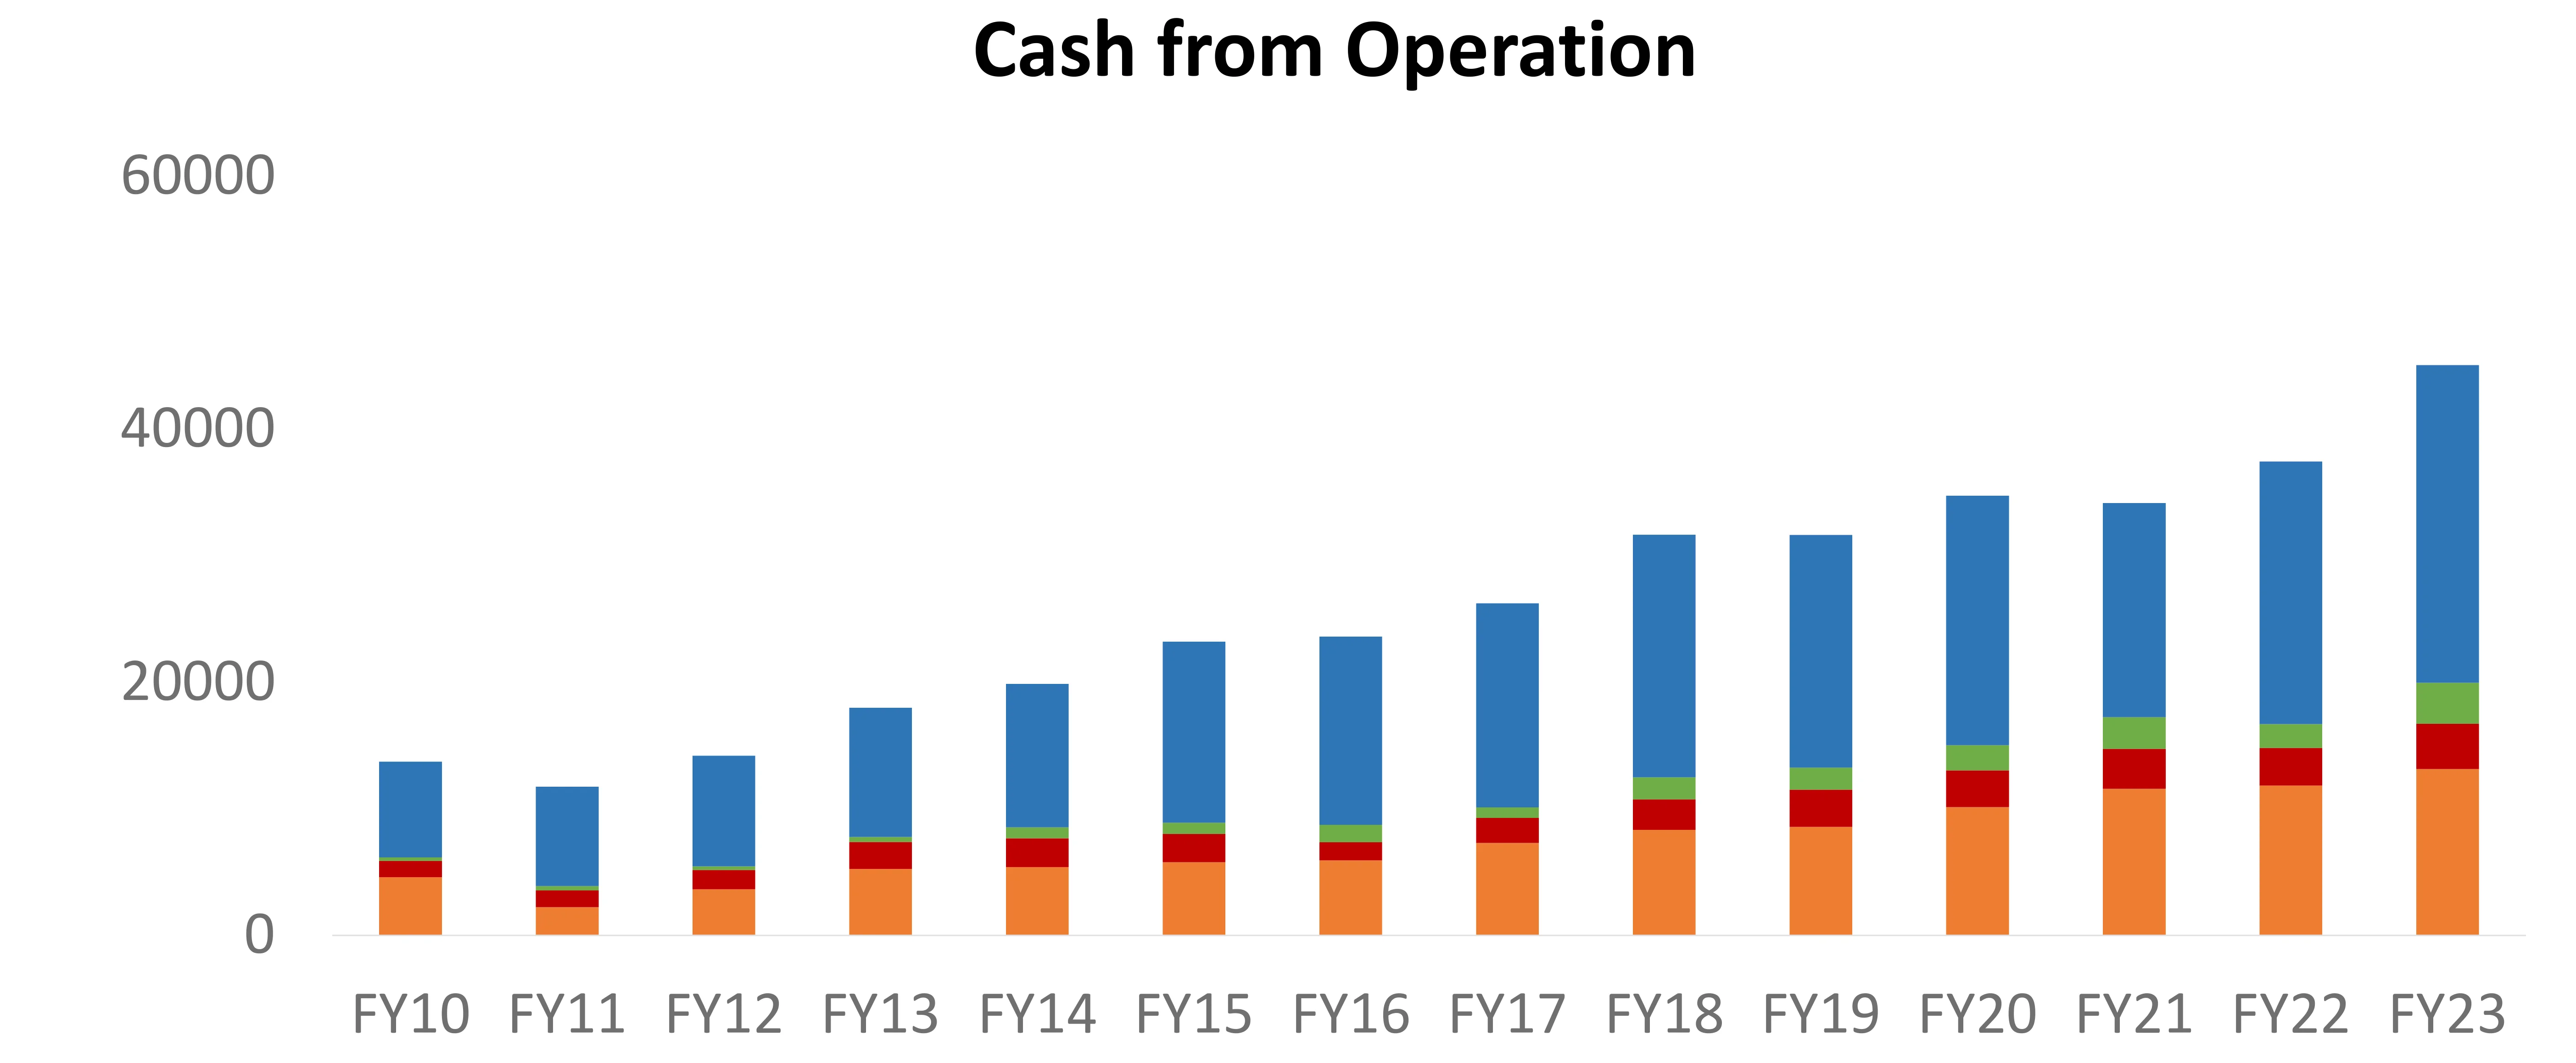
FMCG – In Long Consolidation, But Signs of Turnaround Are Emerging
Source: Capitaline. Data as of Feb 2024
Time For A Reversal In Private Bank Index?
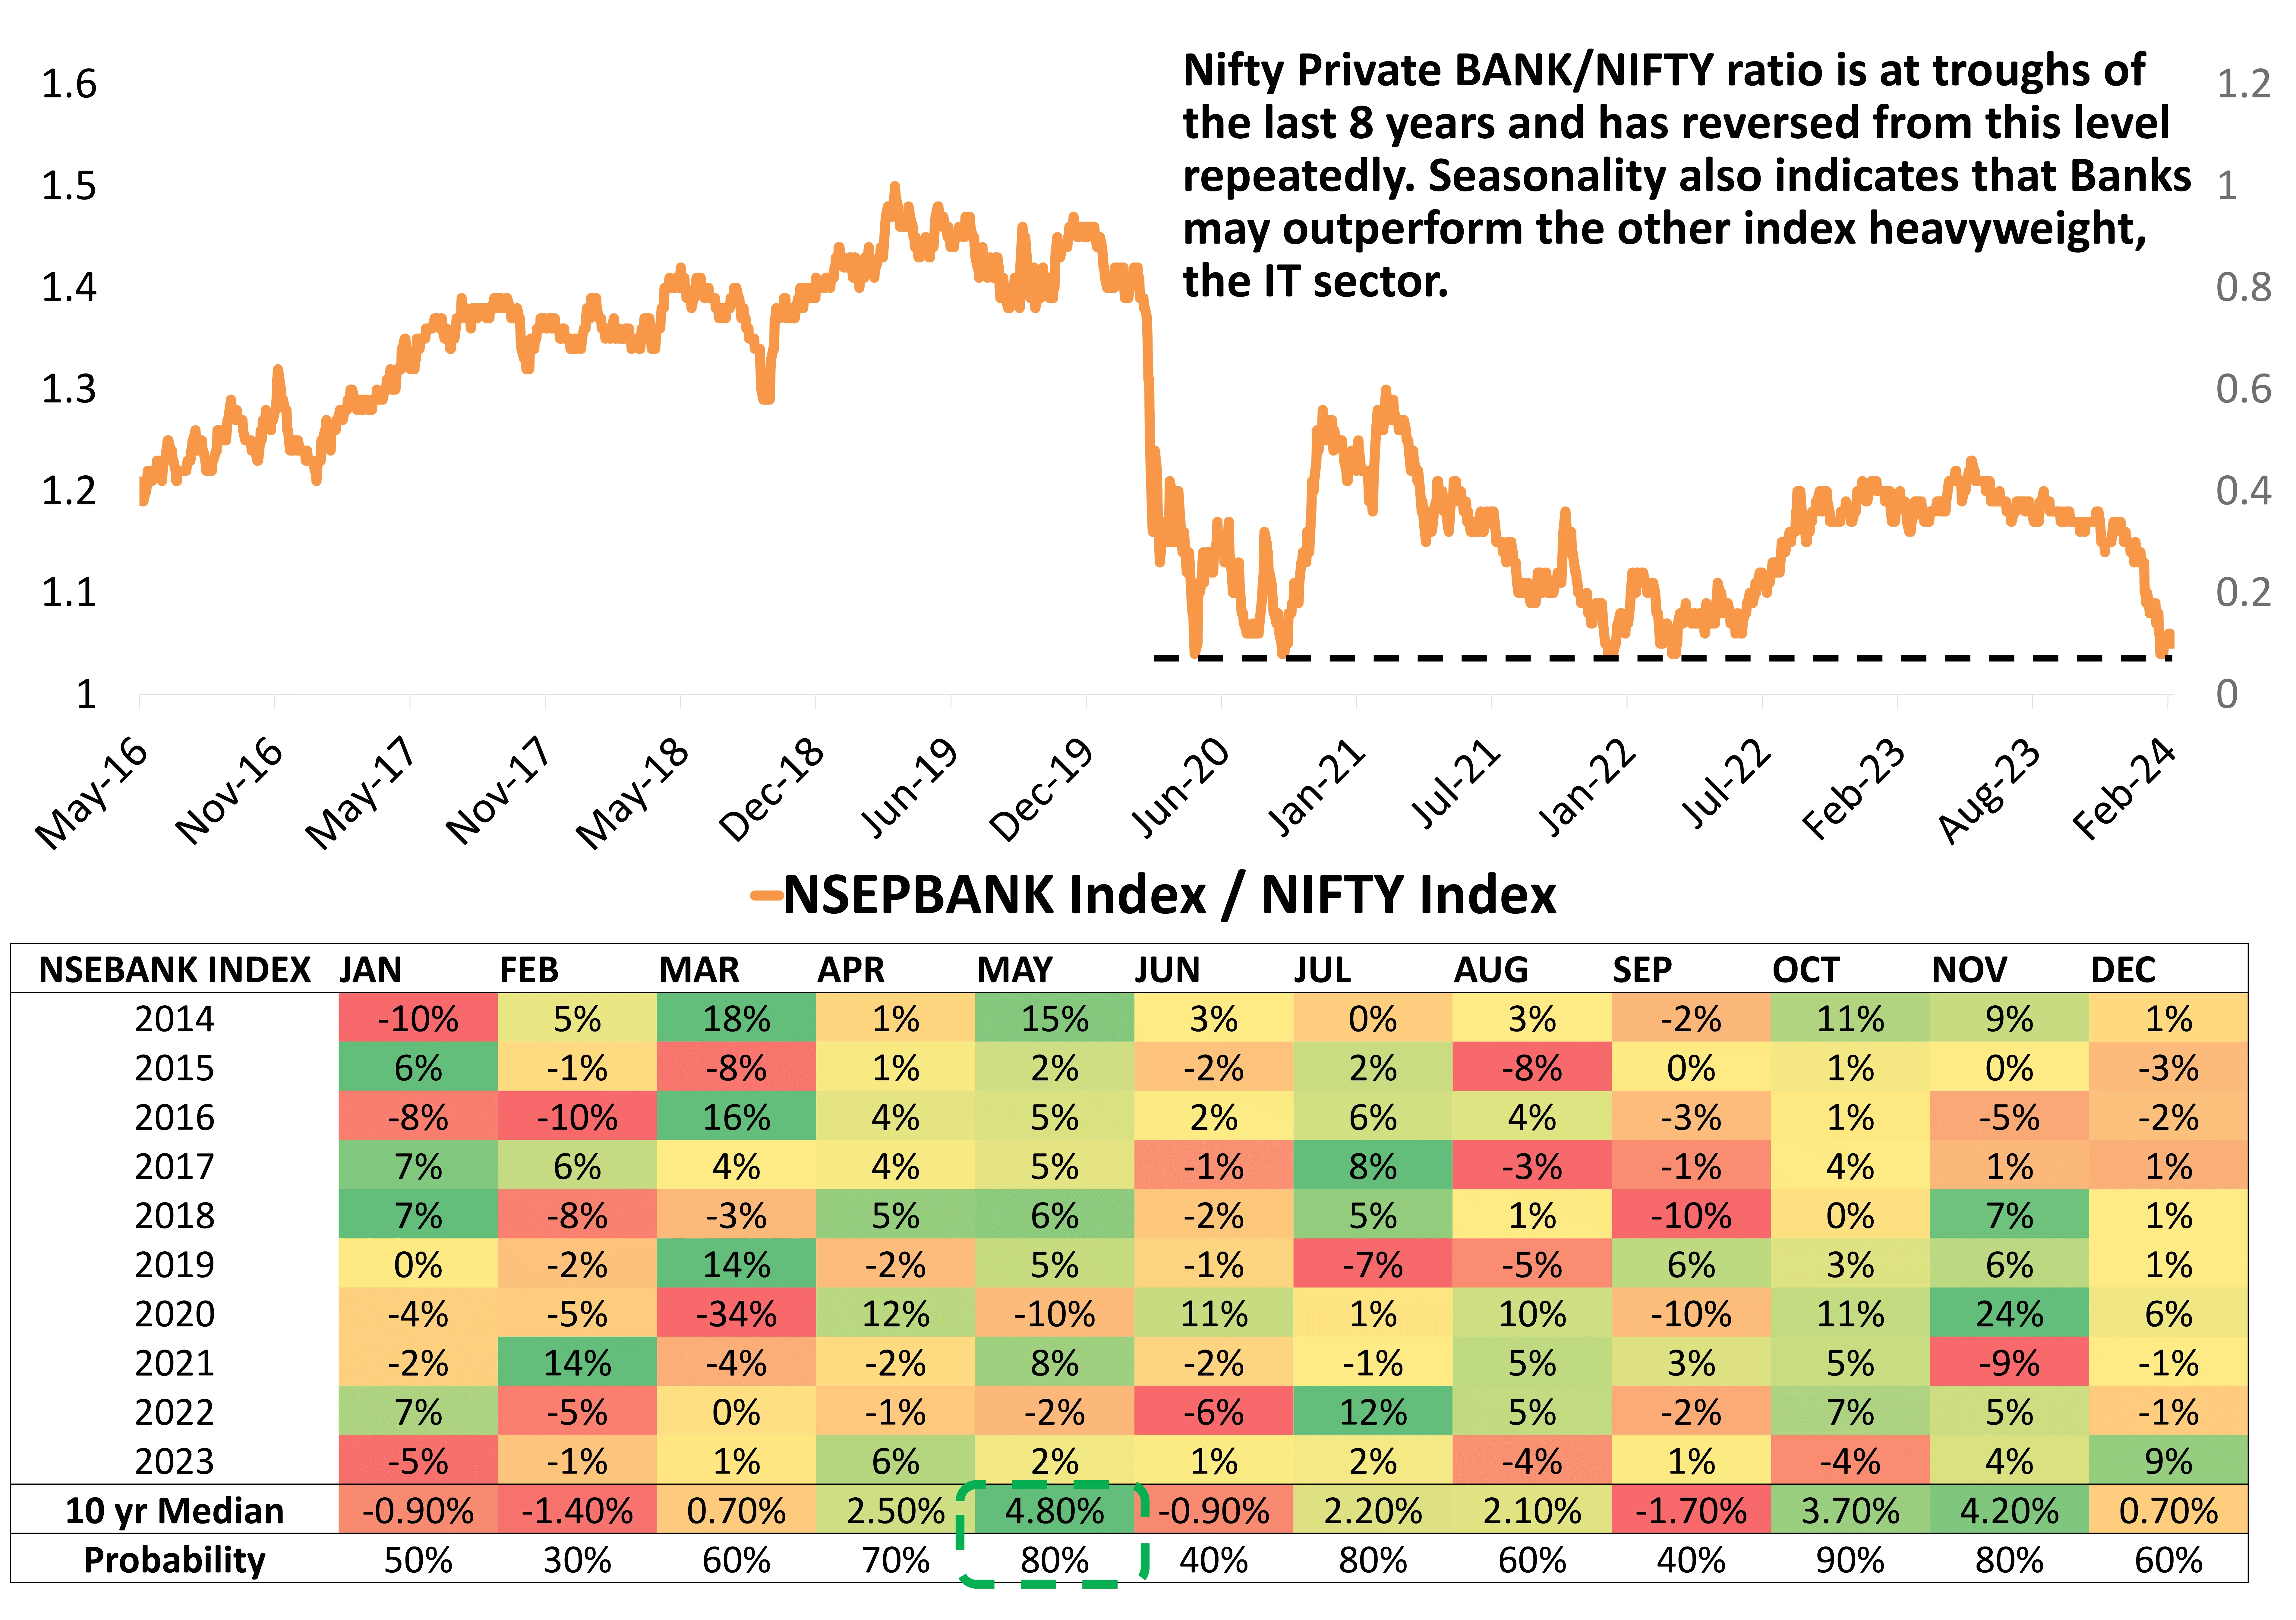
Banks, especially HDFCB, have been closely watched for short positions in the last two months. HDFCB's open interest surged by 114% post a decline, indicating a positive correlation with retail net positions in stock futures. This suggests accumulation by the Retail/HNI category during the recent downturn. With the FTSE trigger in mid-March, the stock may see support from inflows of $400-450 million. Post-March, a weight-up in MSCI indices is expected, considering current quarter net selling.
Short covering in HDFCB could impact other names like IIB, KMB, and IDFCFB with significant short build-up. The NSEPBANK/NIFTY ratio is at its lowest in eight years, historically showing a tendency to reverse. Holding short positions in a sector at peak underperformance levels may be impractical.
Meanwhile, the NSEIT index is near its all-time high, but some stocks are under recent pressure. This is another relative performance signal in heavyweight sectors.
Source: Joaquim Fernandes (Axis Capital), Bloomberg; Data as of Feb 2024.
 Account Statement
  Capital Gain Statement
  Key Information Memorandum
  PAN Updation
  Register / Modify KYC Online
  Nominee Registration
  Email / Phone Updation
  OTM / eNACH Registration
  Guidelines for Incapacitated Investors
  FAQs
FAQs Reach us


