DSP NETRA JULY 2023
External Position, Inflation & Opportunities
Can India’s Precarious External Balance Turn Positive?
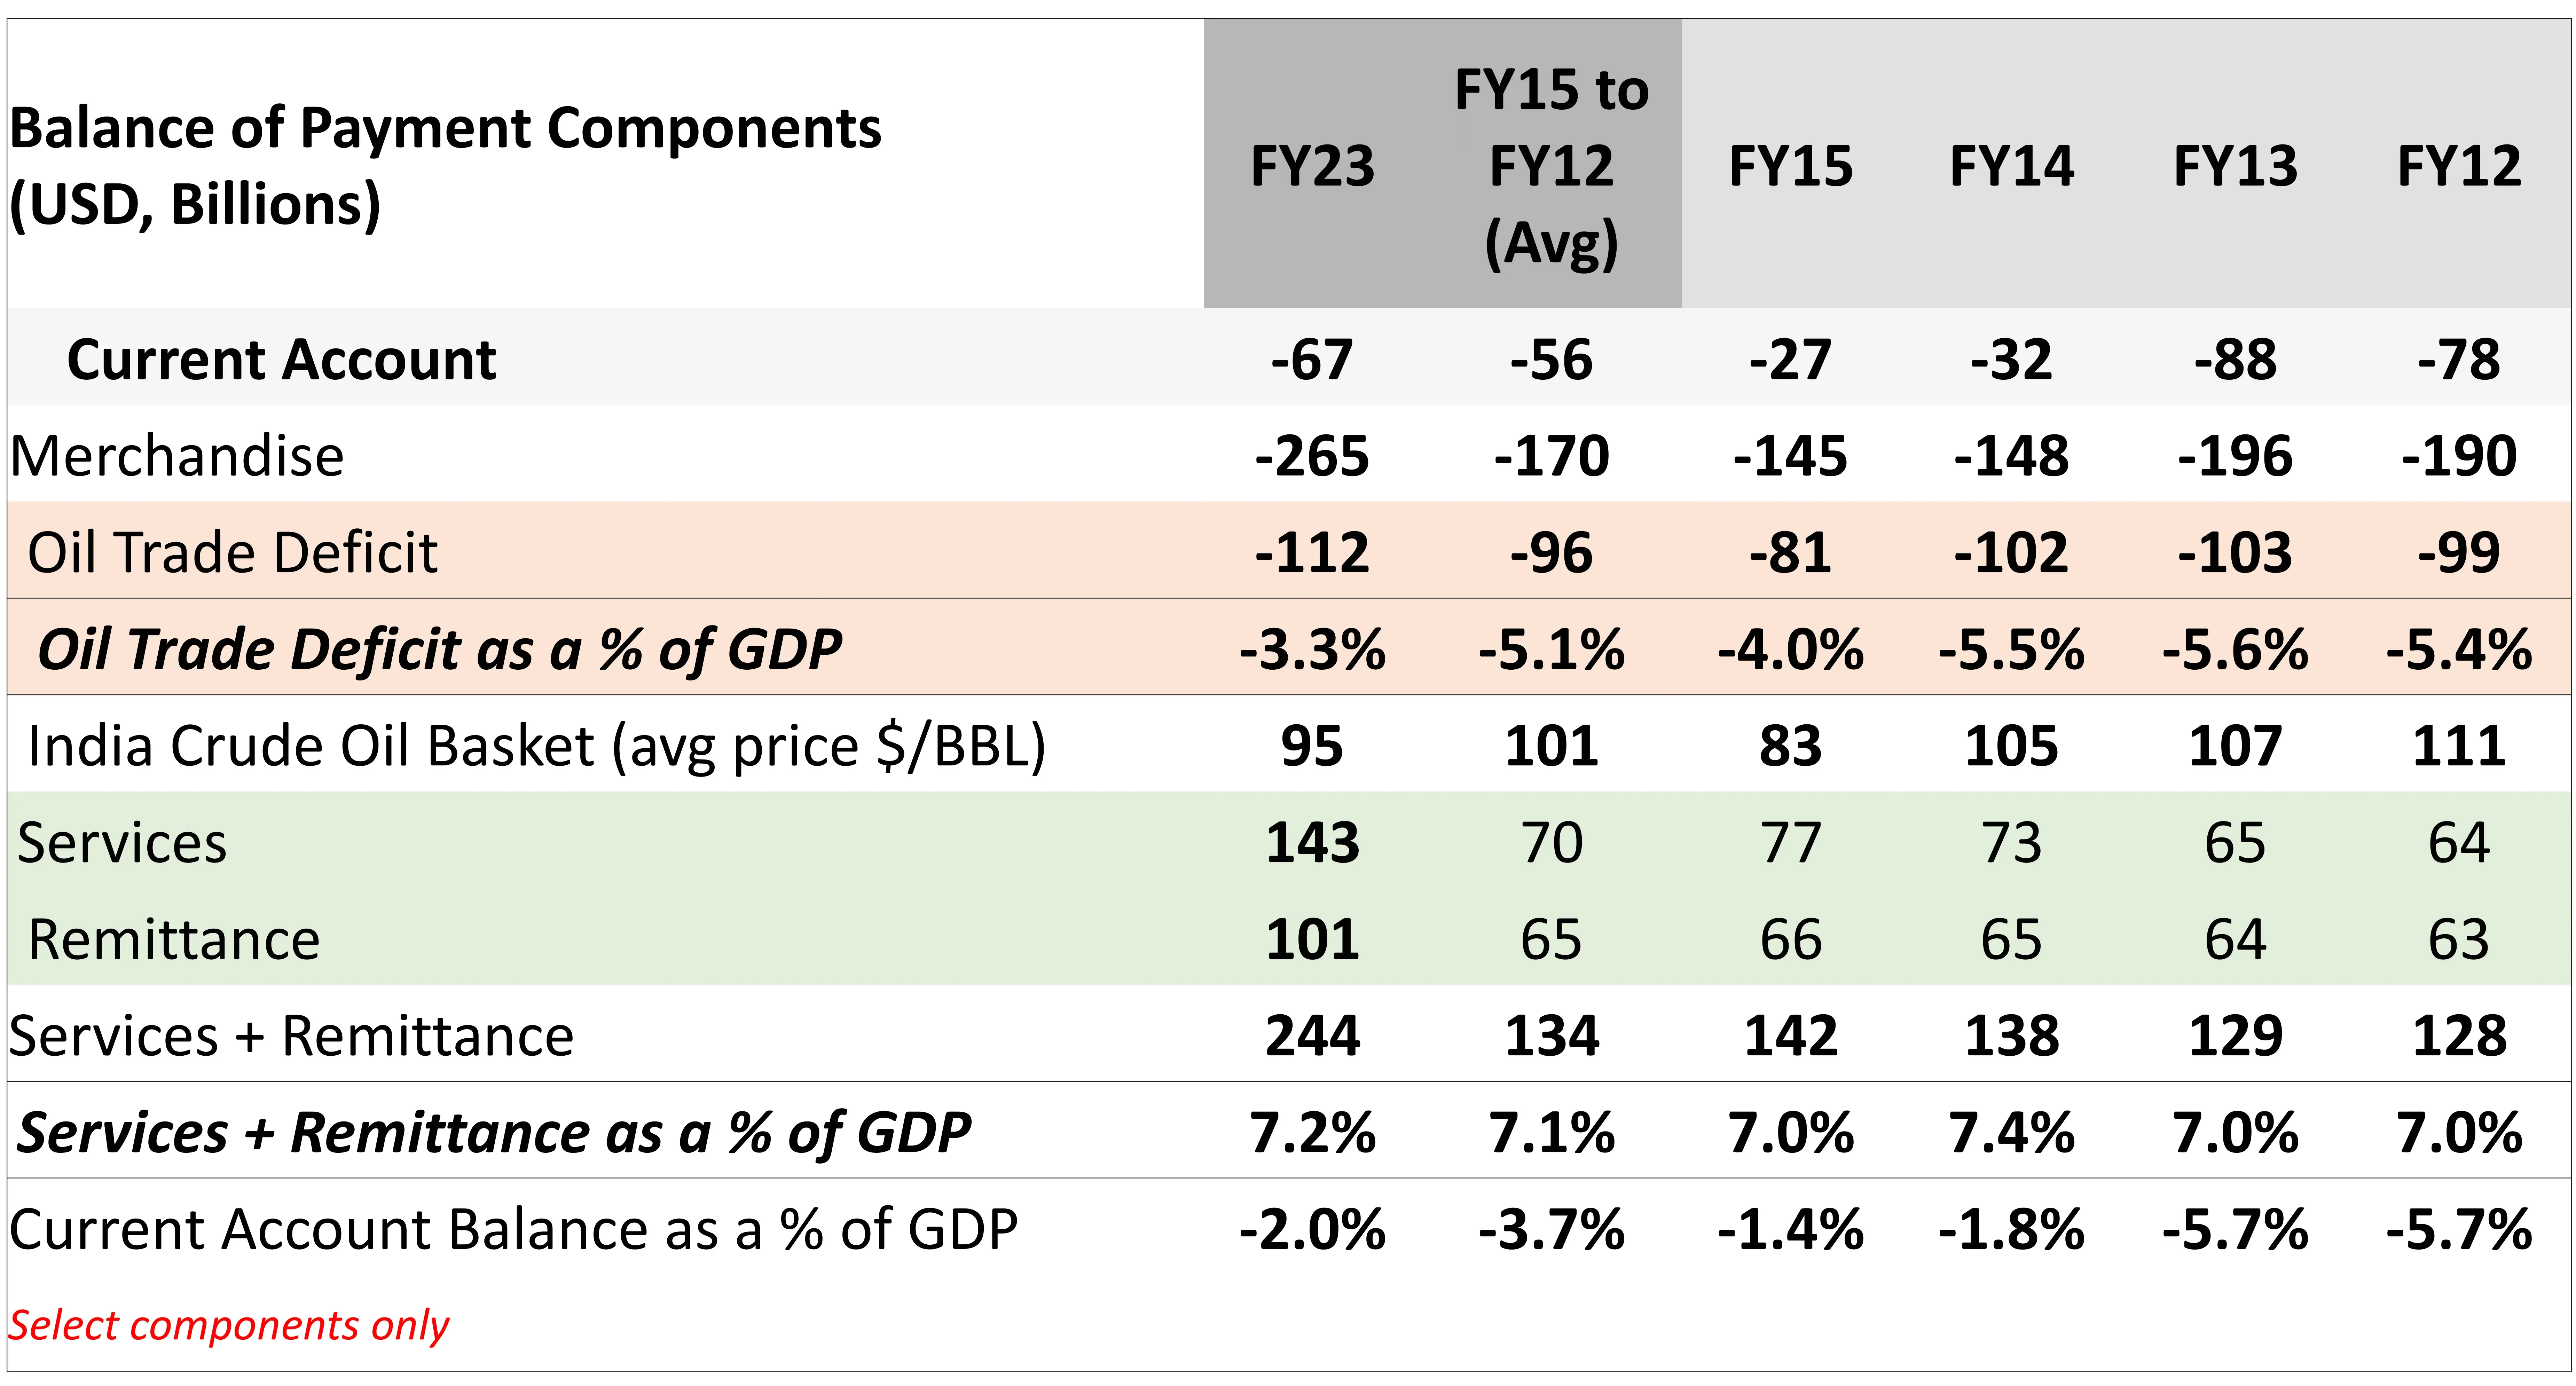
The size of India’s Oil problem (chronic oil trade deficit) is becoming smaller as the size of the economy, the GDP, rises.
Whenever Oil has hit $100, India’s Oil trade deficit has risen to 50% share of India’s Merchandise trade deficit in the past and consumed nearly all of Services surplus and remittances. Now, even at $100 Oil, Remittances alone can balance Oil deficit.
In fact, Services + Remittance can balance India’s merchandise trade deficit nearly fully if Crude is at $80 and Indian electronic exports can keep pace with recent upsurge.
Services net exports and remittances are growing at 6% CAGR in US Dollar terms. This is one of the best USD growth rates for any country in the world.

"What could cause India's current account to turn into a surplus is $60 crude or lower, a steady pace of growth in India's services exports (5% CAGR), along with a rise in India's electronic goods exports to $40 billion, from FY23 total of $24Bn, over the next 5 years."
Source: MOSPI, PPAC, Bloomberg, DSP Data as on June 2023
What Does A Coincidental Turn in FPI Flows And Trade Balance Mean?
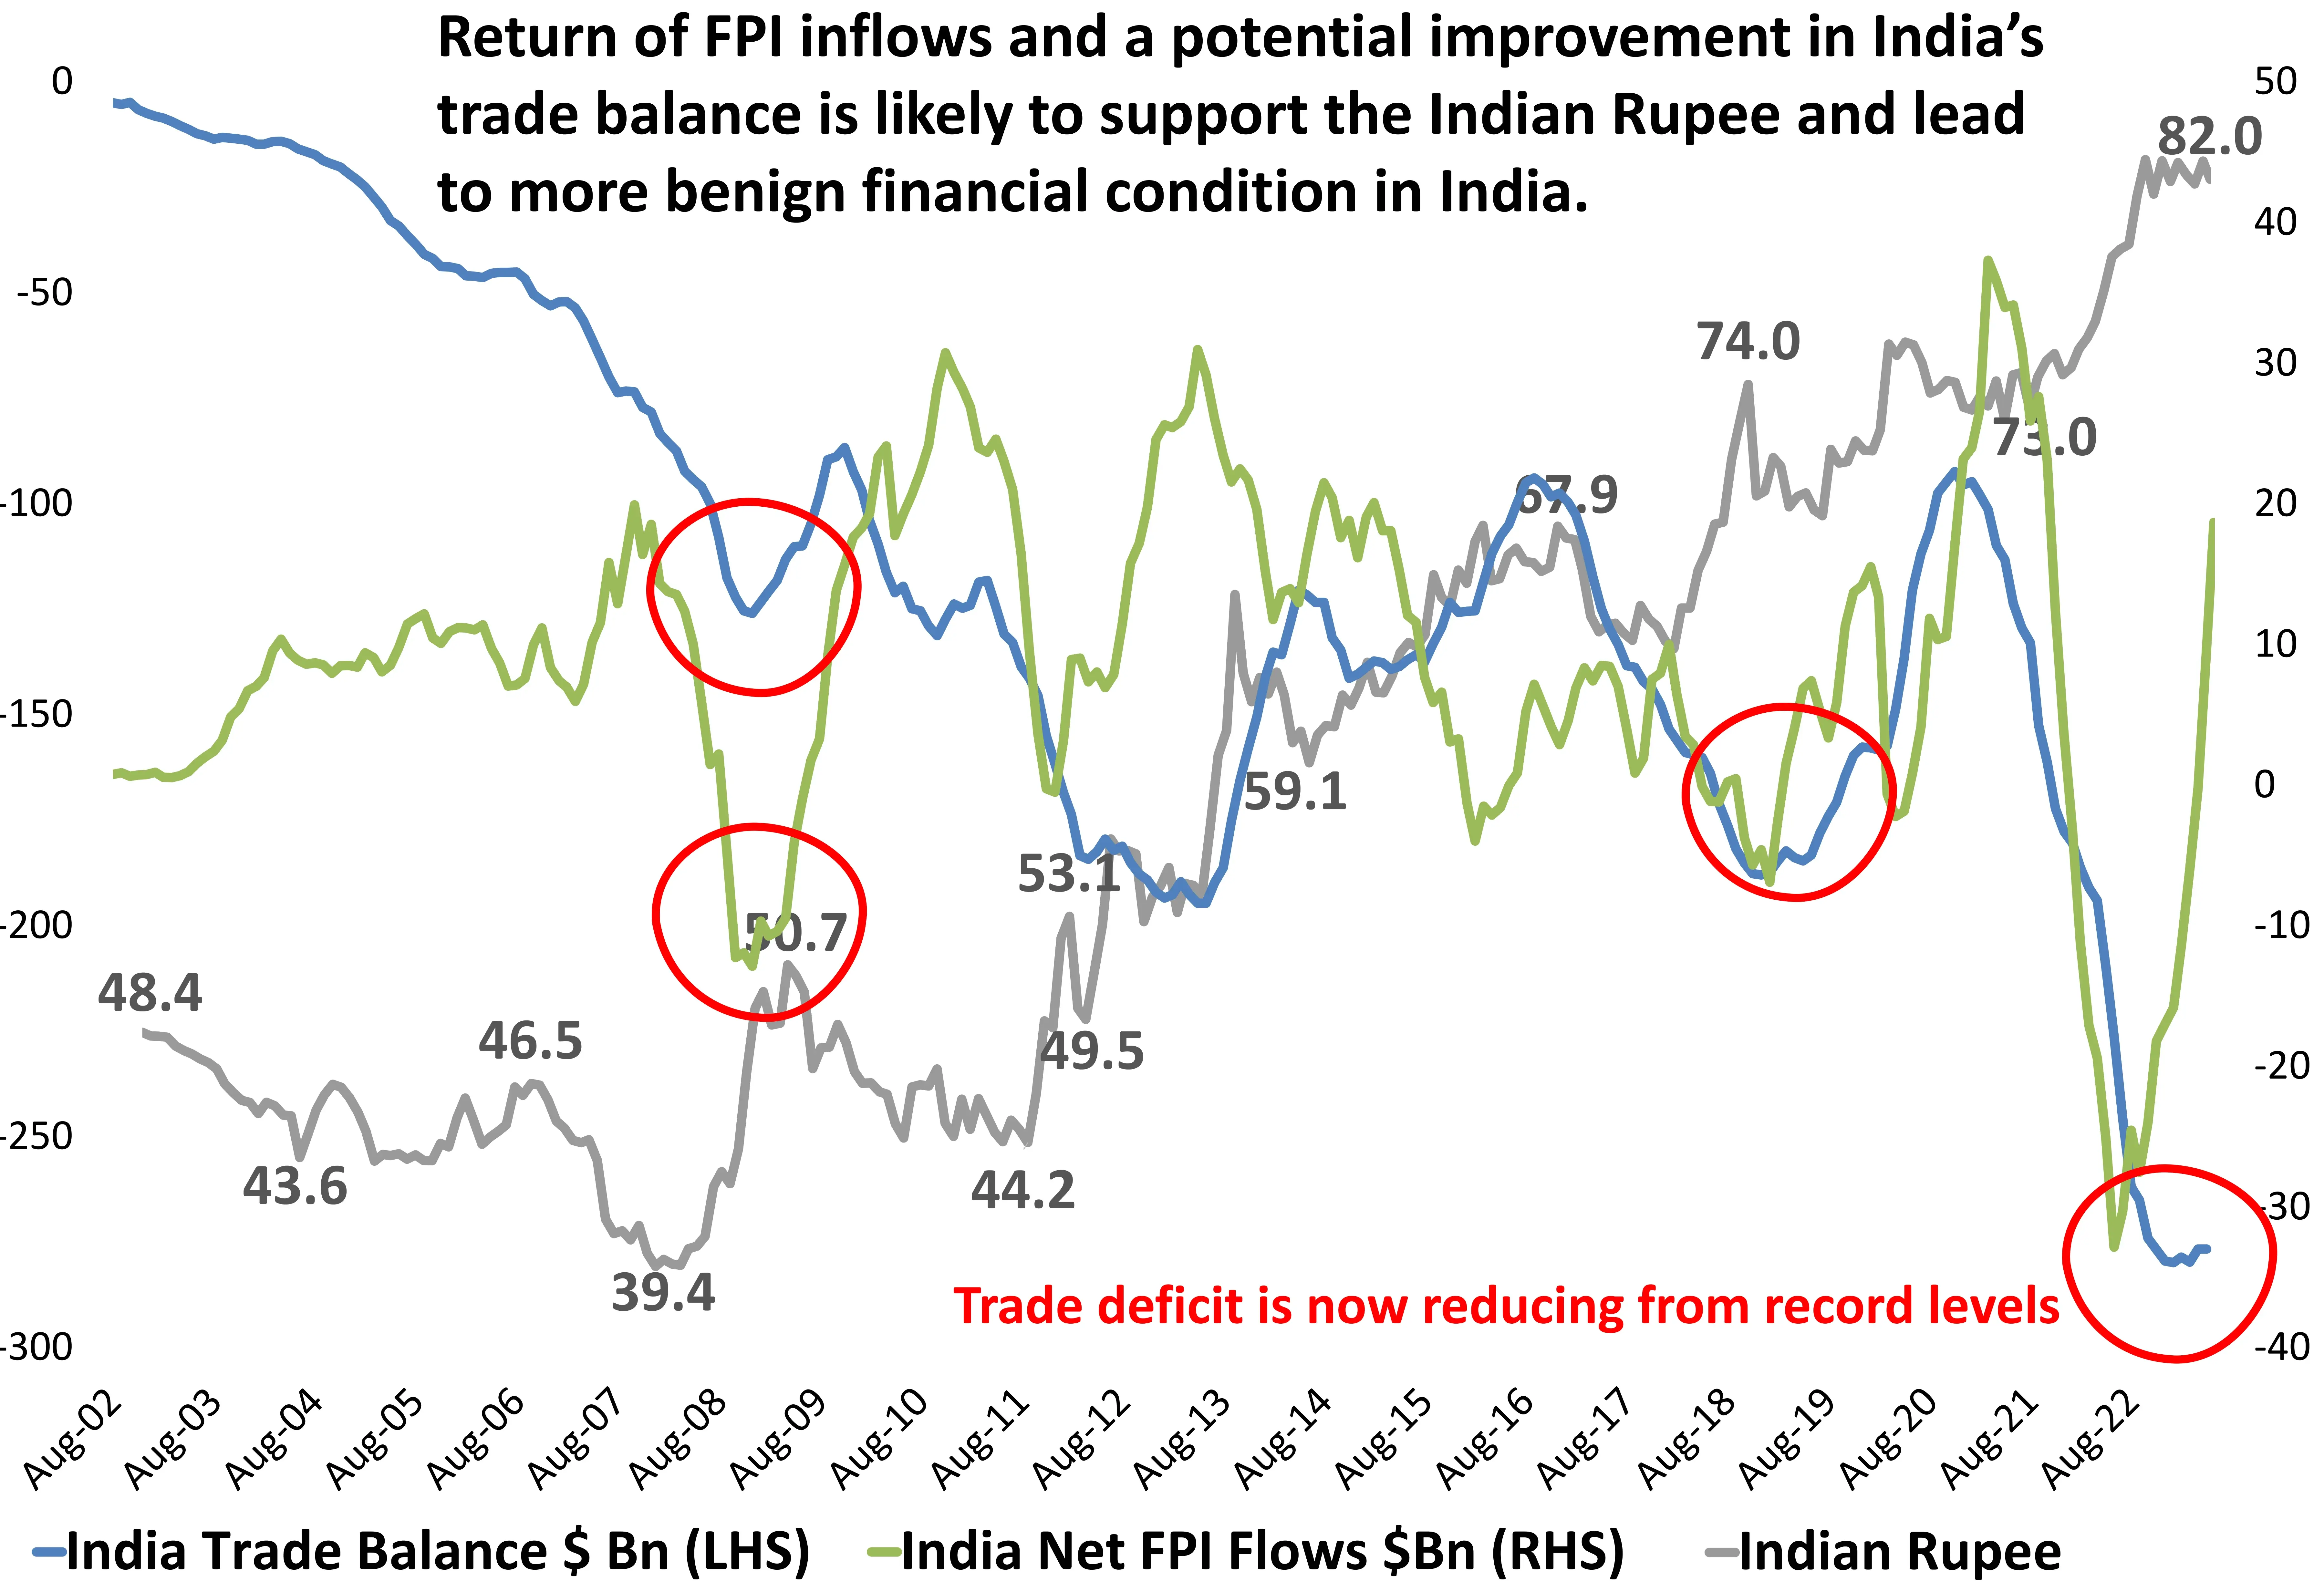
A coincidental turn in FPI flows and an improvement in the trade deficit can have a positive impact on the Indian rupee, potentially leading to appreciation over time.
However, it is important to note that currency movements are influenced by a variety of factors, including monetary policy, market sentiment, interest rates, geopolitical events, and global economic conditions. Hence, if India can manage continuity of its policies there is a chance to see a better external position than seen over the last two decades.
This should be seen in conjunction to the post cyclical rise in crude oil prices and the ongoing easing. Risk to this hypothesis is evenly balanced with Oil price spikes being the biggest trigger.
In conclusion, India’s trade deficit is reducing from record levels and FPI inflows are gaining momentum. This augurs well for India’s external position and the Rupee for the next few quarters.
Source: CMIE, Bloomberg, DSP Data as on June 2023
RBI’s FX Firefighting Has Paved The Way To Stability
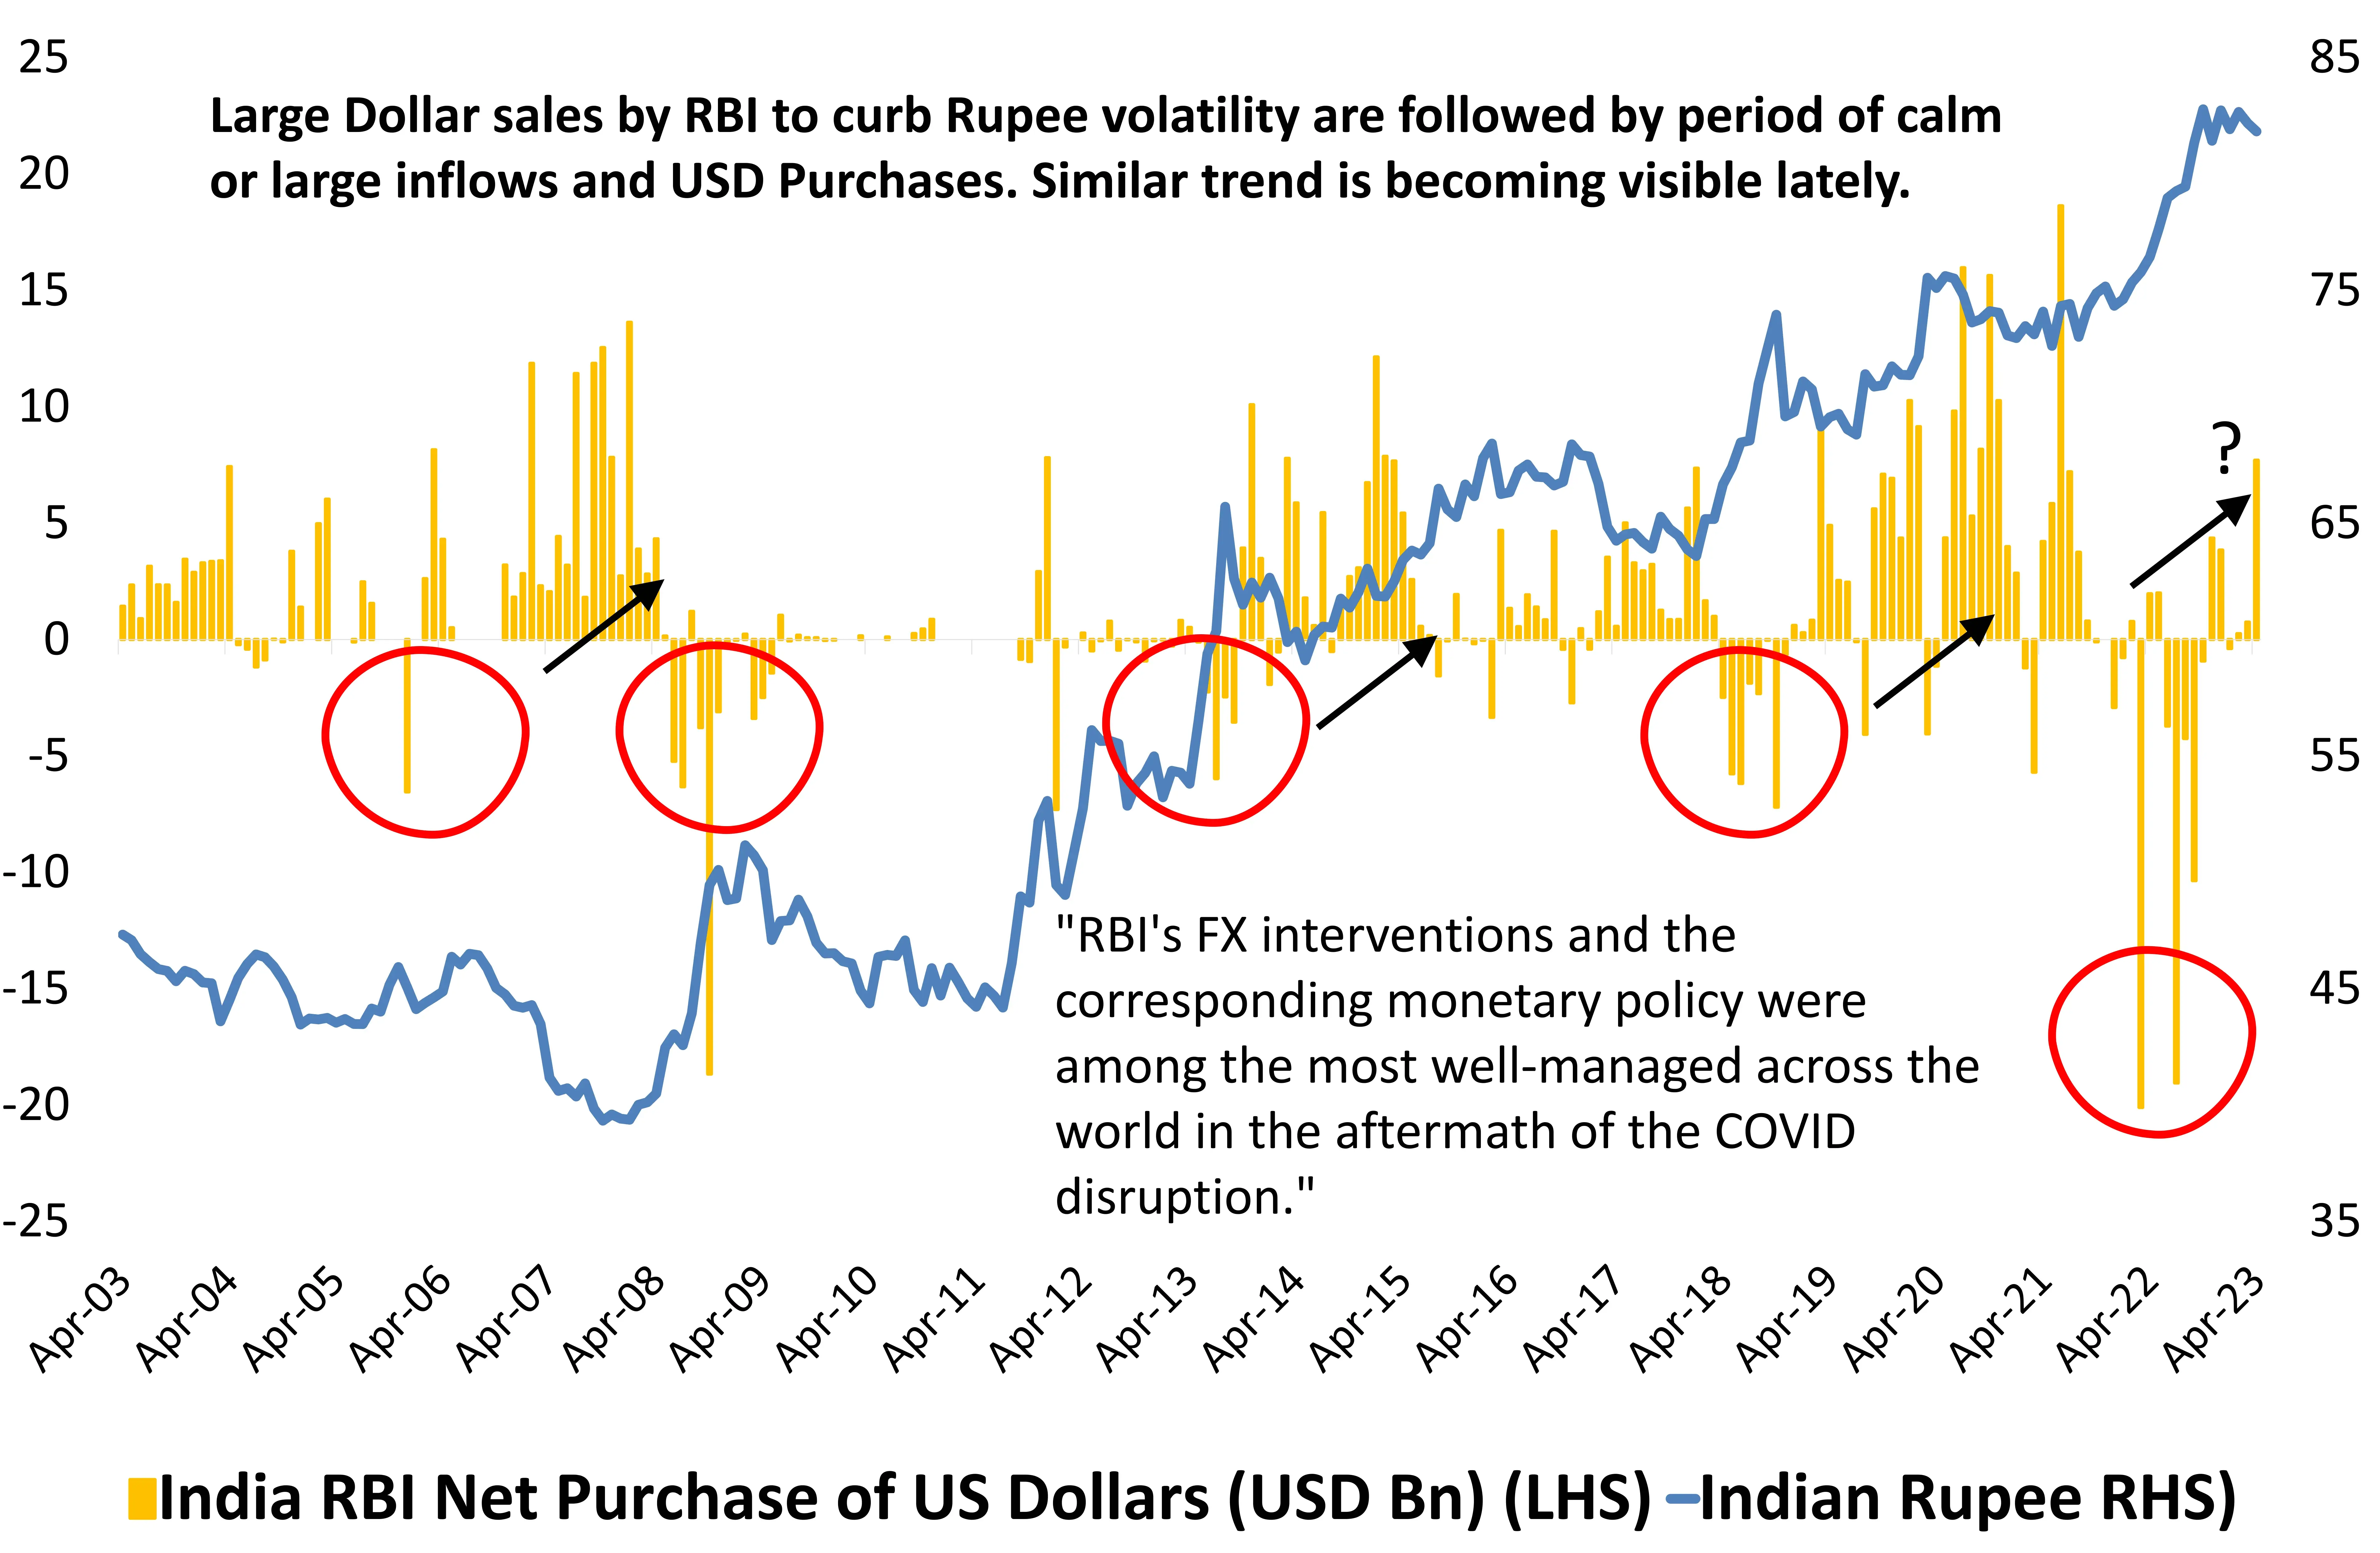
A spike in global commodity prices and an exodus of Foreign investors from equity markets pushed RBI to manage Rupee volatility by highest US Dollar sales on record. Between Nov’21 to Dec’22 RBI sold USD worth $57.4 Bn, the highest on record of any 1 year rolling period ever.
Historically, periods of huge foreign investments outflows have been followed by an influx of investments into India. Given that FPI equity flows have turned positive, it is likely to allow RBI to rebuild its FX reserve kitty.
See together with an improvement in India’s external position, the balance of payment for FY24 is likely to be favorable. This removes a key risk, currency volatility, from markets for the next few quarters.
One needs to be vigilant to changing data and new developments in spite of this benign backdrop.
Source: RBI, DSP Data as on June 2023
El Niño Alert, But Impact Could Be Muted. Learn Why?
El Niño is a weather phenomenon that occurs in the equatorial Pacific Ocean, characterized by the abnormal warming of ocean surface temperatures. El Niño events typically occur irregularly every few years and can last for several months to a couple of years.
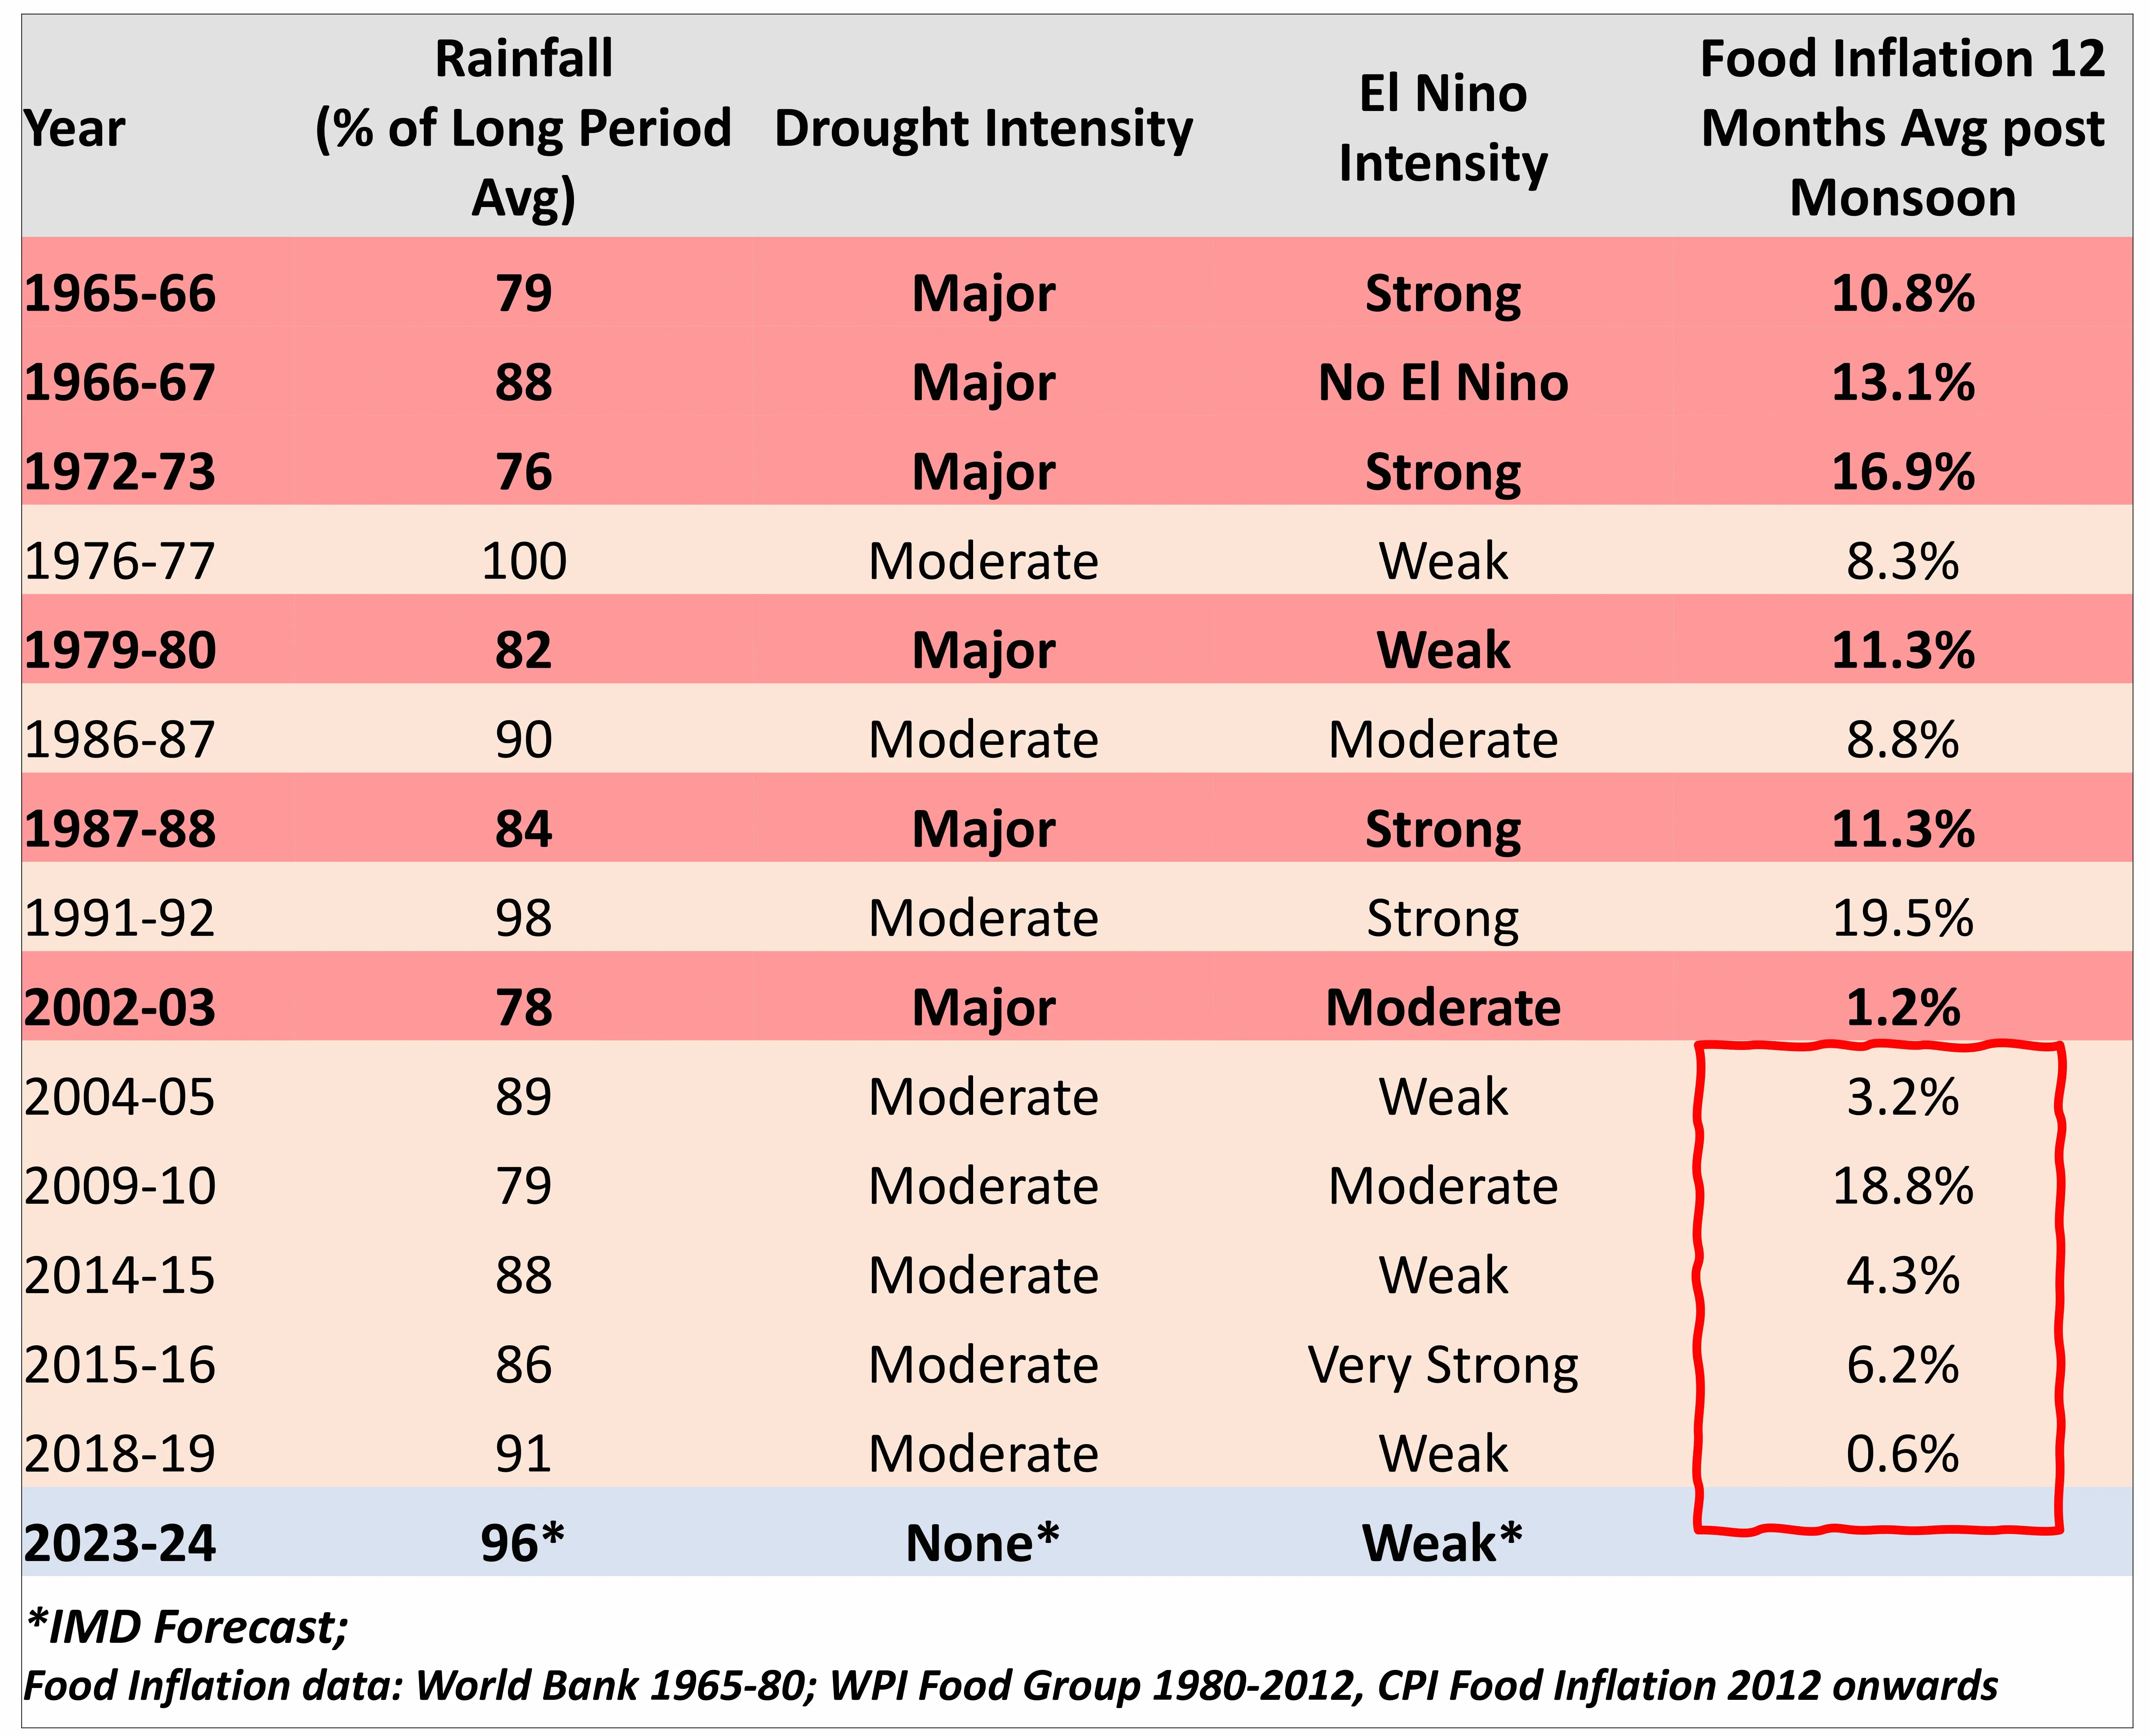
Over the past 60 years, various El Nino episodes have led to droughts of varying degrees in India. In 1960s only 15% of the cultivated area was under irrigation. In 1990s the area irrigated reached 45% and in the last decade, more than 50% of the cultivated area is irrigated. Historically, major drought years have led to double digits inflation spikes in India. This is something we should be alert to. However, most episodes of major inflation spikes had a confluence of other factors like global food price spirals, macro economic issues in India and a weaker currency.
Large storage buffers, less dependence on rain, drip irrigation coverage and supply chain management has mitigated the impact of poor rains. In case of a weak EL Nino impact, the risks to India’s inflation trajectory and growth will be minimal. However, expect slower growth if EL Nino intensifies.
El Nino tend to have a bigger impact on Agri GDP than inflation. It’s impact on inflation has been blunted overtime. But India has not witnessed a strong EL Nino impact since 1991. The impact of such an event will be known only in hindsight. For now, it seems that a weak El Nino may not be a major disruption.
Source: Central Water Commission, IMD, DSP Data as on June 2023
India Inflation Trajectory Is Benign
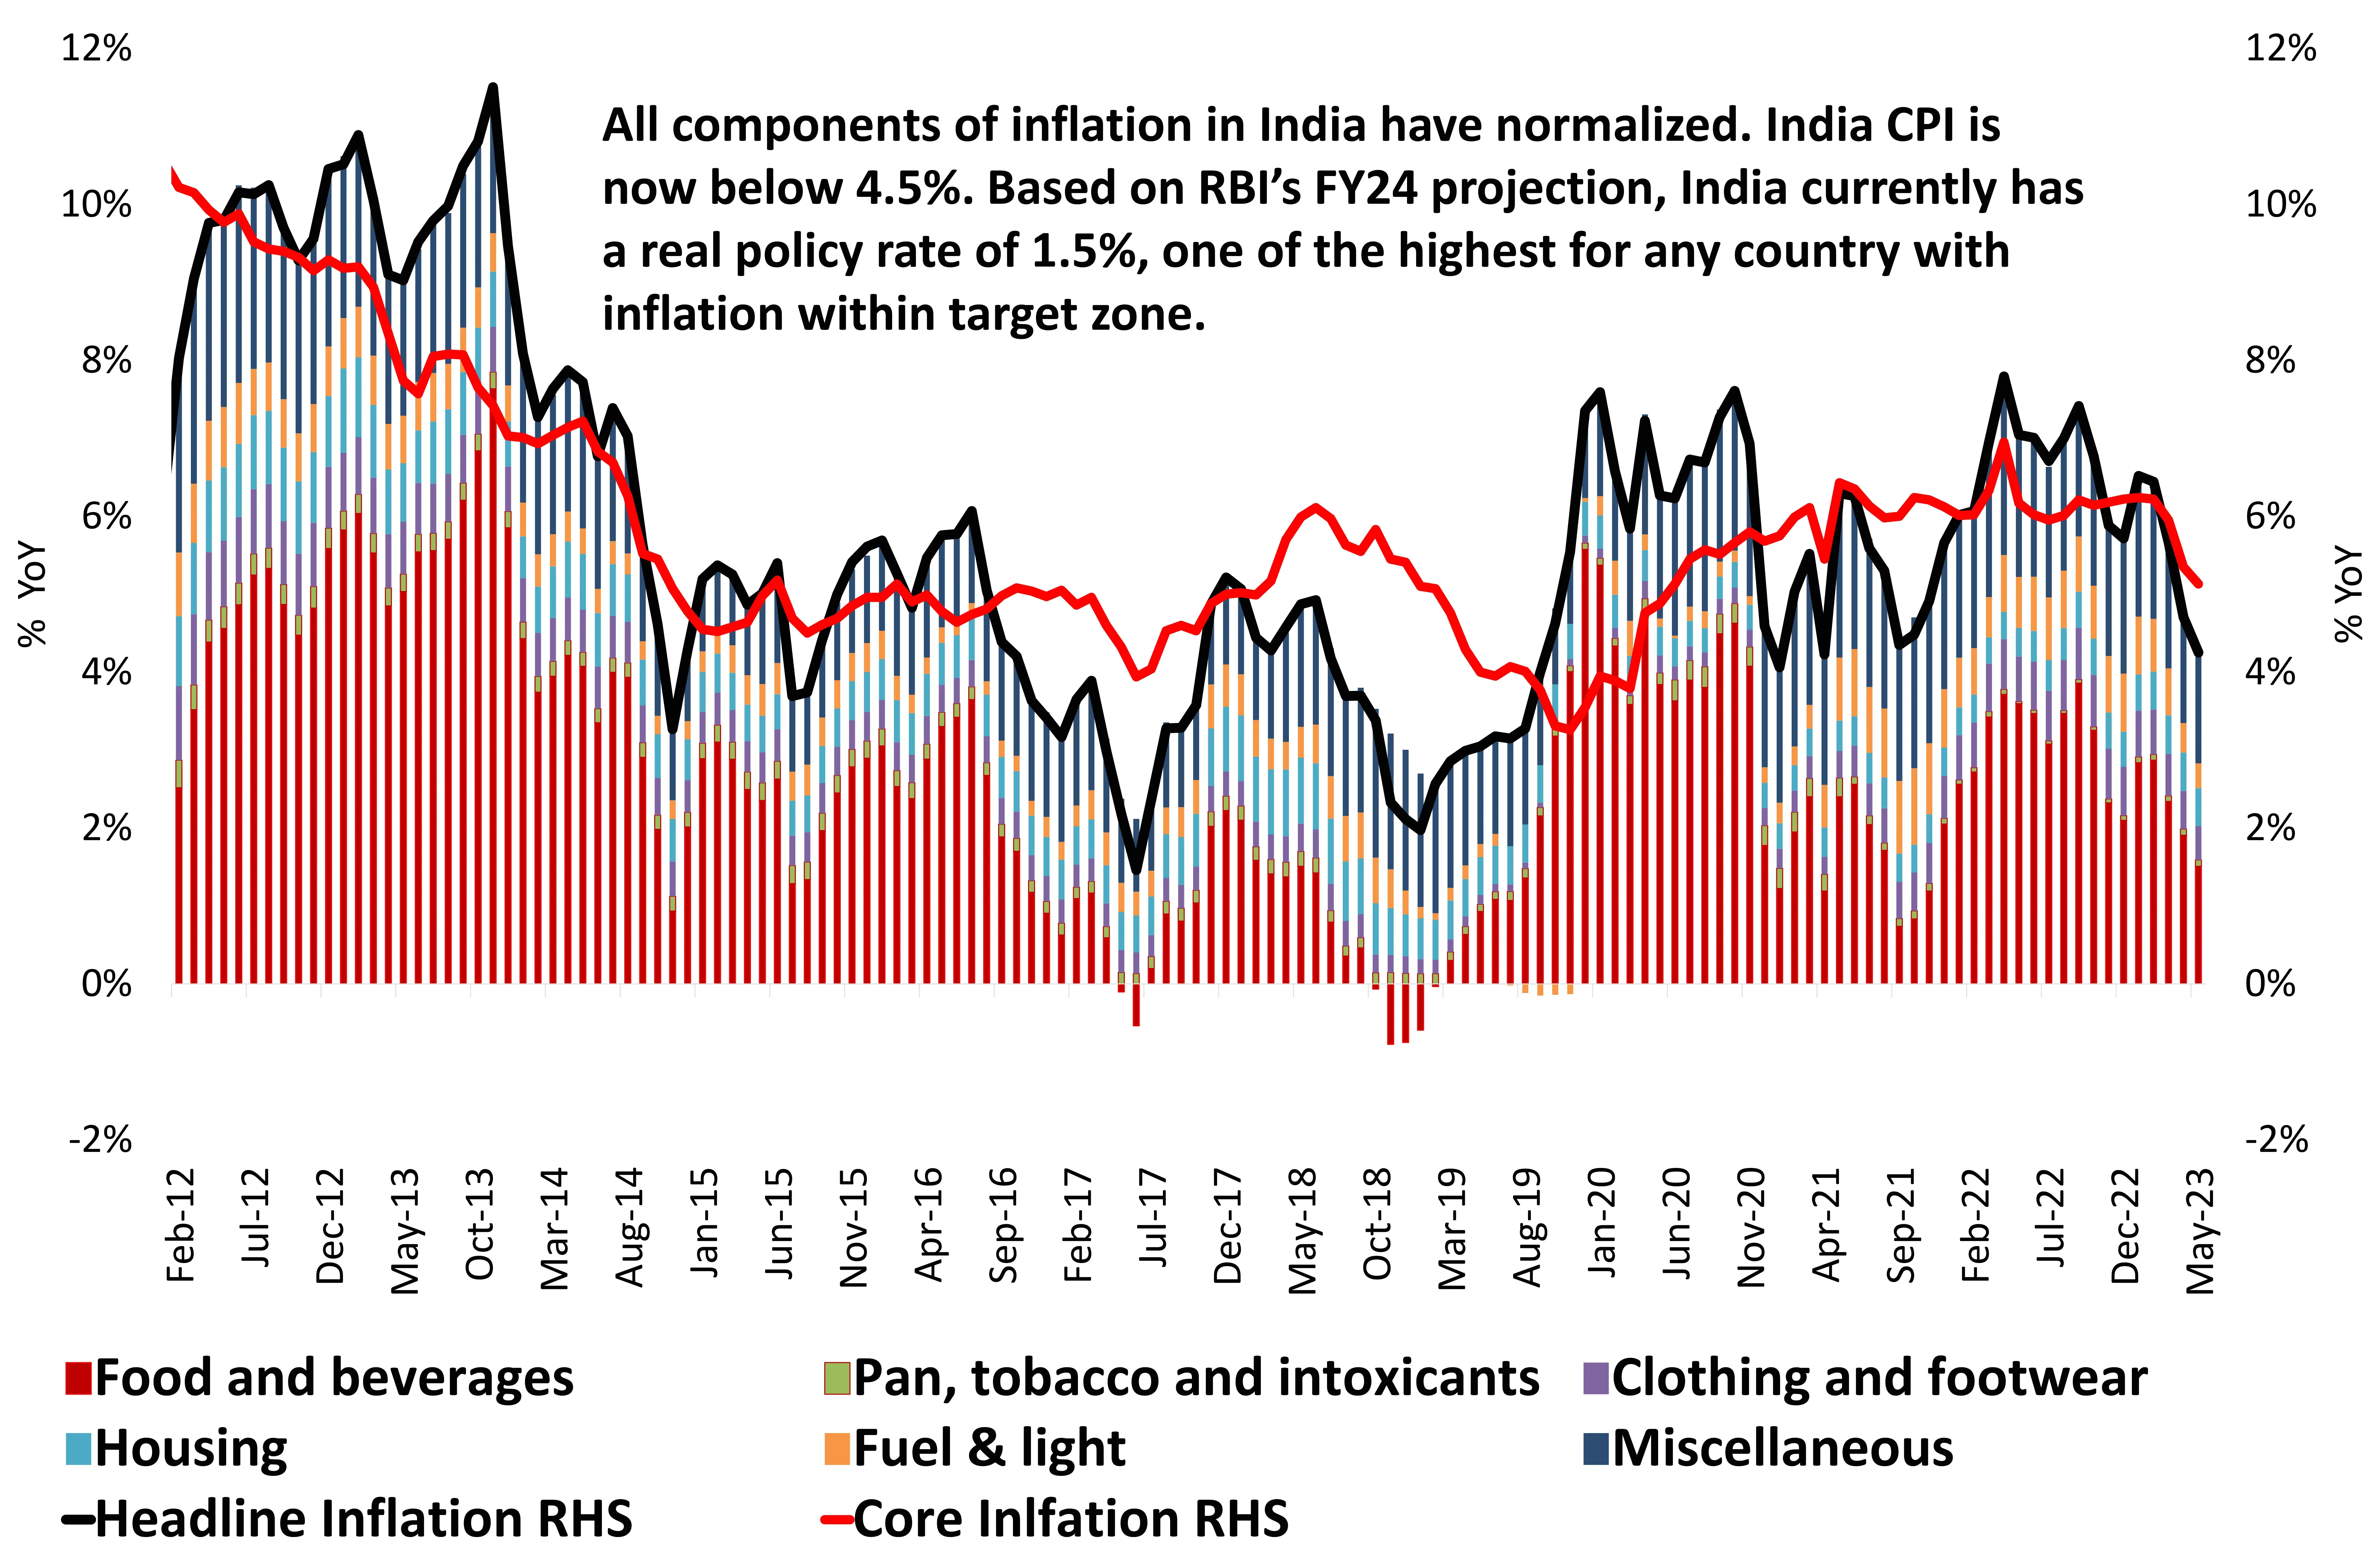
The headline inflation in May’23 was at a 20- month low. Inflation momentum is moderating in a broad-based manner. Core CPI fell in May23 despite falling base (May-22 at 6% versus 7% in Apr-22). Lower core CPI is led by slower goods inflation, which reflects declining international commodity prices like crude oil, metals and even food.
Food inflation is a seasonal phenomenon, if considered from a cyclical perspective, it is expected to be manageable. Even though 2HFY24 may see a marginally higher inflation, it is likely to remain in RBI’s comfort zone assuming no new surprises.
There are upside risks to inflation, mainly from an El Nino impact on monsoon, but the CPI inflation is likely to track below RBI’s target of 5.1% for the rest of the financial year.
Source: CMIE, DSP Data as on June 2023
What’s Driving The US Consumer Price Inflation?
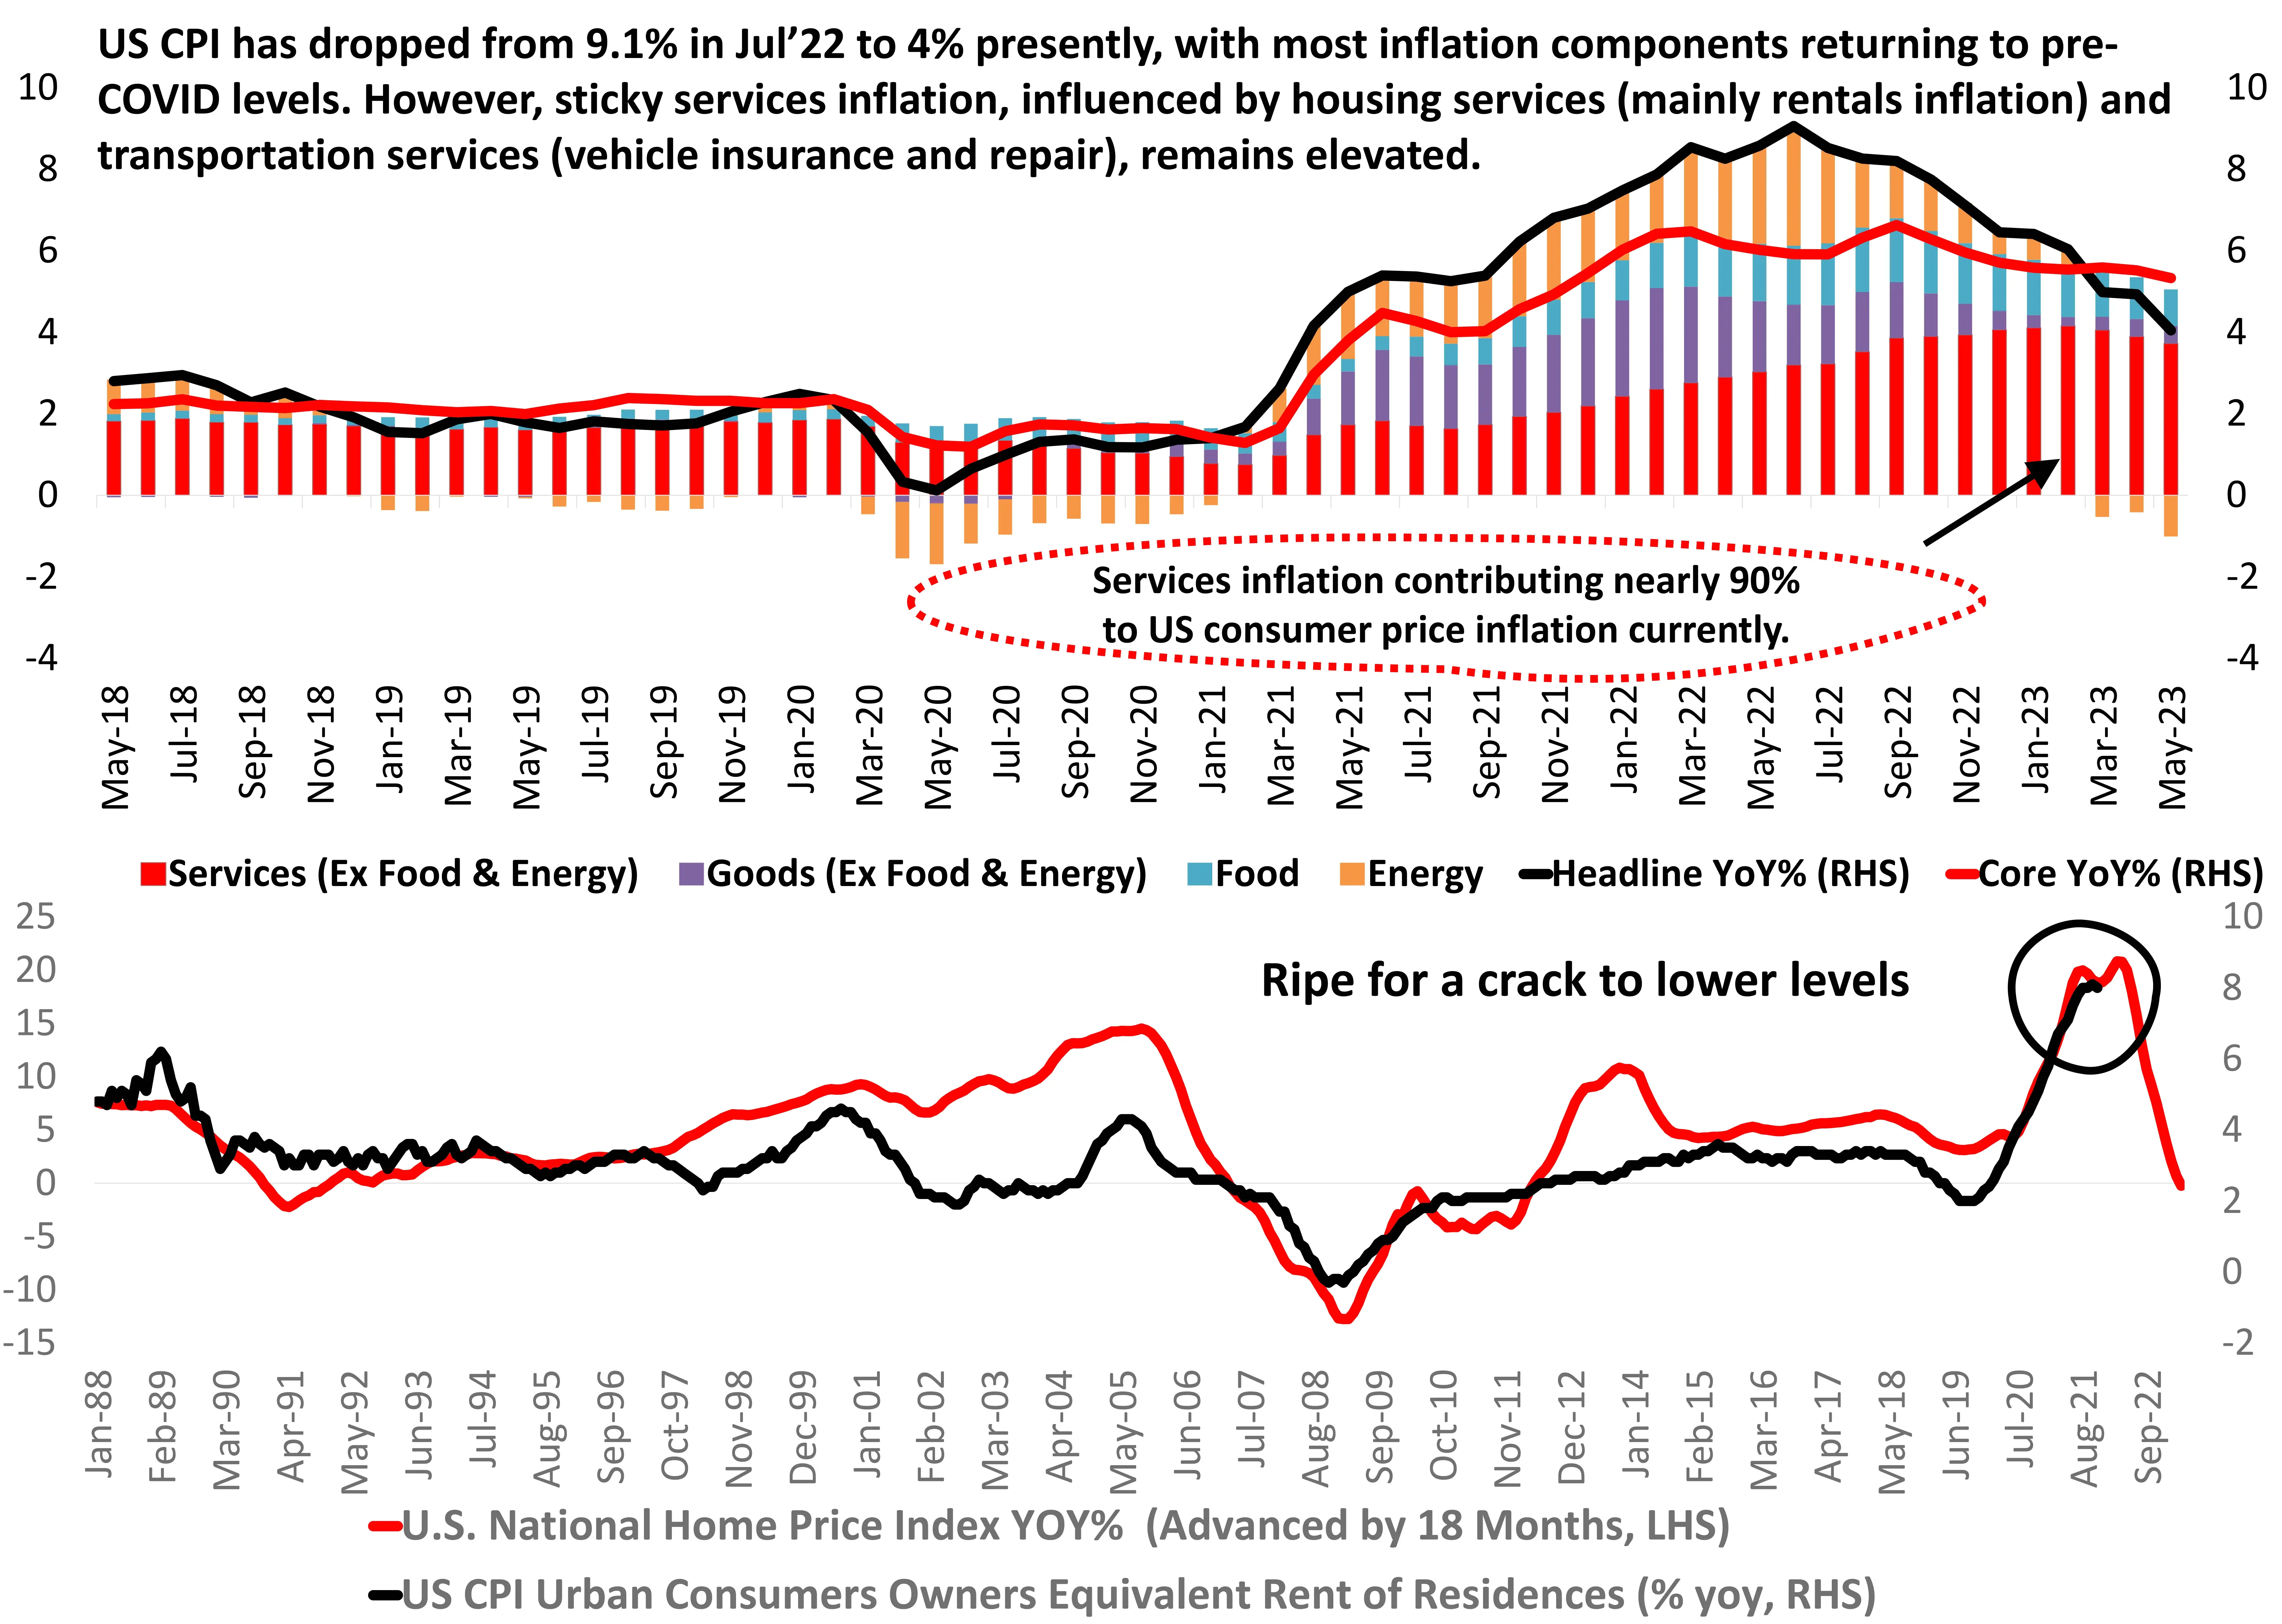
The pandemic-era inflation which has predominantly arisen due to strong aggregate demand, is the product of easy fiscal and monetary policies, excess savings accumulated during the pandemic, and the reopening of locked-down markets. The strength of aggregate demand led to a (belatedly recognized) tightening of the labor market, as reflected in record high ratios of job openings to unemployed workers.
At this point, conundrum around inflation dynamics linger on whether the services component of inflation will continue to remain sticky or abate over the next few quarters.
The data shows that rentals, which explain nearly 33% of US CPI inflation, and have peaked, will eventually contribute to moderation in service inflation and, therefore, a steady decline in both headline and core inflation in the US. This will allow the Fed to take a more balanced approach to its monetary policy.
There are clues available from the services sector. See the next slide for details.
Source: BLS, St. Louis Fed FRED, DSP Data as on June 2023
Service Sector Growth in US Holds Key To Rates, Markets in H2 CY23
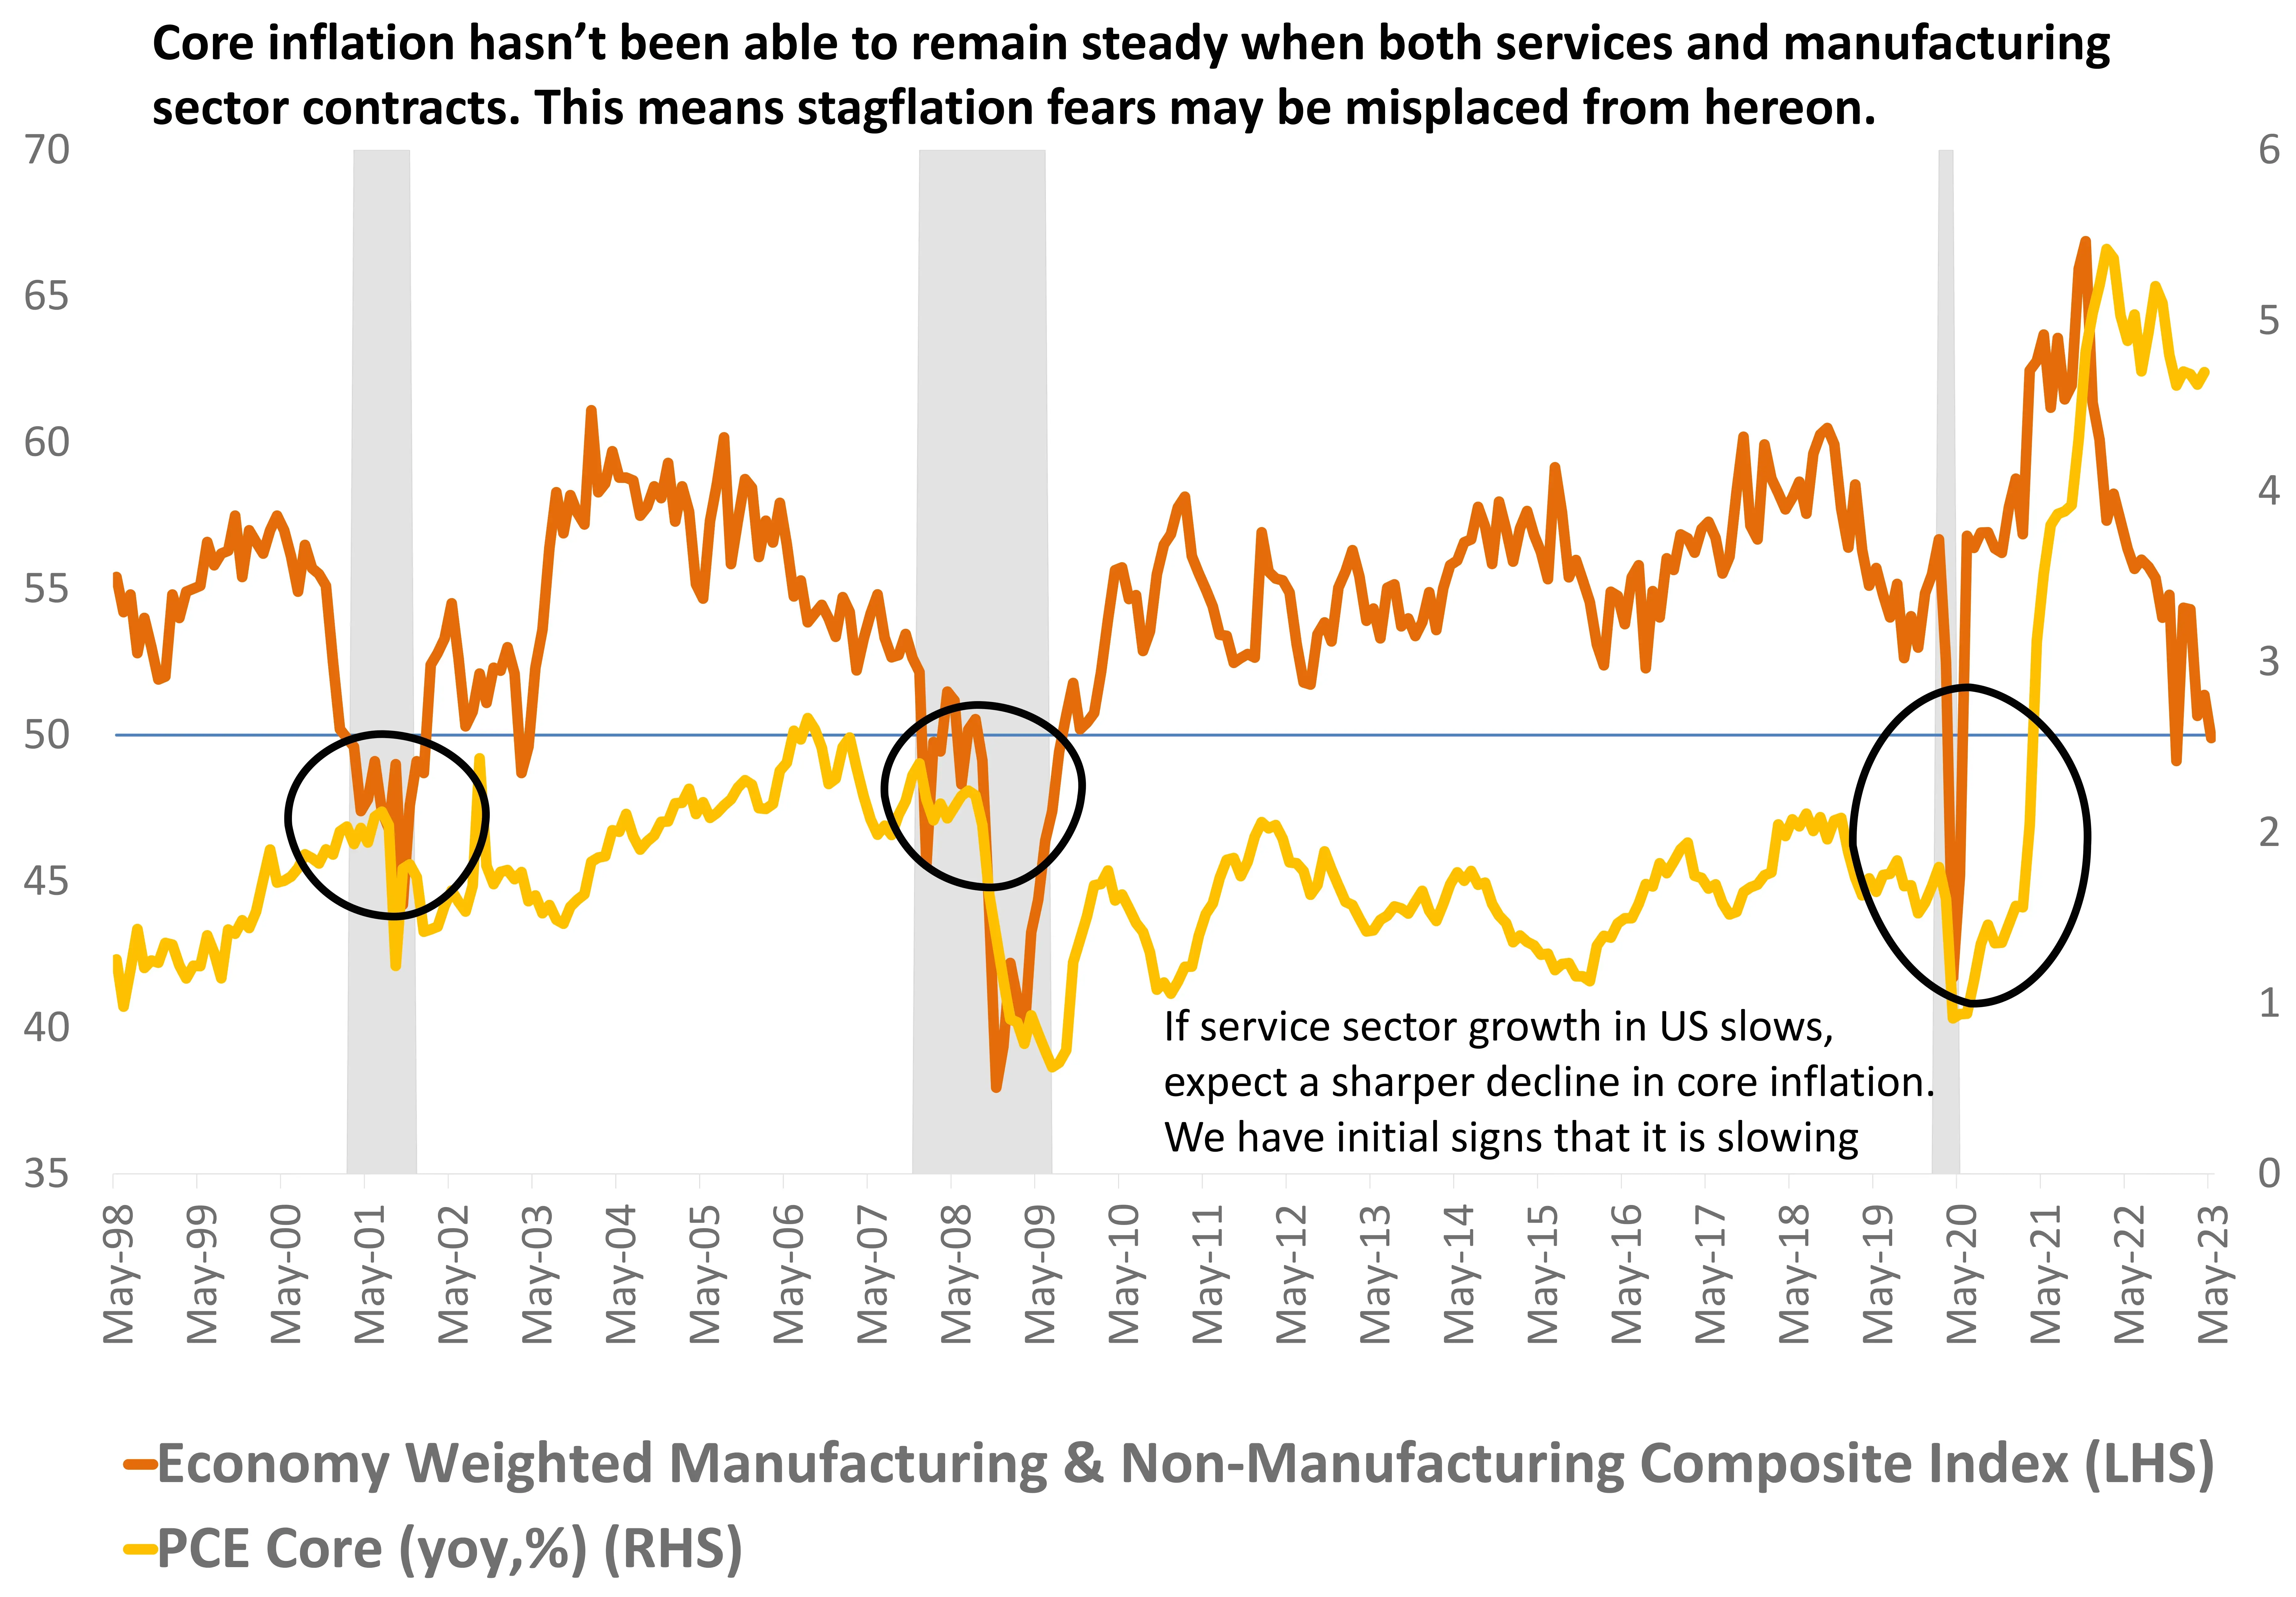
The growth dynamics have been brighter in the service sector in US, where demand has proved to be resilient and the recent pause in rate hikes appeared to have helped boost business optimism .
However, resilient service sector growth can be in the face of the manufacturing decline and the lagged effect of prior rate hikes is one of the key variables ahead. Any further rate hikes can have a further dampening effect on this sector which is especially susceptible to changes in borrowing costs.
Historically, whenever the services & manufacturing sector activity, as measured by the economy weighted composite index, slips into contraction, core inflation falls rapidly
Therefore, over the next few months service sector data will have a large bearing on market expectation of inflation, bond yields and likely path for interest rates changes by US Fed. Watch US Services PMI, Non-Farm Payrolls and wages data carefully in H2 CY23.
Source: St. Louis Fed FRED, DSP Data as on June 2023
Globally, Smaller Firms Have Underperformed The Larger Ones, Will The Tide Turn?
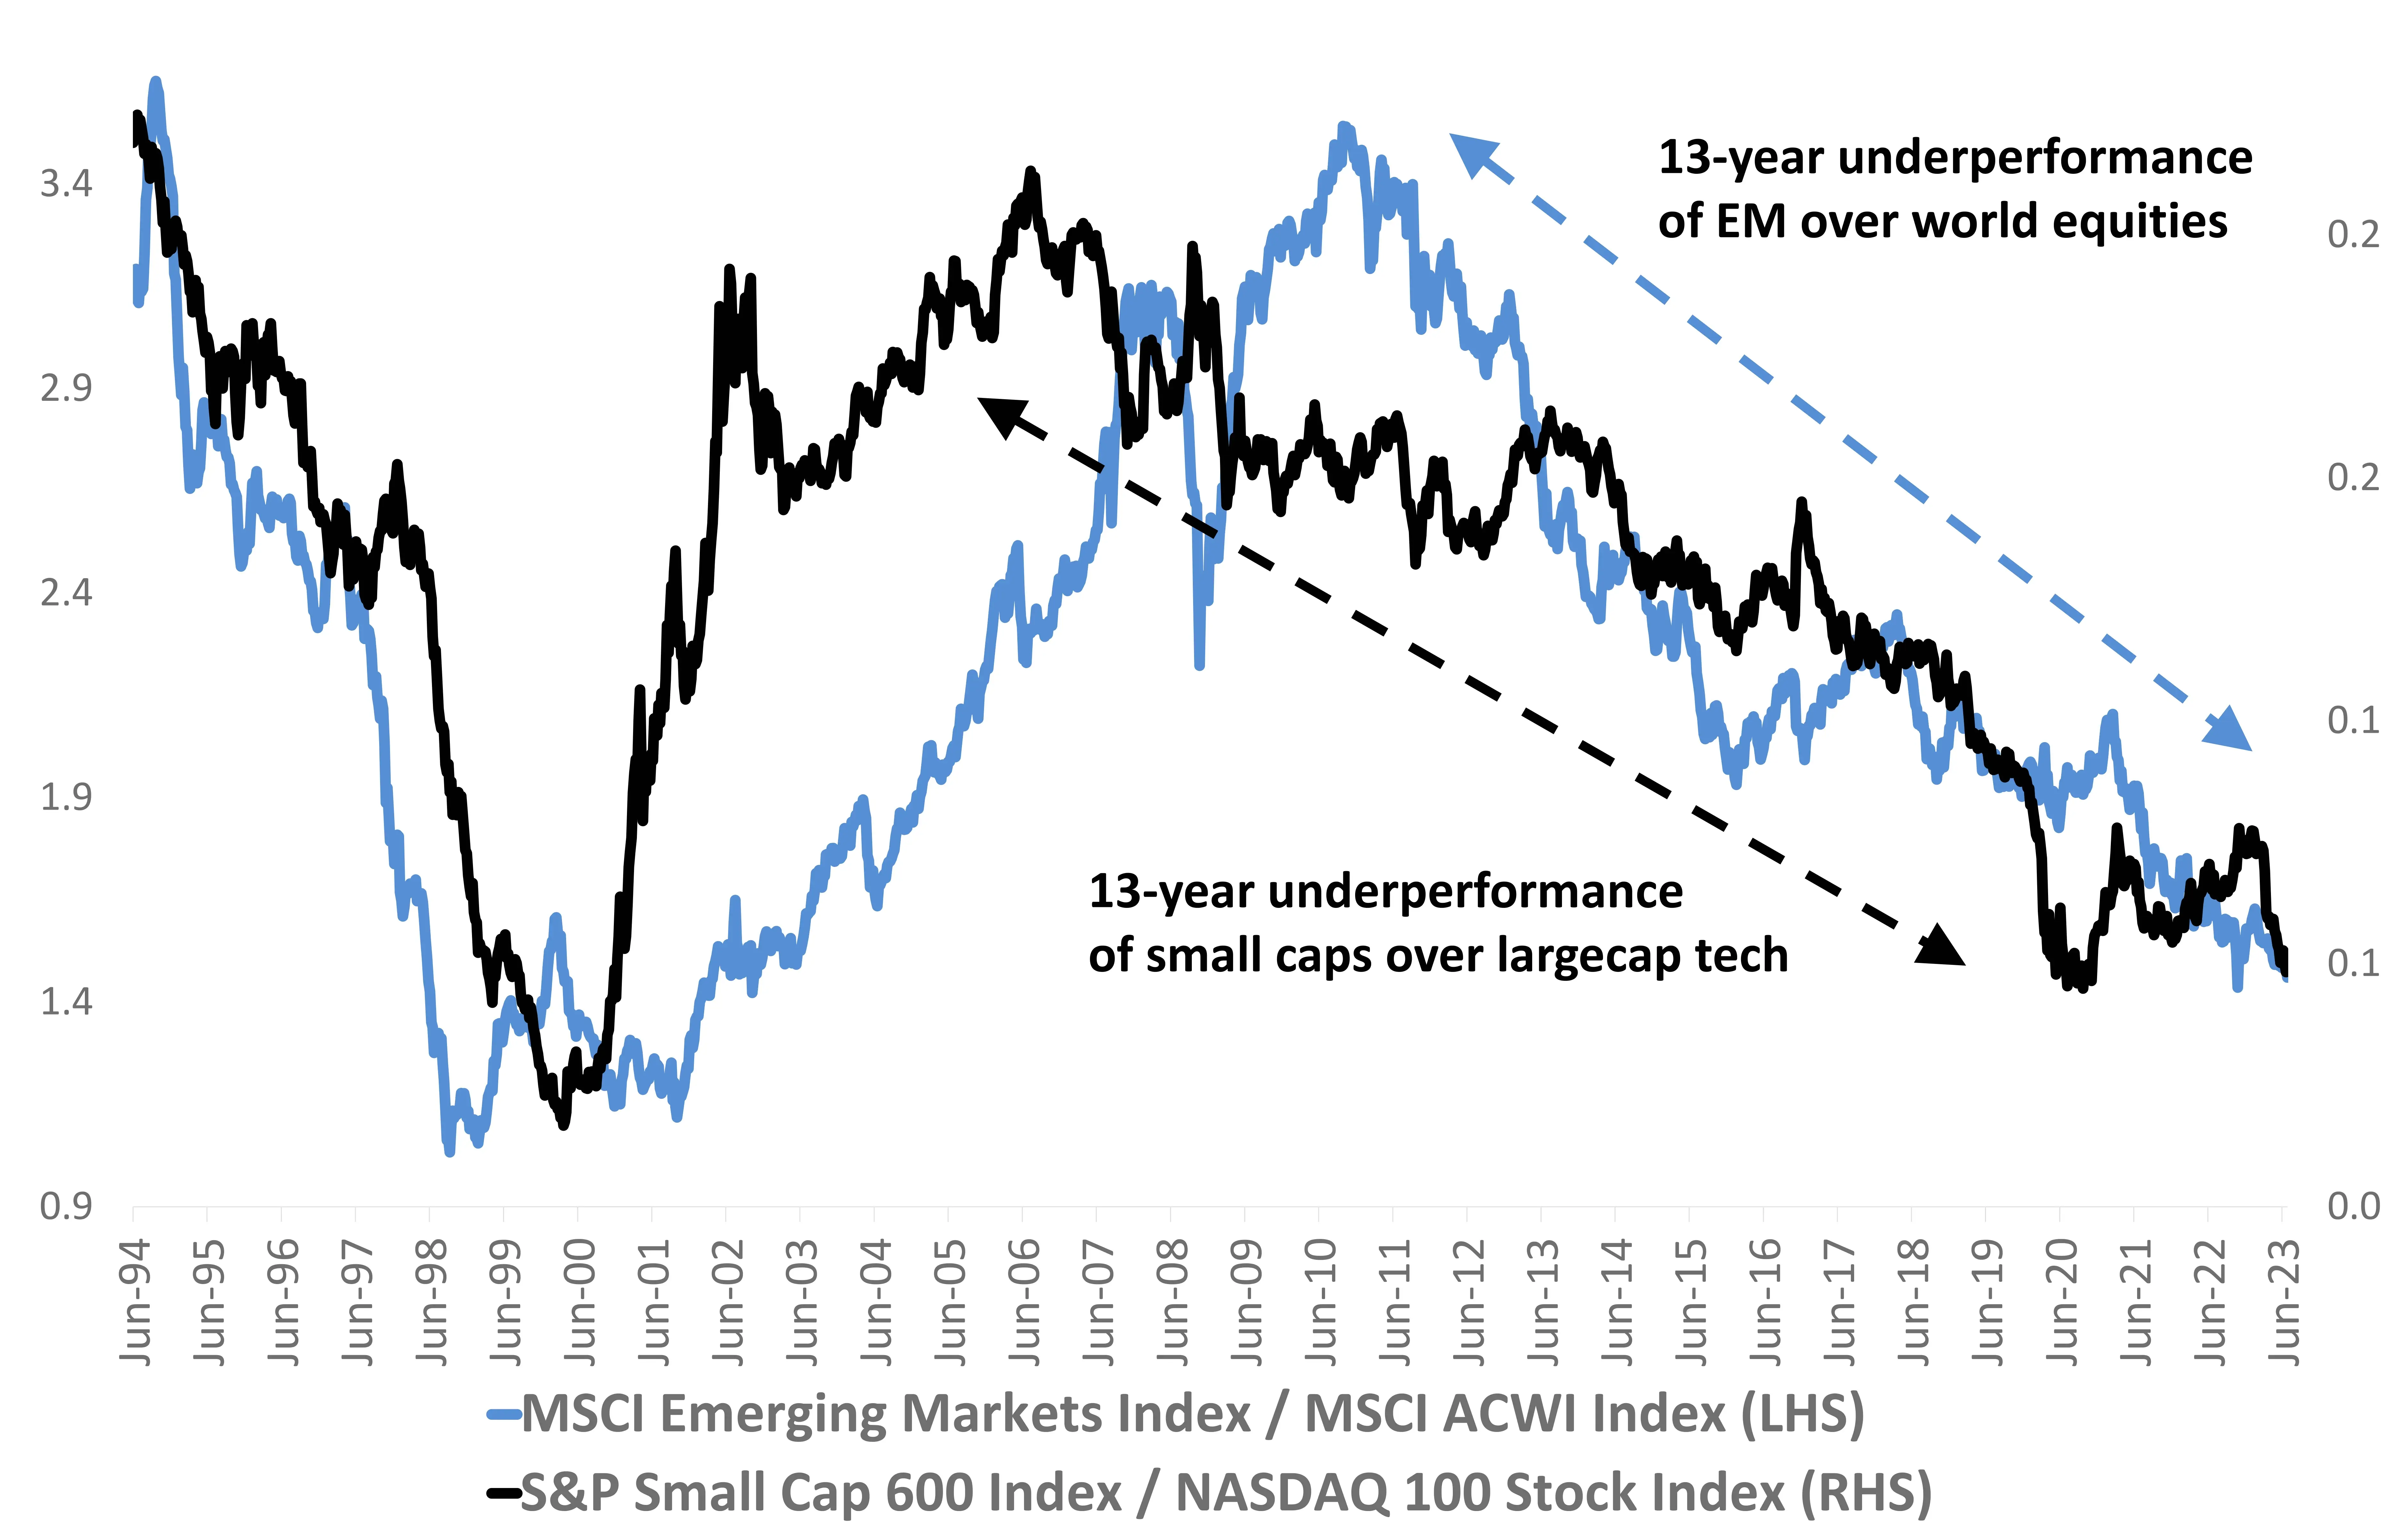
Over the last decade and a half, small becoming smaller and weak becoming weaker have been better reflections than big becoming bigger.
The larger firms have enjoyed better profitability, market shares, and premium valuations versus the smaller firms, largely due to their ability to withstand multiple shocks and utilize their large balance sheets to spend on technology.
But the underperformance of smaller firms is likely to be extreme. Small-cap and emergingmarket equities are now trading at better valuations than large-caps. Currently, Emerging markets are trading at a PE ratio of 11 times, while US stocks are trading at 19 times, and Tech stocks are trading at 27 times. US Small caps are trading at 14 times earnings, while European small caps are trading at 13 times earnings.
From a cyclical and valuation perspective, smaller firms are placed much better than larger ones both in terms of market capitalization and geographical split.
Source: Bloomberg, DSP Data as on June 2023
Can Indian Stocks Sustain Record Highs?
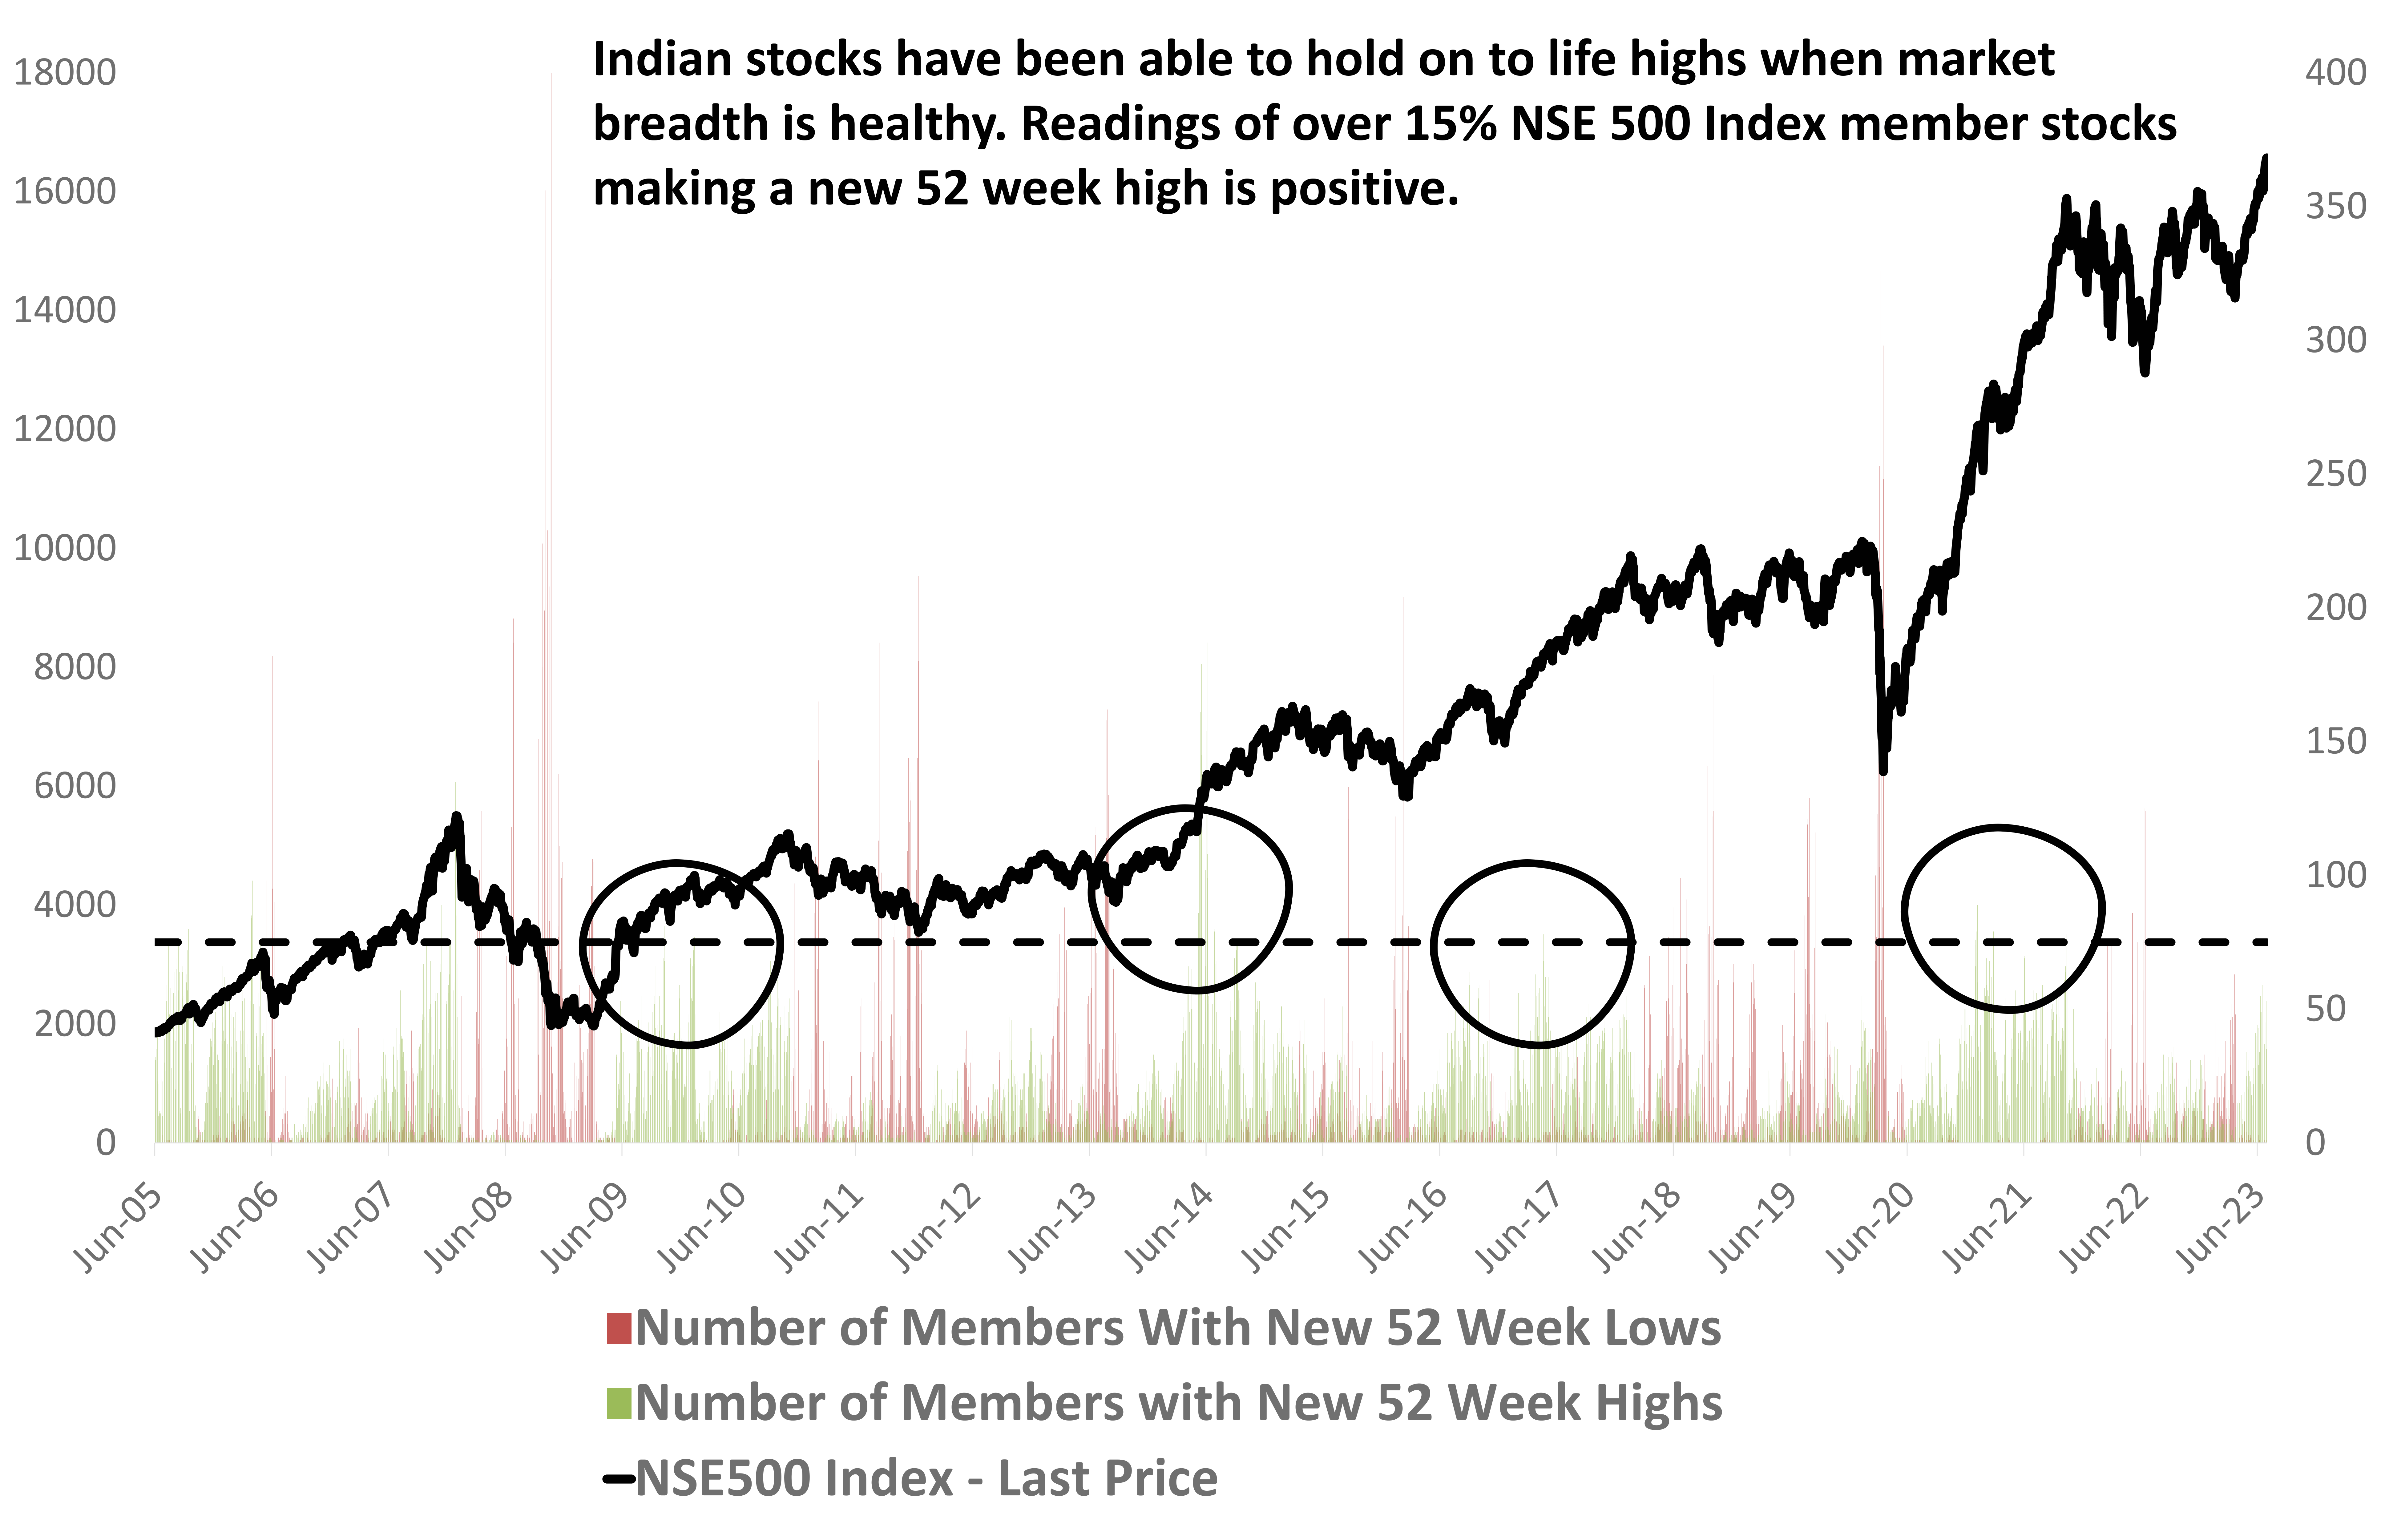
A strong advance-decline market breadth where the number of advancing stocks significantly outweighs the declining stocks, is a positive signal for the market. It is shown here as number of NSE 500 member at new 52 week high or low. It suggests broad participation and indicates a healthy market trend.
Market Guru Bob Farell has said: “Markets are strongest when they are broad and weakest when they narrow to a handful of blue-chip names.”
Historically, NSE 500 has sustained new highs when atleast 15% of its member stocks make a new 52 week high. This reading should occur within two weeks of the index making a new life high. Hence it is important to watch this indicator as market breadth continued to improve over the last one week.
Source: NSE, DSP Data as on June 2023
NBFCs To Join The BFSI Uptrend?
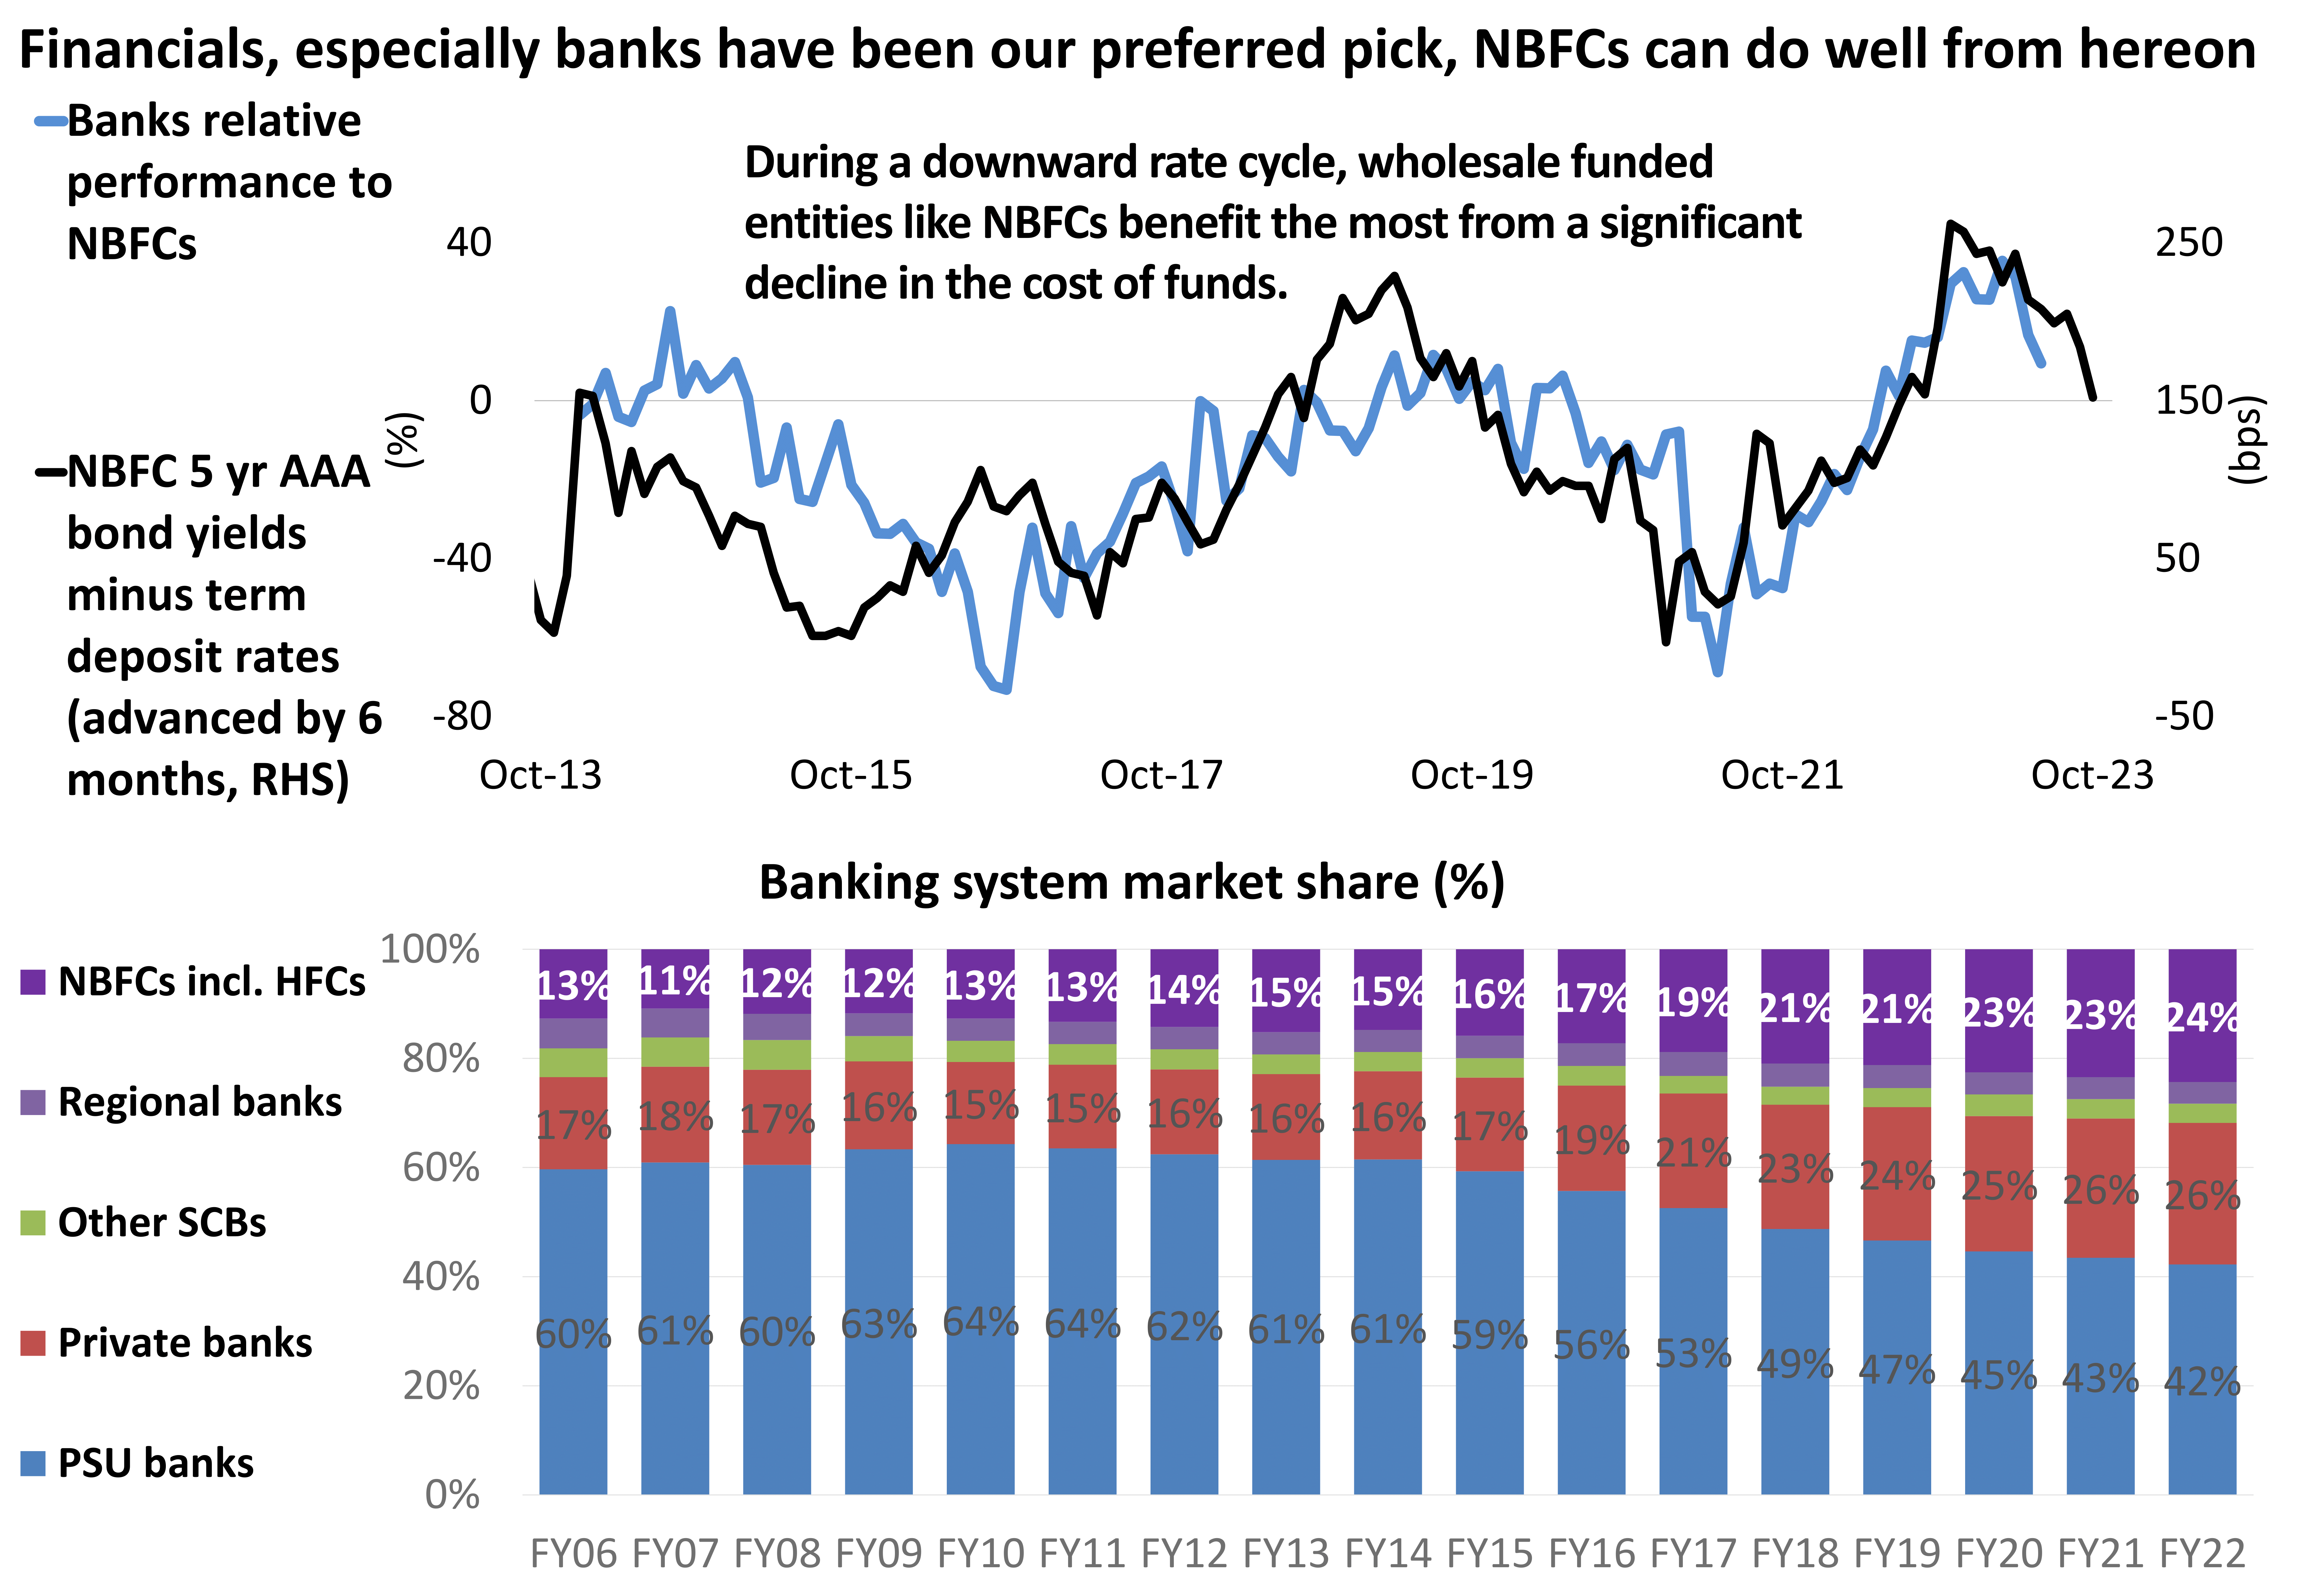
Our bullish stance on banks has been successful, as central banks globally adopt a 'wait and watch' approach before eventually moving to a rate cutting cycle due to cooling inflation.
NBFCs are expected to navigate the softer rate trajectory better than banks, presenting an opportunity within the BFSI sector. The asset quality environment is favorable, with NPAs at a 10-year low and expected to remain below the long-term average. This shift in focus towards growth benefits NBFCs, thanks to their deeper geographical presence compared to private banks, with similar sizes.
During a downward rate cycle, wholesale funded entities like NBFCs benefit the most from a significant decline in the cost of funds. Additionally, their limited exposure to external benchmark linked loans drives better spreads, leading to improved profitability.
Faster growth, market share gains, and improved margins contribute to higher earnings growth, making a case for multiple re-rating, similar to the thesis for banks in 2022-23.
Source: Company Financials, DSP Data as on June 2023
Healthcare Sector Has Margin of Safety
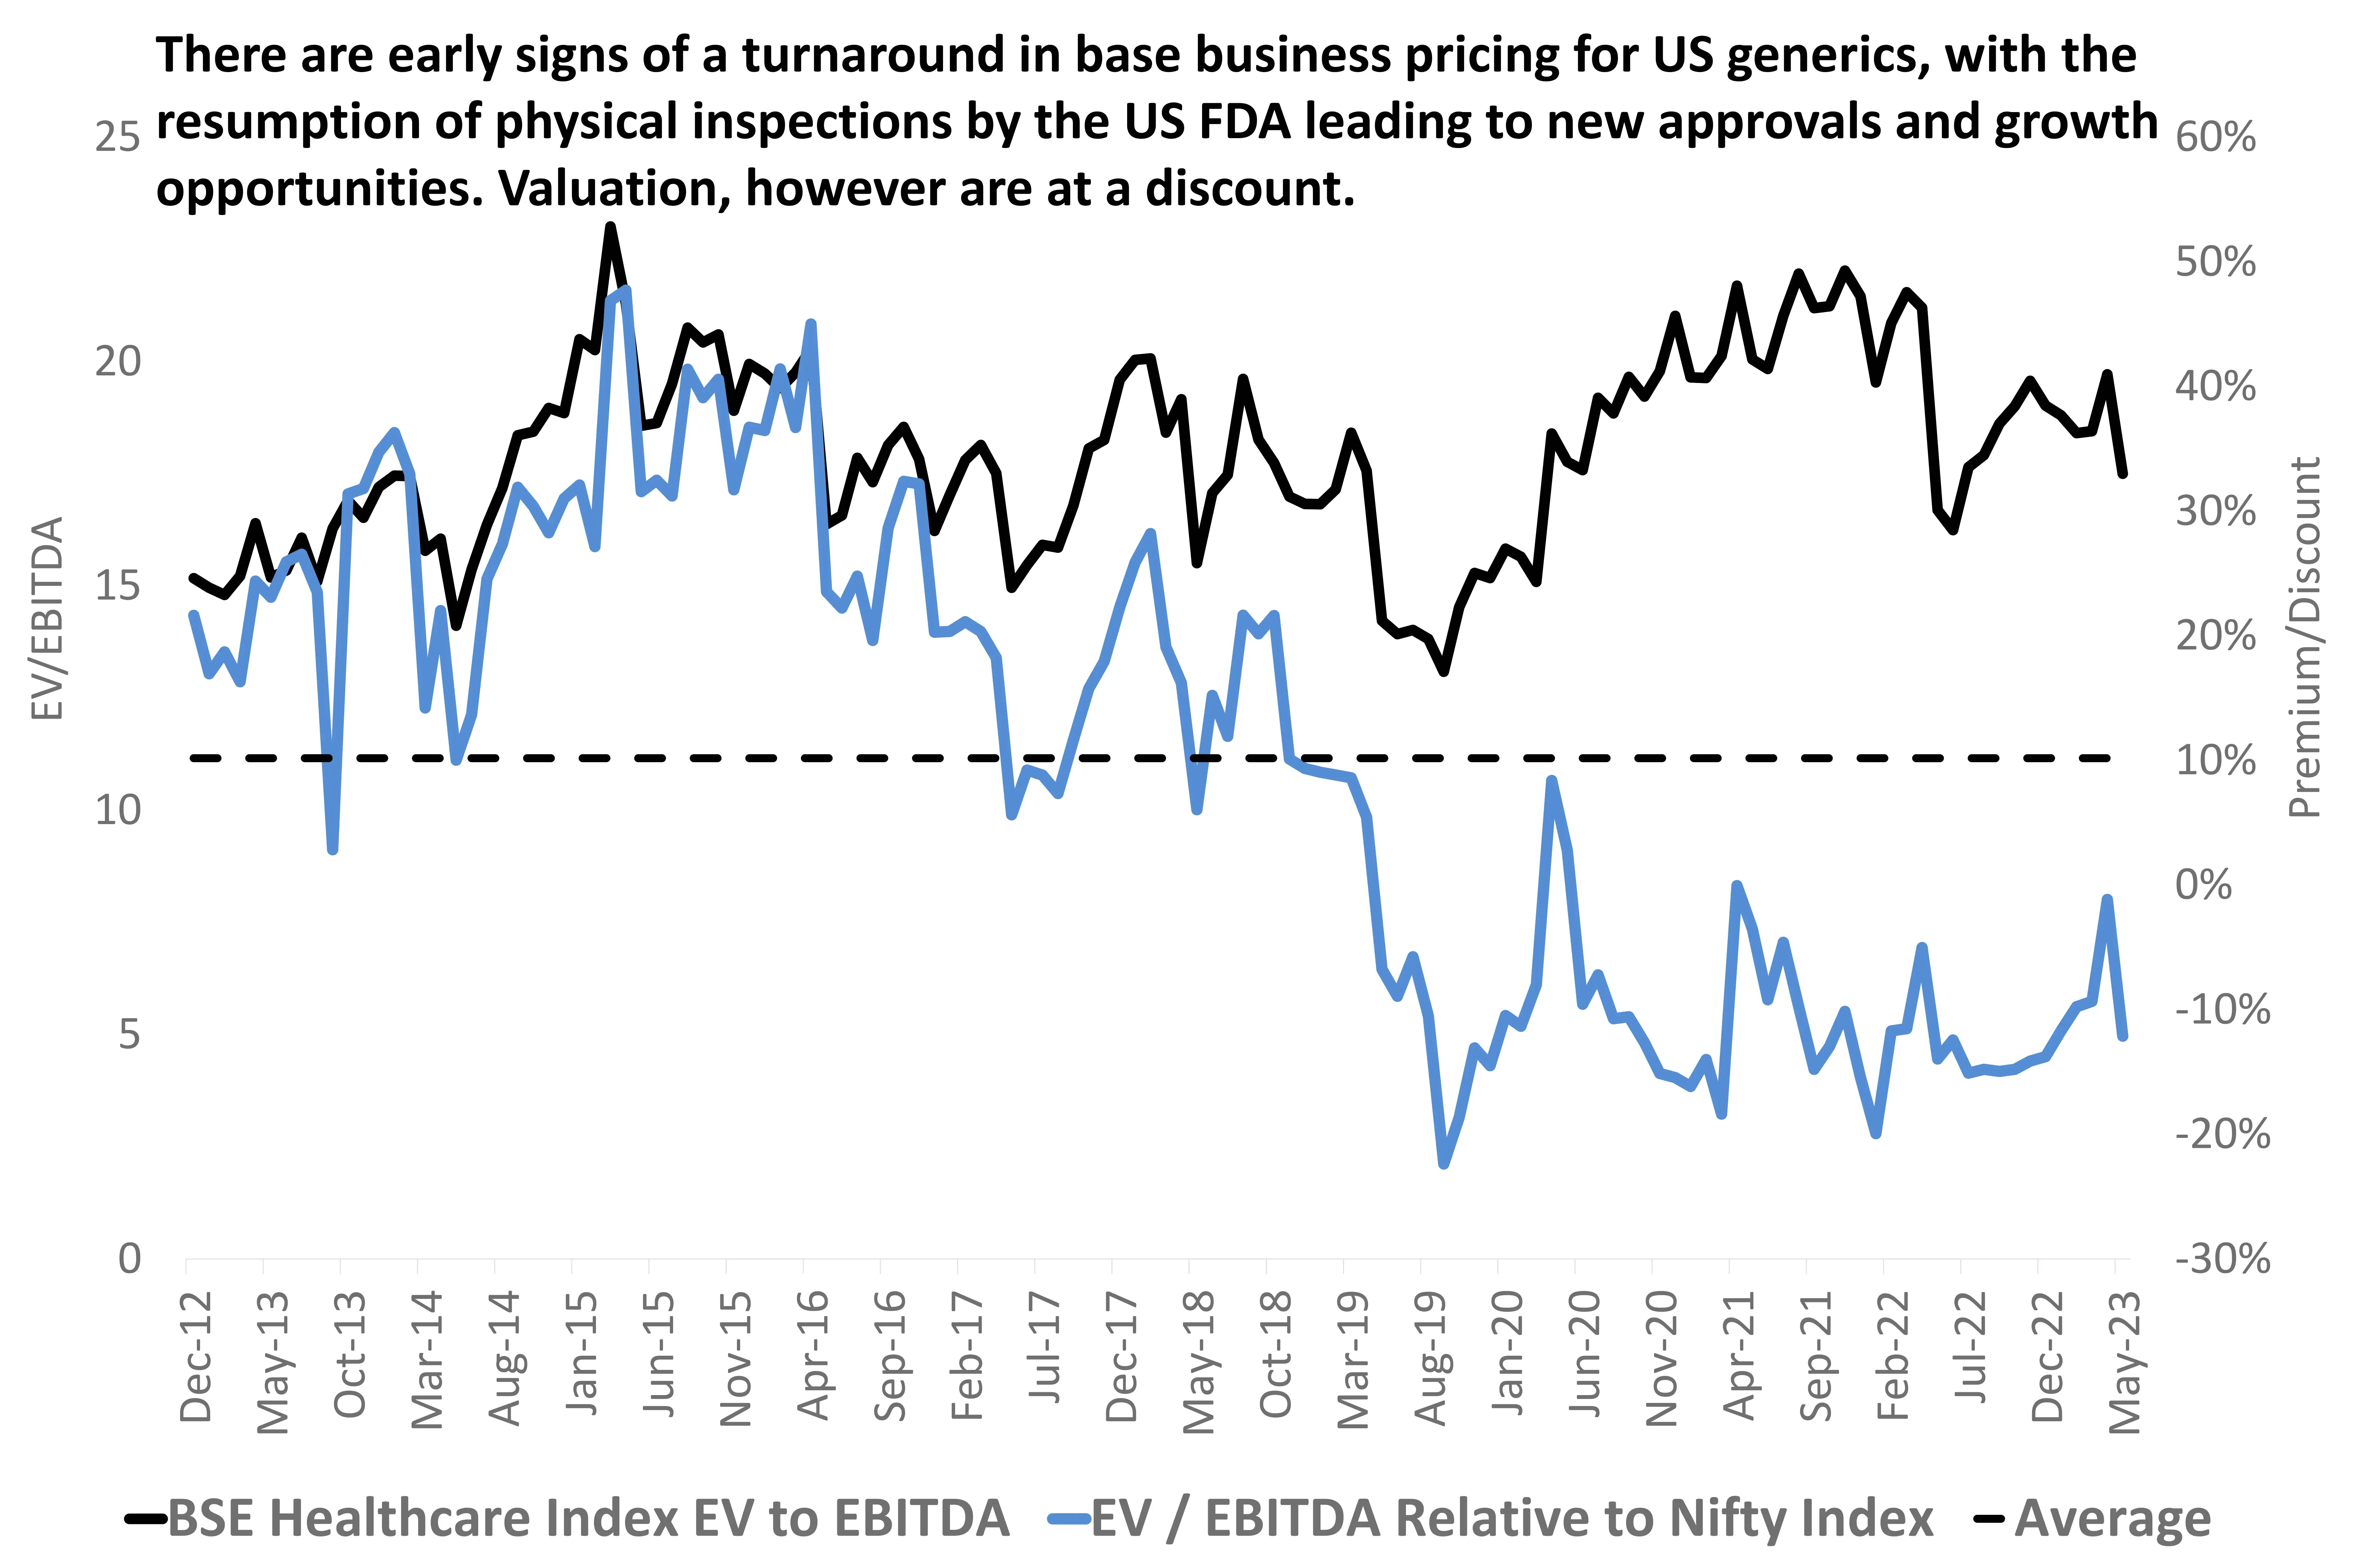
The BSE Healthcare Index trades at a 10% discount compared to the Nifty on an EV-to-EBITDA basis. Healthcare services are currently trading at a premium, while Pharma trades at a discount historically. The decline in the US generics market since 2018-19 is a significant reason for this discount. However, there are early signs of a turnaround in base business pricing for US generics, with the resumption of physical inspections by the US FDA leading to new approvals and growth opportunities. US generics-focused stocks are expected to rise due to drug shortages in the US, increased market share of Indian pharma companies, and an improvement in earnings trajectory
Indian formulations-focused companies are likely to experience a slight improvement in margins due to healthy growth in the Indian business and moderation in raw material prices. The Indian domestic branded business, valued at $20 billion, has been growing at a CAGR of 11% over the last decade and is expected to continue growing.
This segment is attractive due to its high stickiness and brand recall, low capital expenditure and research and development costs, high margins, strong free cash flow, and a low working capital cycle.
Source: Bloomberg, DSP Data as on June 2023
 Account Statement
  Capital Gain Statement
  Key Information Memorandum
  PAN Updation
  Register / Modify KYC Online
  Nominee Registration
  Email / Phone Updation
  OTM / eNACH Registration
  Guidelines for Incapacitated Investors
  FAQs
FAQs Reach us


