Neutral is the word
Macro-data remains strong… leading to
upside yield risks
We remain invested, but reduced risk by half
We have a “buy bias”: Ready to pull trigger
and buy if data worsens
Our View – Summary
Our Strategy: Be invested – neither underweight, nor overweight
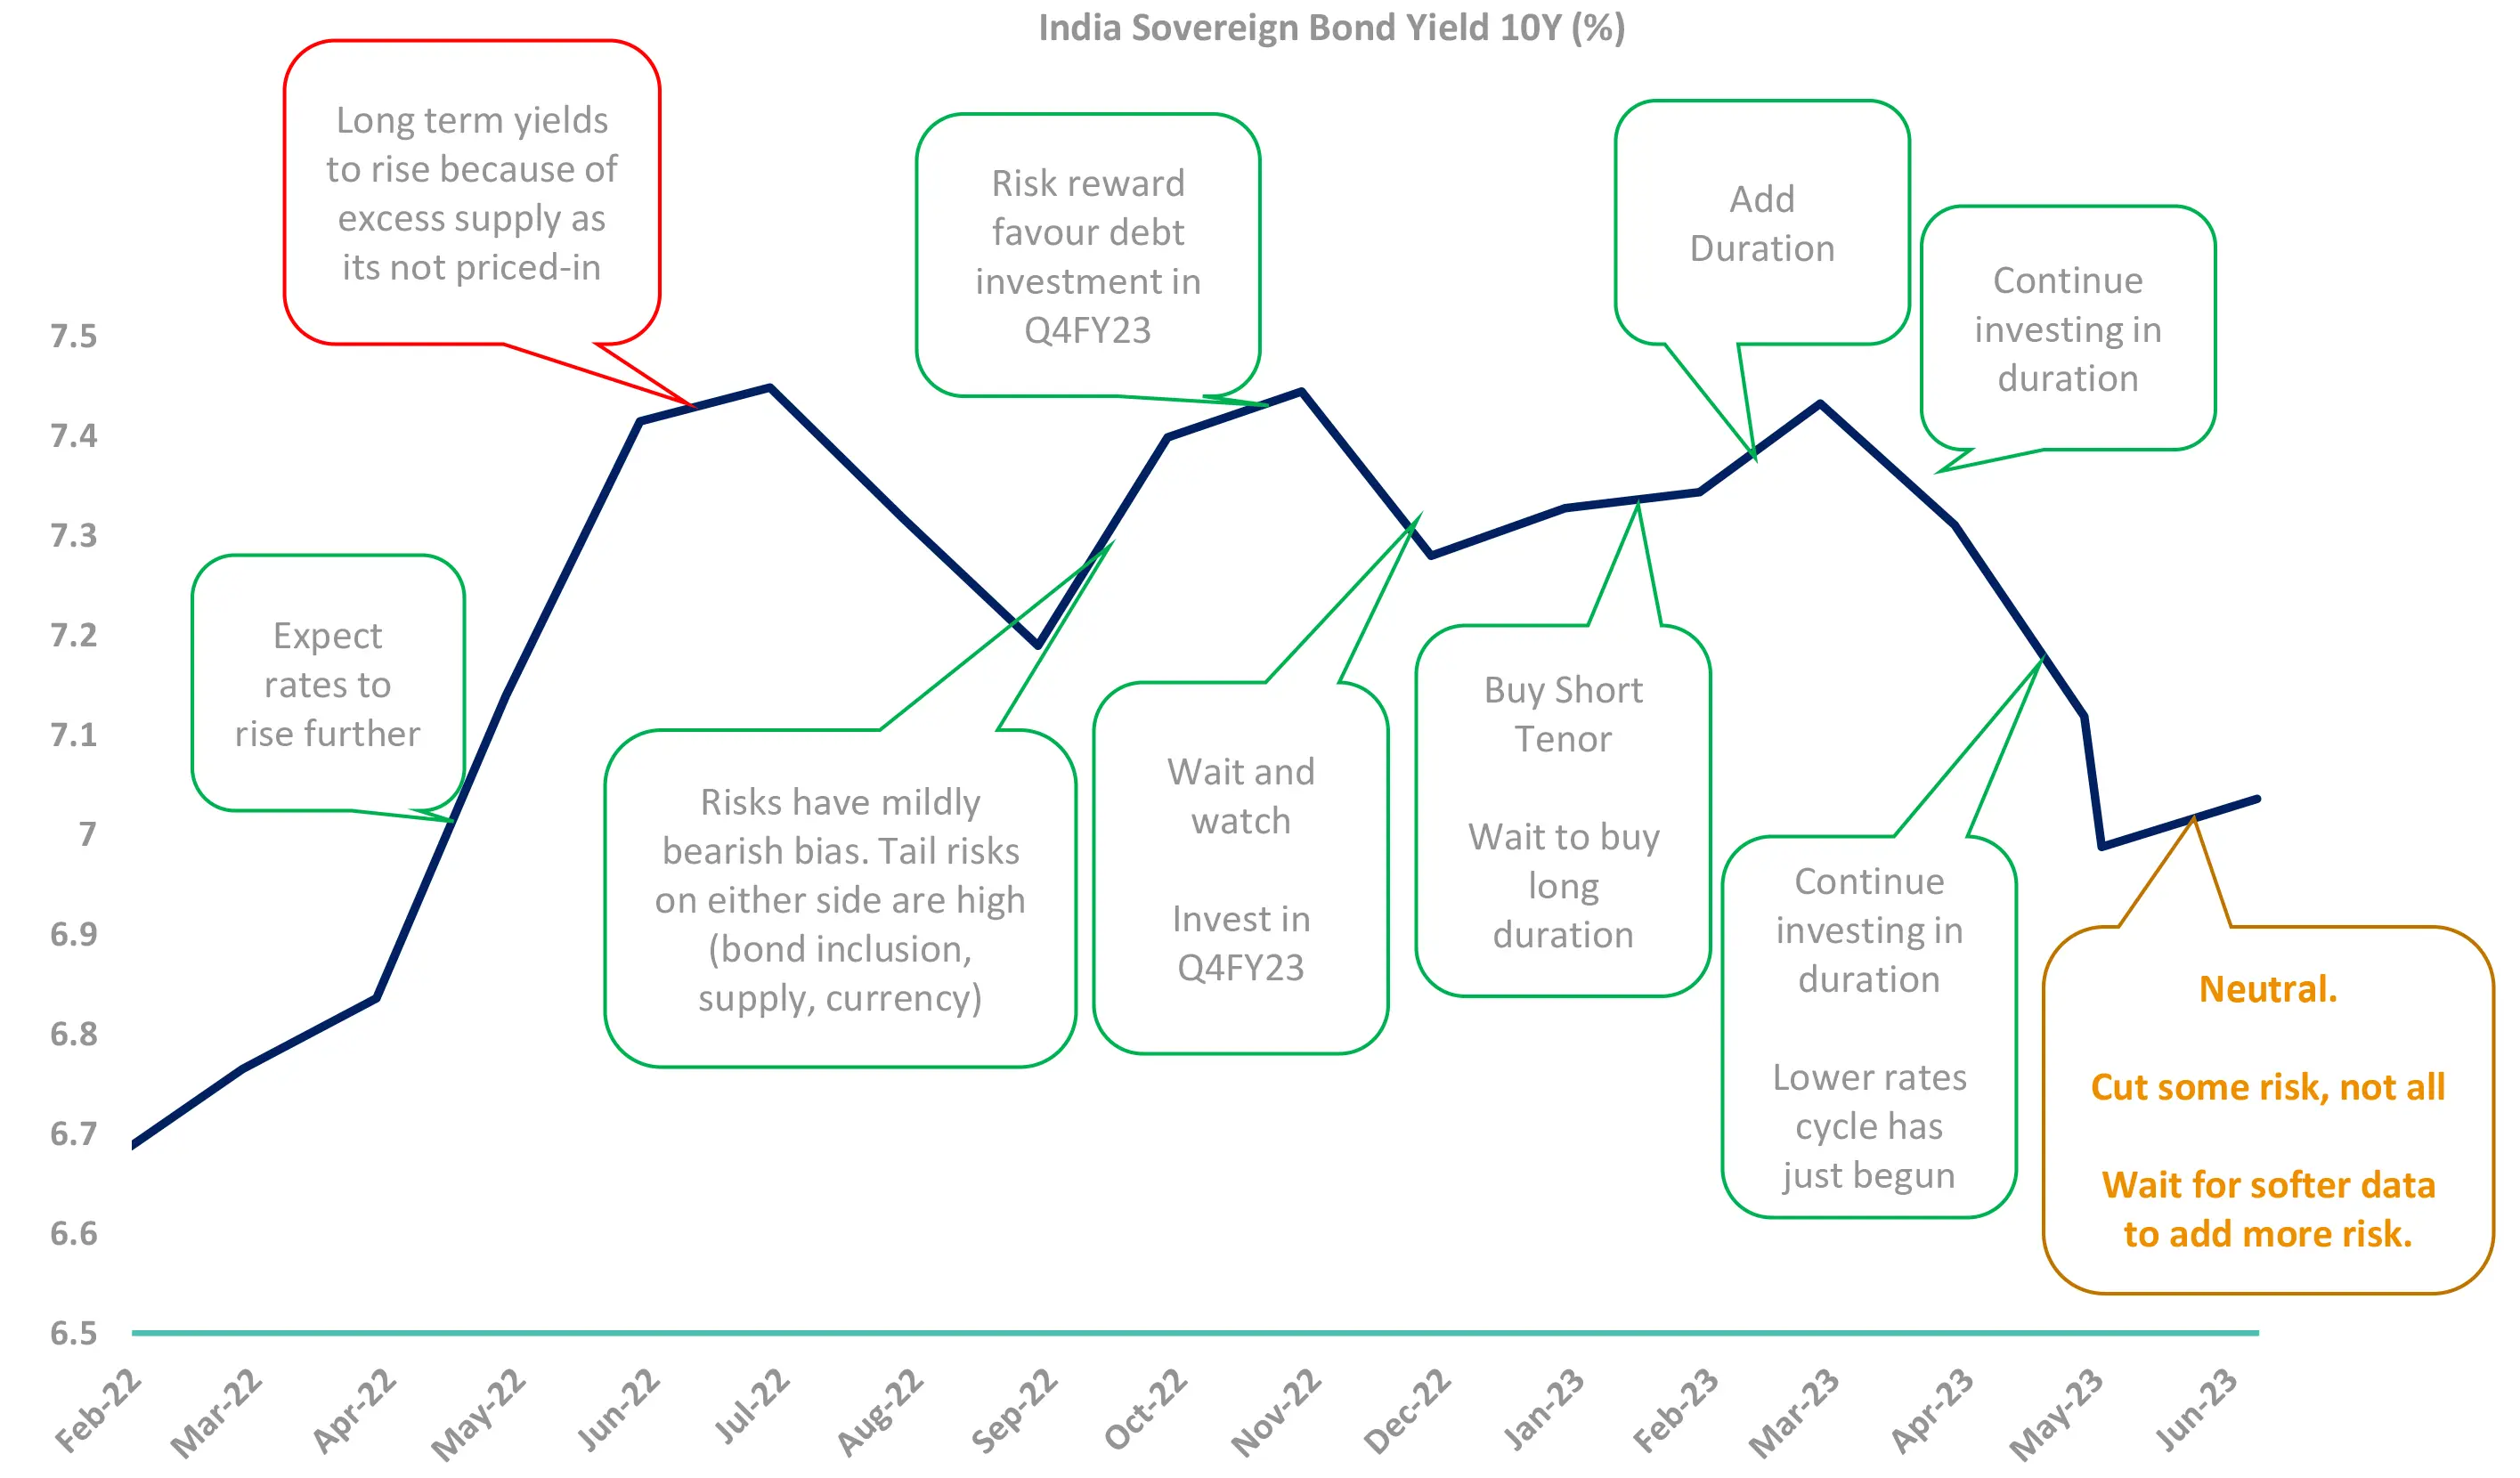
10Y Indian Gsecs have rallied 50 bps to 7%. For a further rally markets need to “price in” future rate cuts. But the US labor, CPI and services data have remained robust. Unless US (or India) economic data softens, rate cuts won’t be expected. Until then yields won’t fall.
In such a scenario, currently we prefer being neutral. If underlying macro data does not change, but markets rally on sentiment – we will sell and go underweight. If markets sell on panic, we will buy .
But if the macro data weakens, we will add duration without hesitation
For money markets investment: Even though the yields have rallied, we believe, staying in the longer end of the money markets curve is more beneficial. The surplus liquidity will keep a cap on rates.
-
Reasons for our view
- Data just isn’t weakening: The US data remains sticky. Indian inflation has softened- but this seems transient. Thus, why should central banks cut rates? But markets have priced in rate cuts.
- Demand-Supply has turned neutral: Banks SLR holding has increased to high levels. But the demonetization may lead to more purchases. The Insurance/PF/EPFO will continue to buy. But SDL issuances may increase
-
Risks to our view
- Date dependency: Continued strong job market could be inflationary, and similarly a weaker data will mean crash of yields. India data too is unsure, with El Nino/monsoon, Crude prices.
G-Sec: Government Securities; SDL: State Development Loans; CPI: Consumer Price Inflation; PF: Pension Funds; EPFO: Employees’ Provident Fund Organization; SLR: Statutory Liquidity Ratio
To start with,
Recap of events since last release.
RBI continued with a PAUSE
Favourable domestic macro-data (inflation-growth)
Period of EASY DURABLE LIQUIDITY
FED PAUSE but expects more rate hikes
RBI continued with a PAUSE
-
Rate Action
Unanimously voted to keep key policy rates unchanged at 6.5%
-
Stance
5 of 6 members voted for remain focused on withdrawal of accommodation
-
Inflation
Revised lower by 10bps to 5.1% for FY24
- ✓ Revised down sharply for Q1 from 5.1% to 4.6%
- ✓ Forecast of a normal south-west monsoon augurs well for kharif crops
- X Outlook on crude prices remain uncertain
-
Growth
GDP forecast retained at 6.5% for FY24
- ✓ Good rabi crop, expected normal monsoon & buoyancy in services to support demand
- X Weak external demand and geo-political tensions remain a concern
RBI: Reserve Bank of India
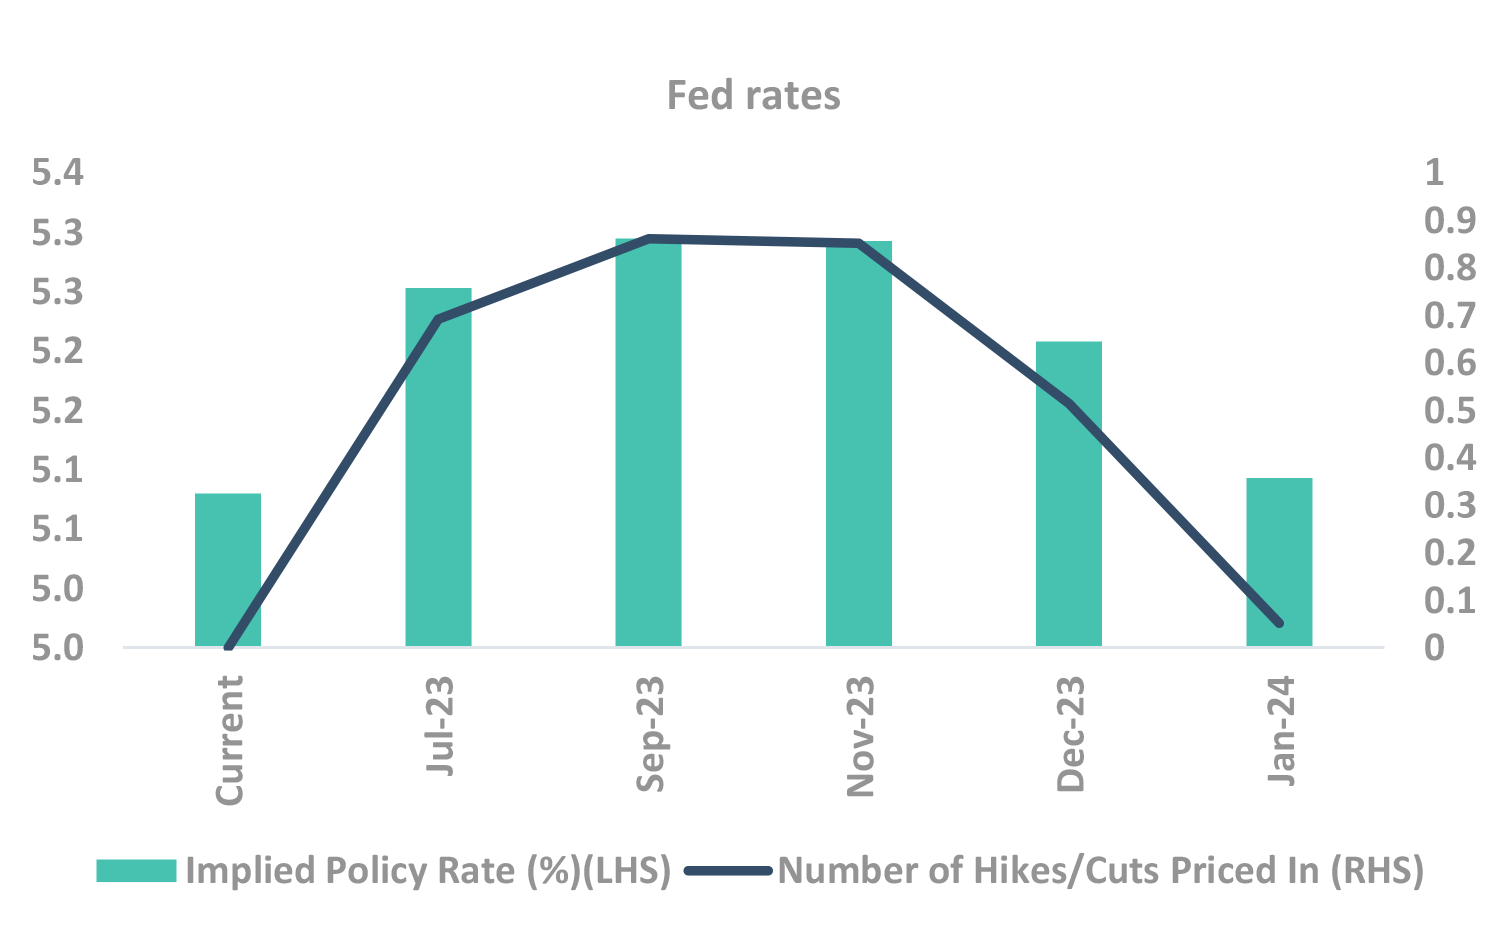
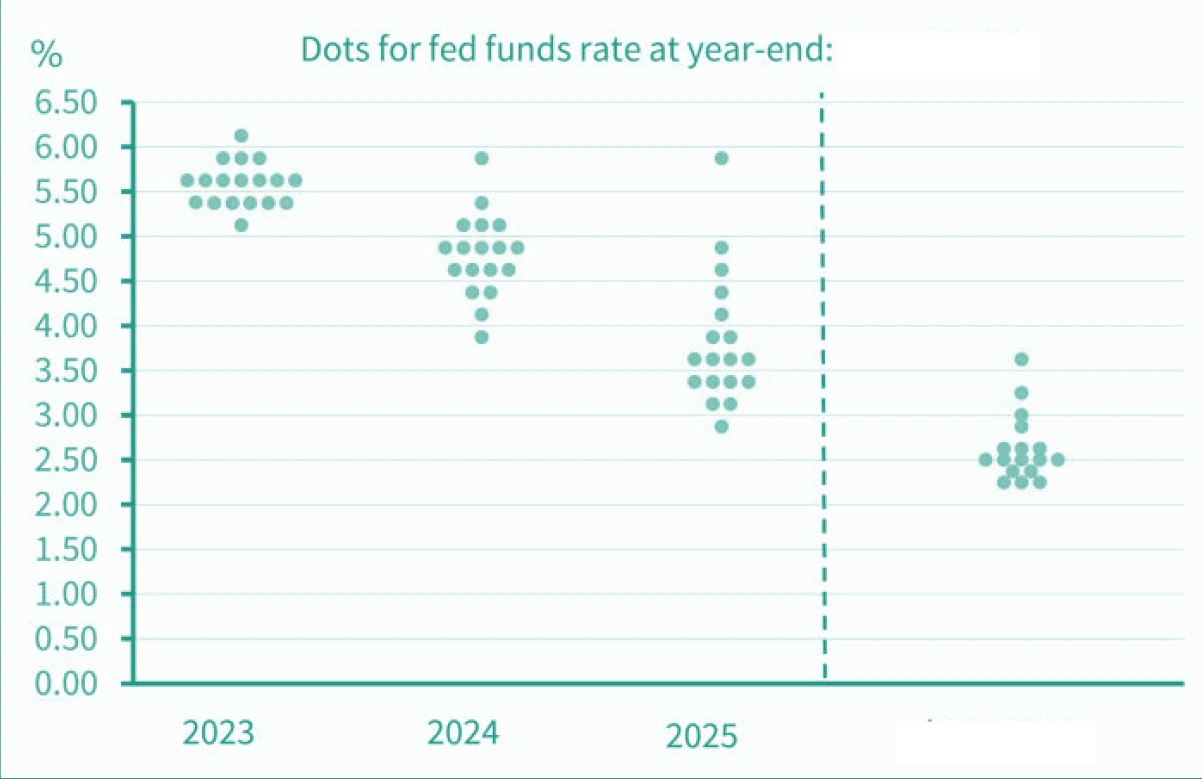
FED did a hawkish PAUSE
Source – Bloomberg FOMC: Federal Open Market Committee
Why has US FED maintained
a hawkish stance
with
Dot plot indicating two more rate hikes?
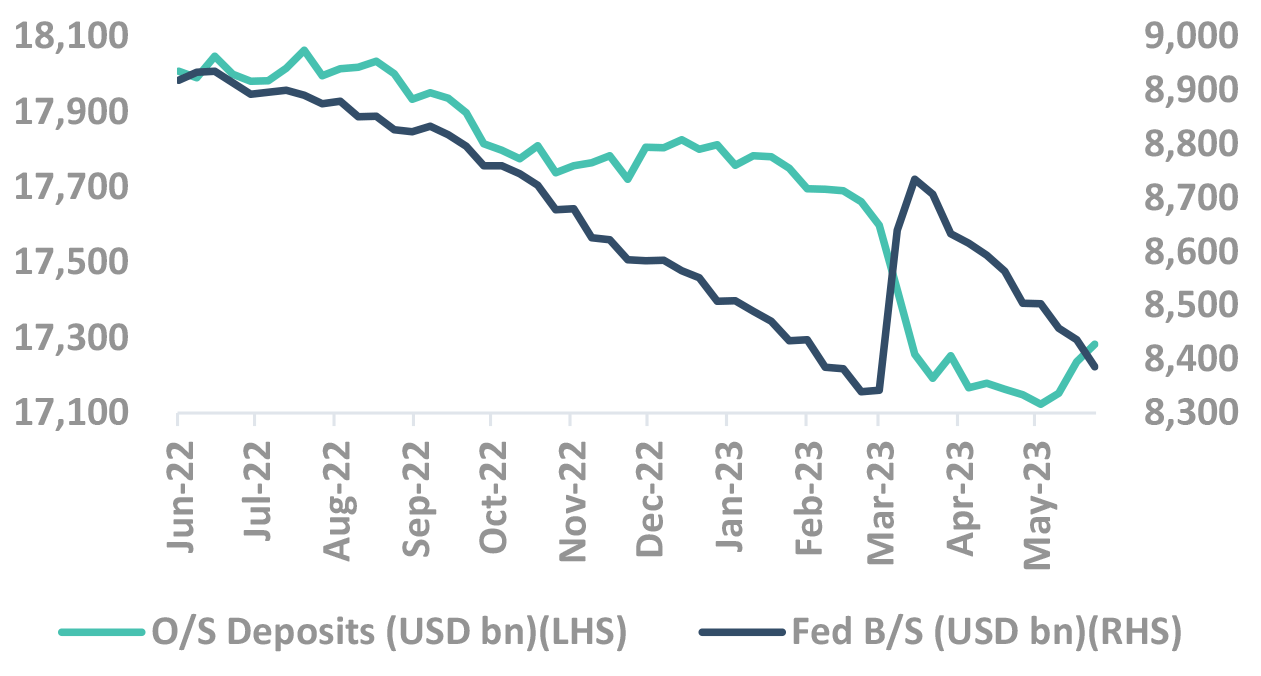
US Bank crisis waning – upside risks to rates
Source – Bloomberg FOMC: Federal Open Market Committee; B/S: Balance Sheet; Fed: Federal Reserve
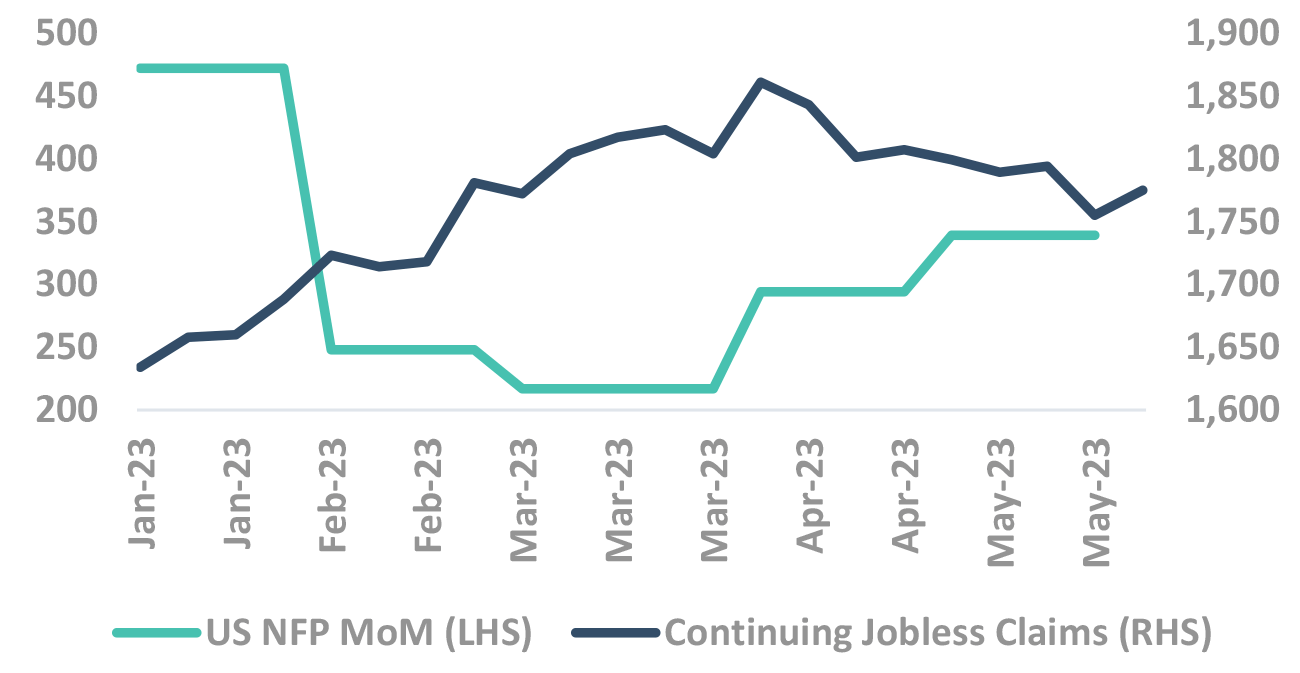
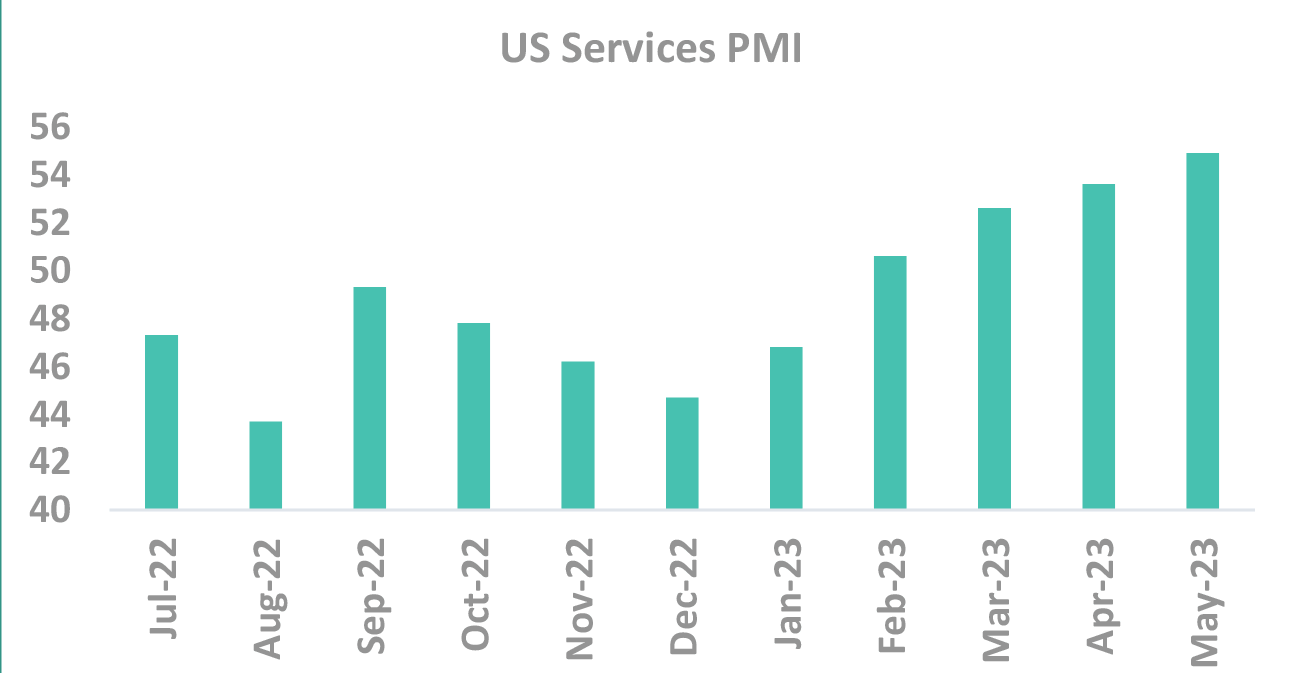
US Data still not showing any conclusive signs of weakness
Source – Bloomberg NFP: Non Farm Payroll, PMI: Purchasing Managers’ Index
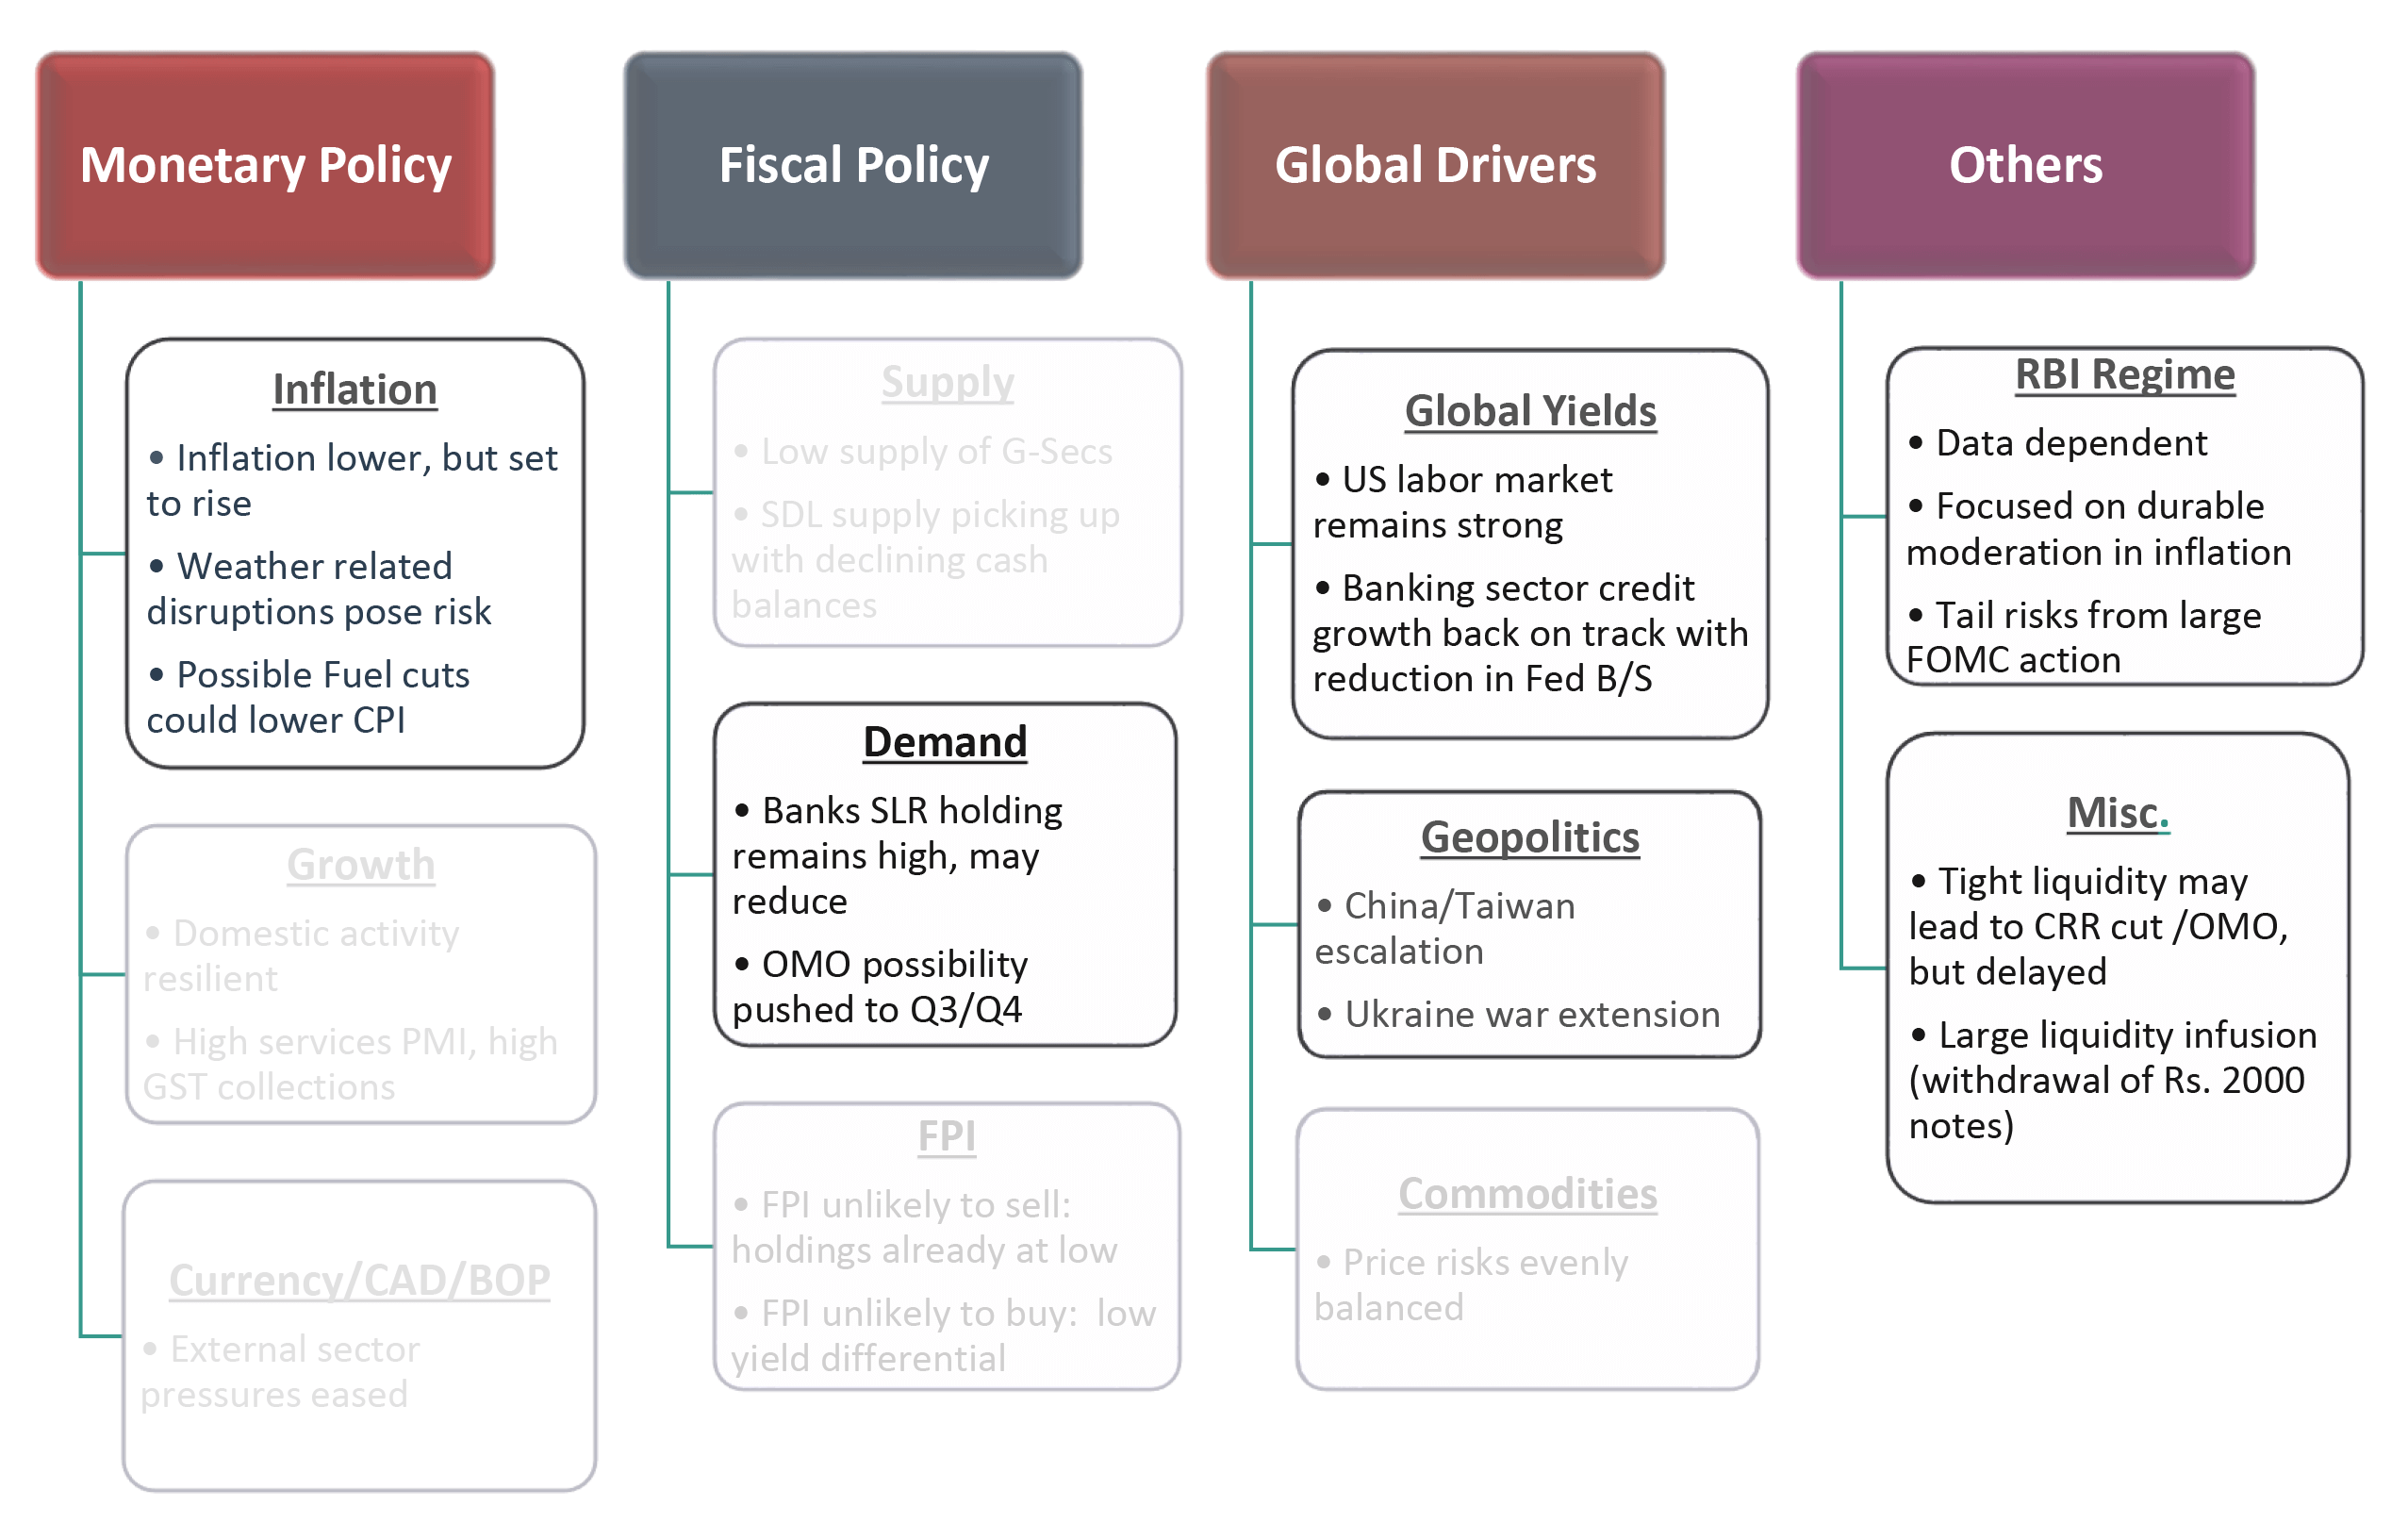
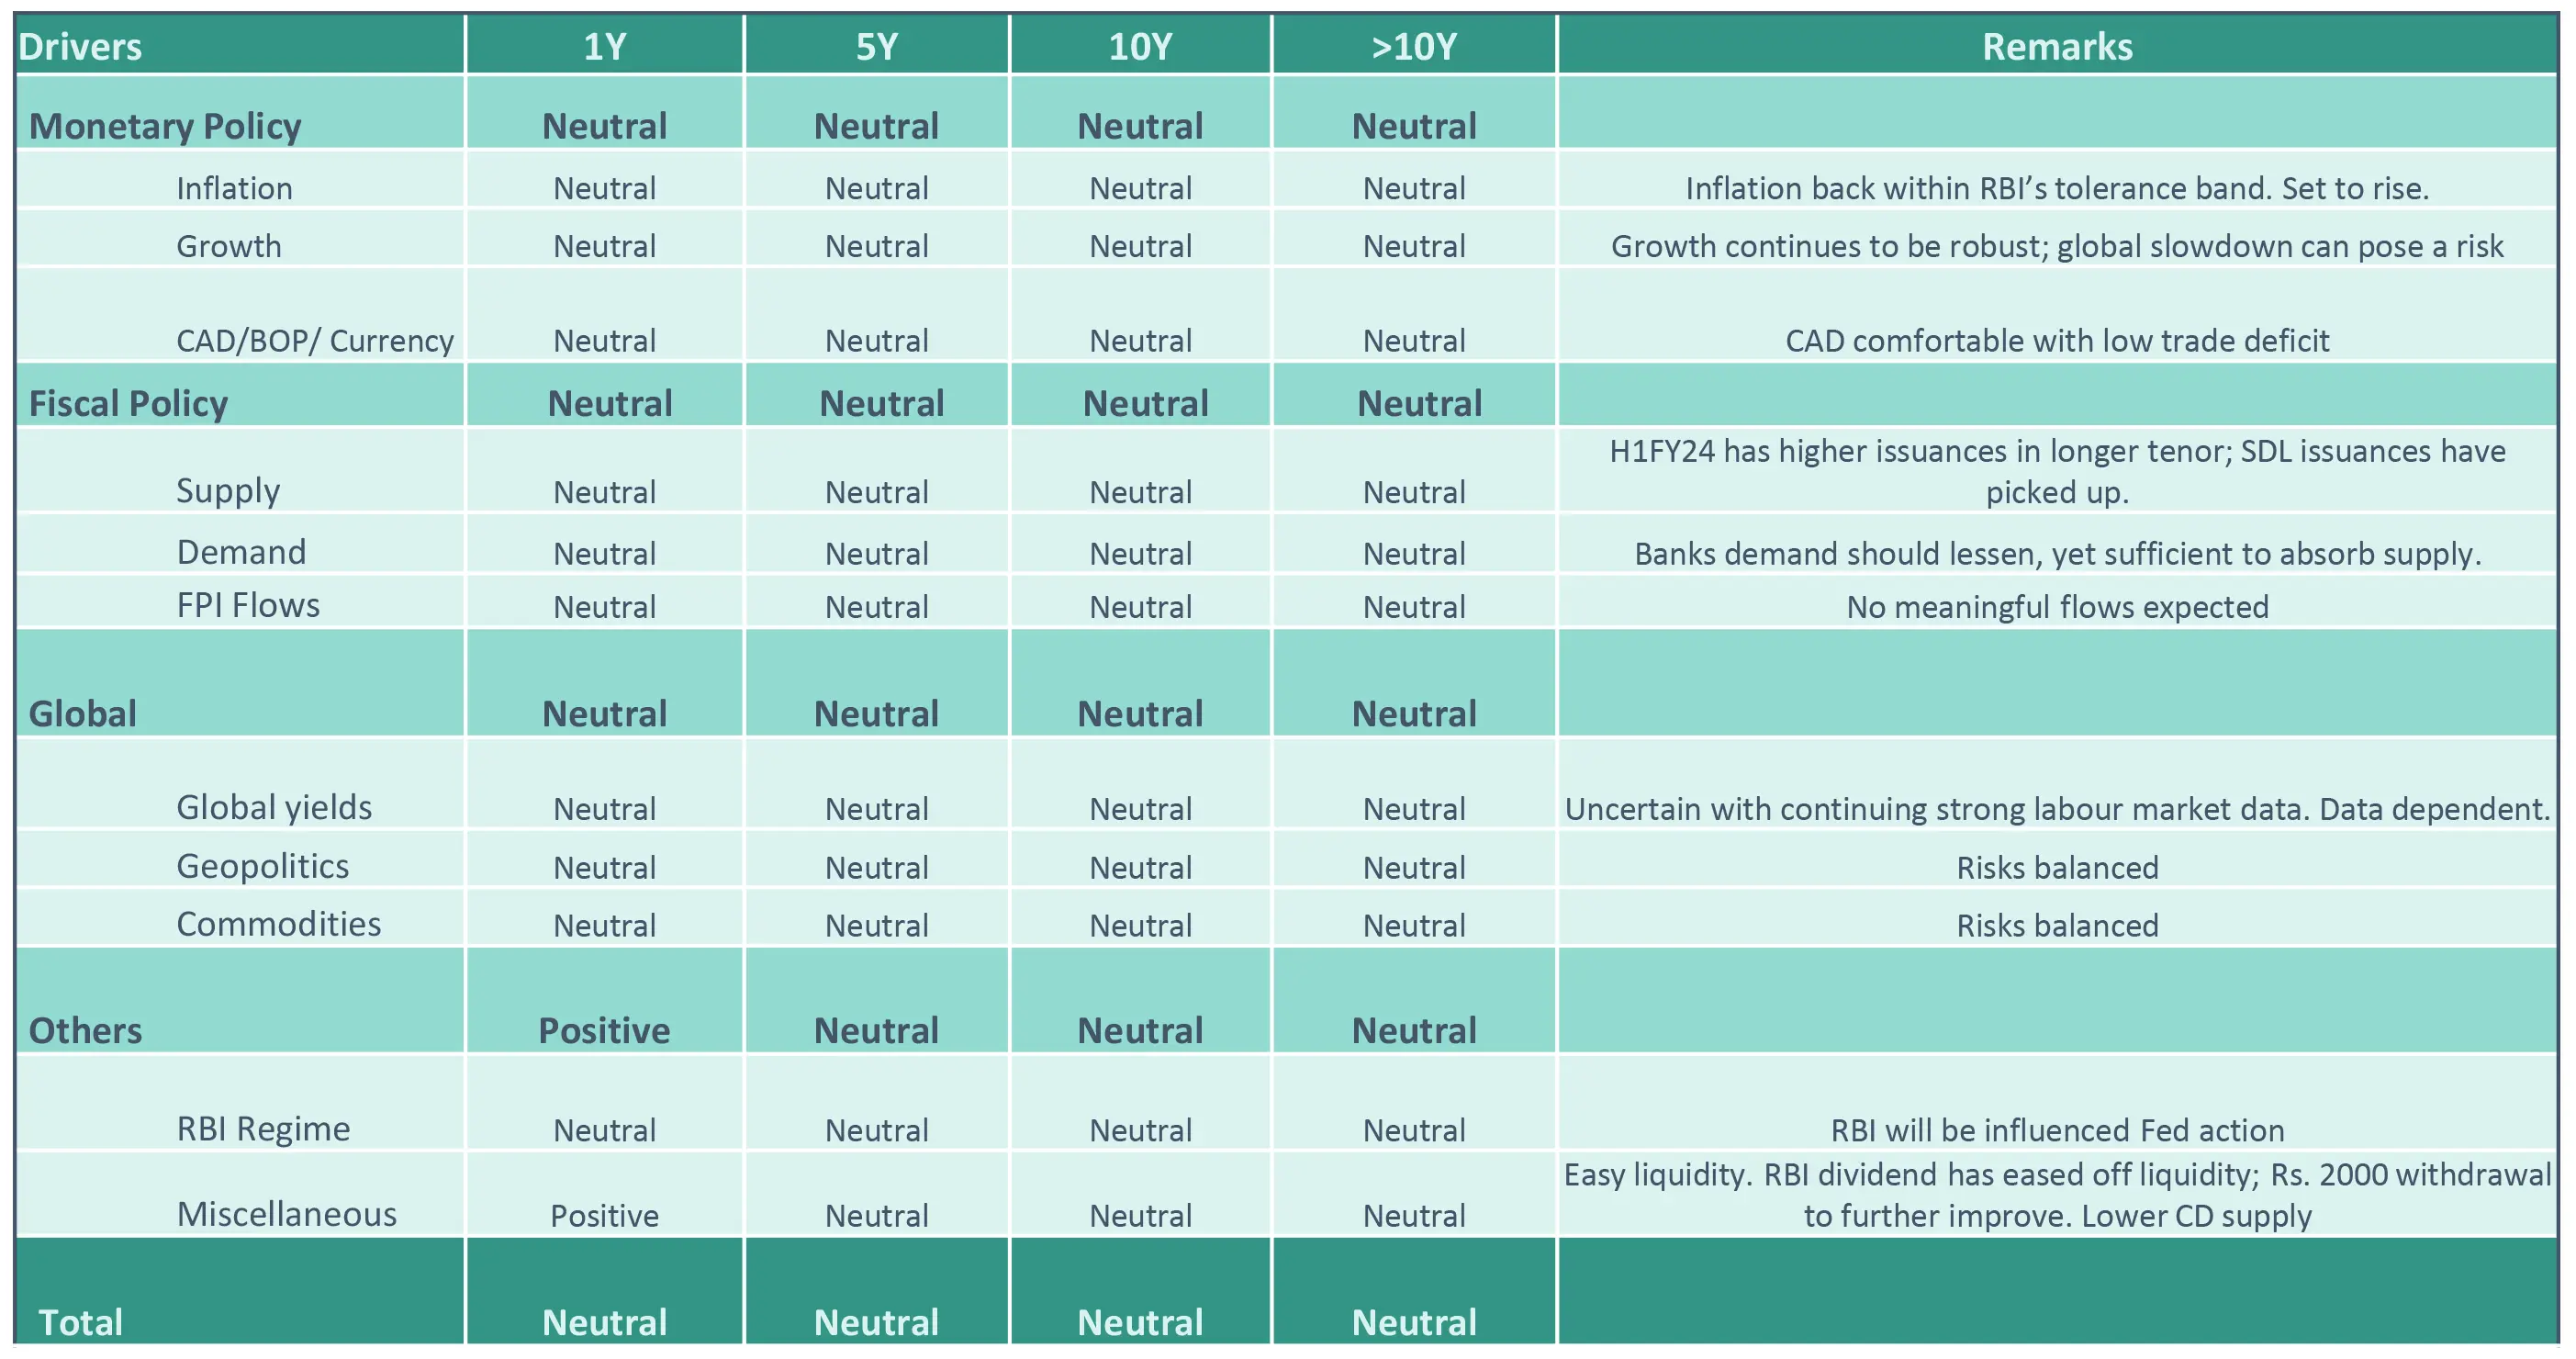
Now our framework
And
What we track
Our Framework
Takeaway:
We are neutral on all parameters. We wait for weaker data to change our view
CAD – Current Account Deficit; BoP – Balance of Payment; SLR – Statutory Liquidity Ratio; SDL – State Development Loans; RBI: Reserve Bank of India; G-Sec: Government Securities; OMO: Open Market Operation; FPI: Foreign Portfolio Investment; B/S: Balance Sheet; FOMC: Federal Open Market Committee; CRR: Cash Reserve Ratio; PMI: Purchasing Managers’ Index; GST: Goods and Services Tax
Improved Domestic Macros
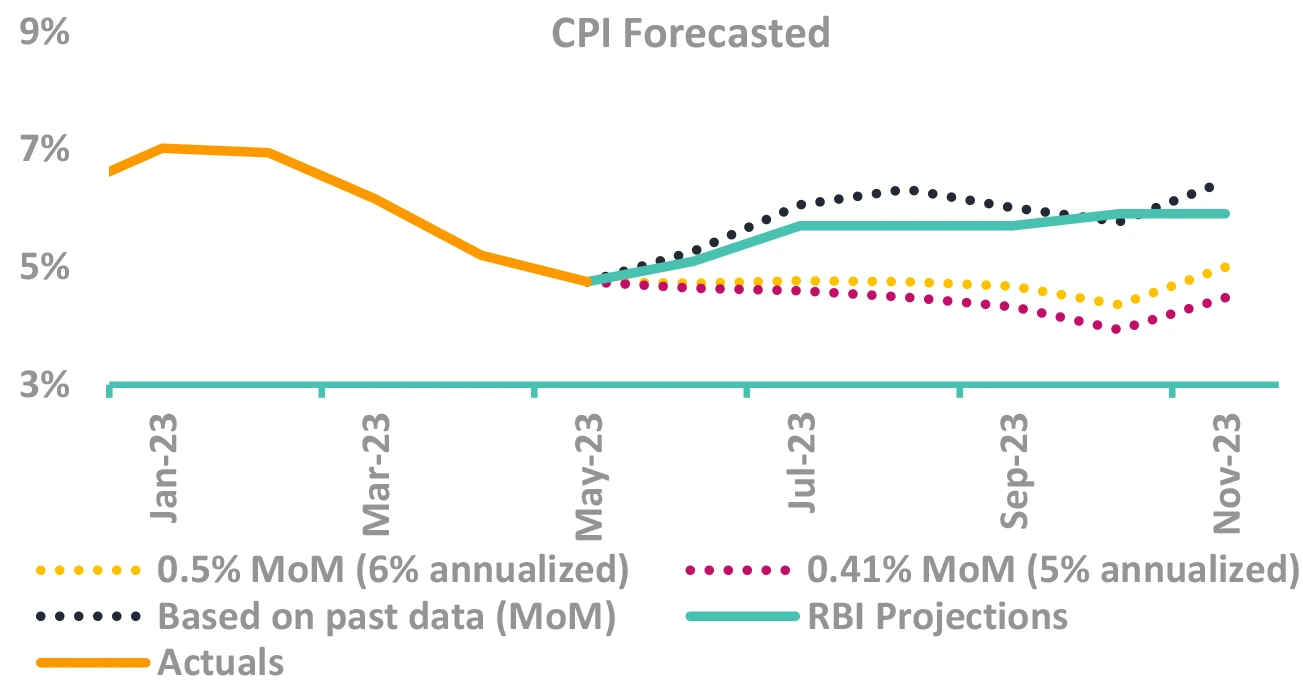
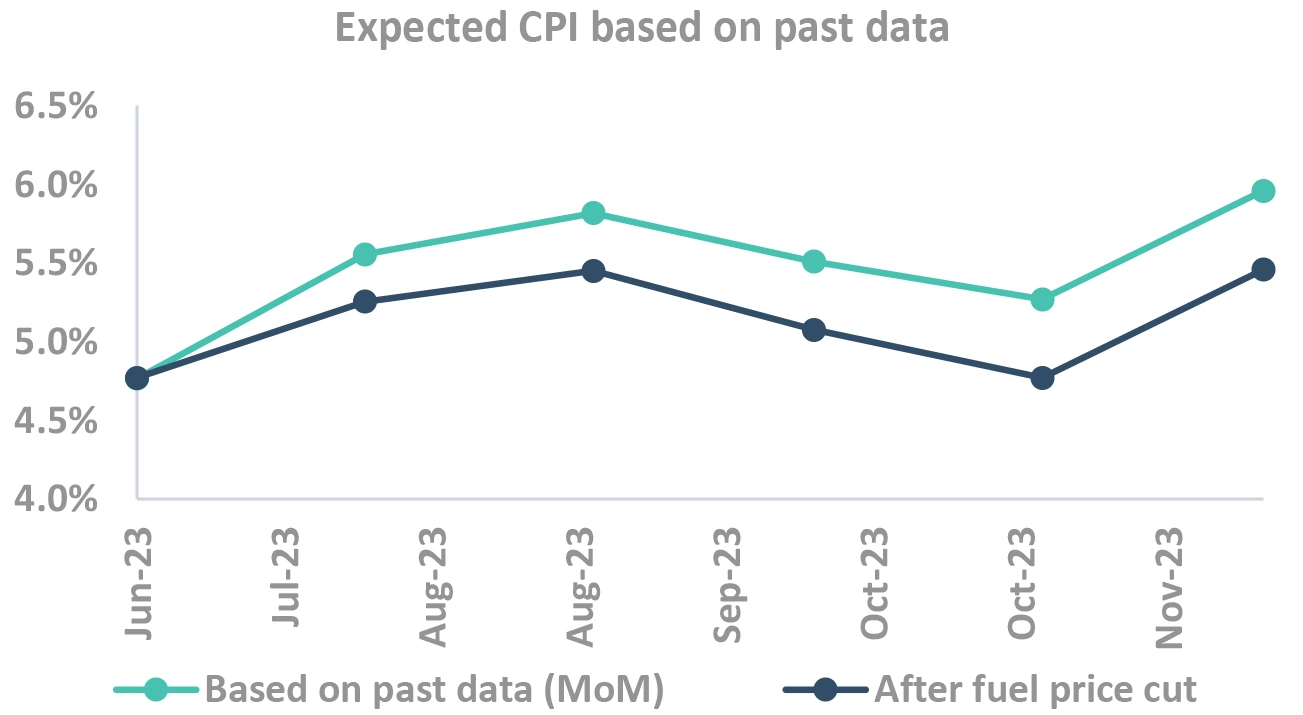
Inflation cooled (Fuel price cut)
But set to rise up (Seasonality & Food)
Though uncertainty ahead!
Inflation cools off, but set to rise
-
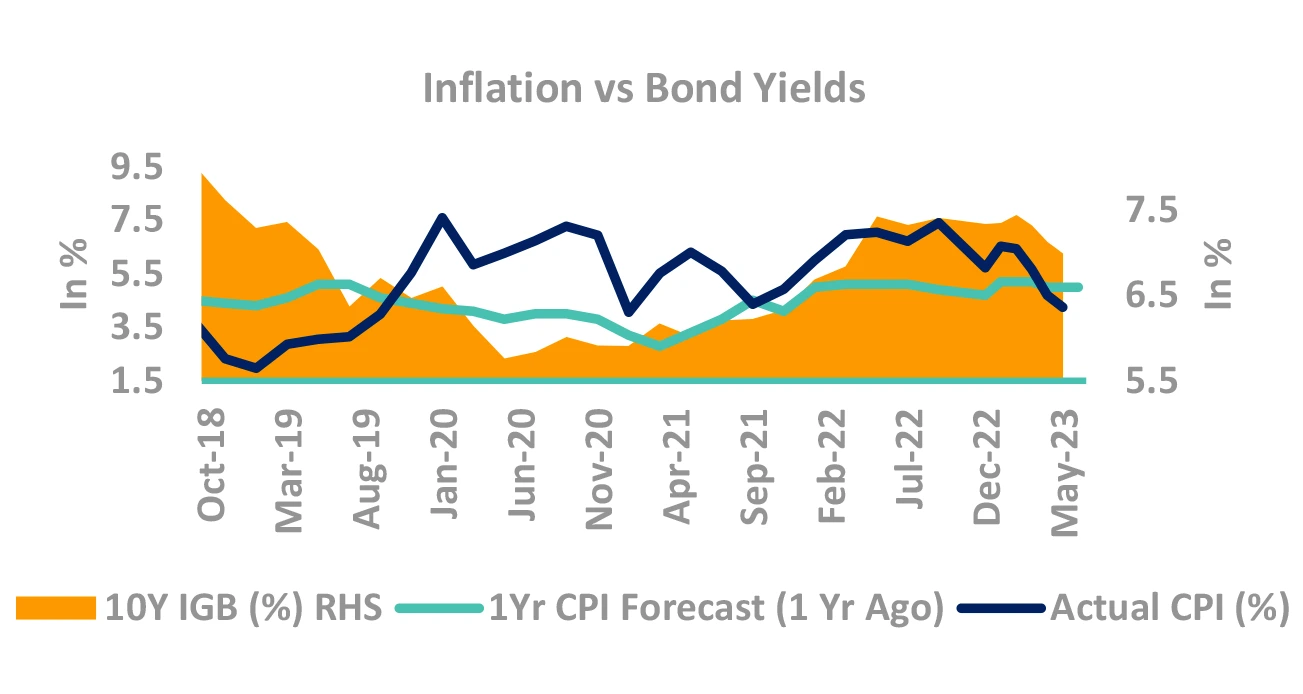
Do yields track inflation projection? No.
- Orange area (chart) is 10Y yields, Black line is CPI
-
Can forecasters predict Indian CPI? No.
- Green line is forecasters prediction of CPI 1-Year later
- Blue line is where inflation actually came.
- Guess the error of margin!
-
CPI forecast corelated (not causality) to yields.
- Low predictive power, high current corelation
Takeaway:
Best in CPI probably behind – set to rise up. Rules out any rate cuts for now.
Source – Bloomberg, RBI, Internal CPI: Consumer Price Inflation; RBI: Reserve Bank of India; IGB: India Government Bond
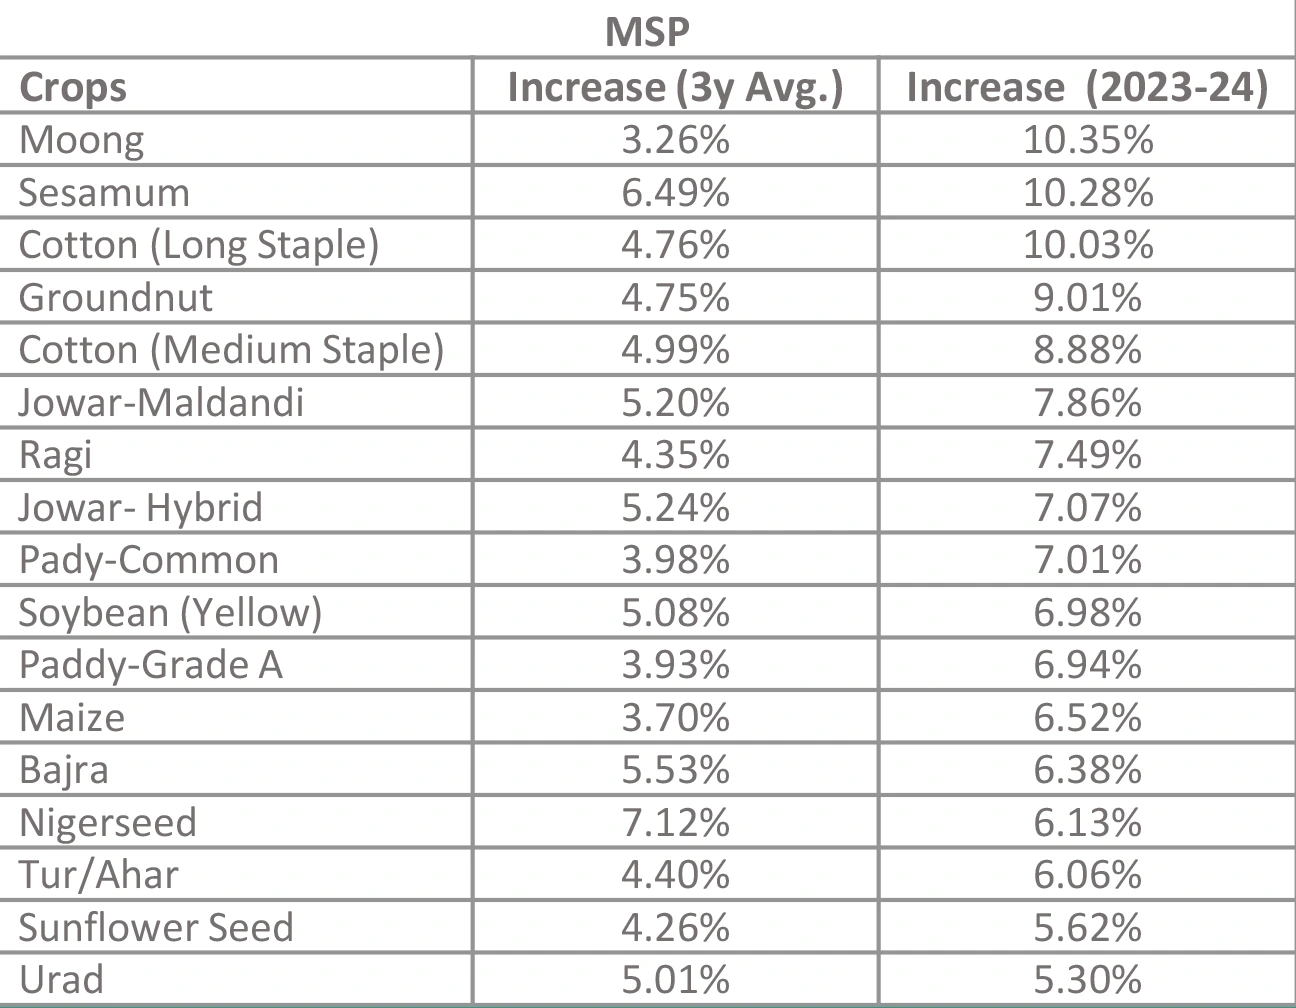
Inflation to remain above RBI’s comfort zone
Takeaway:
Even if lower CPI surprises, it will still remain above Governor’s comfort zone.
Source – Bloomberg, PIB, Internal CPI: Consumer Price Inflation; RBI: Reserve Bank of India; MSP: Minimum Support Price
India’s
growth remains resilient
across high and low frequency data.
Will global slowdown test domestic growth?
-
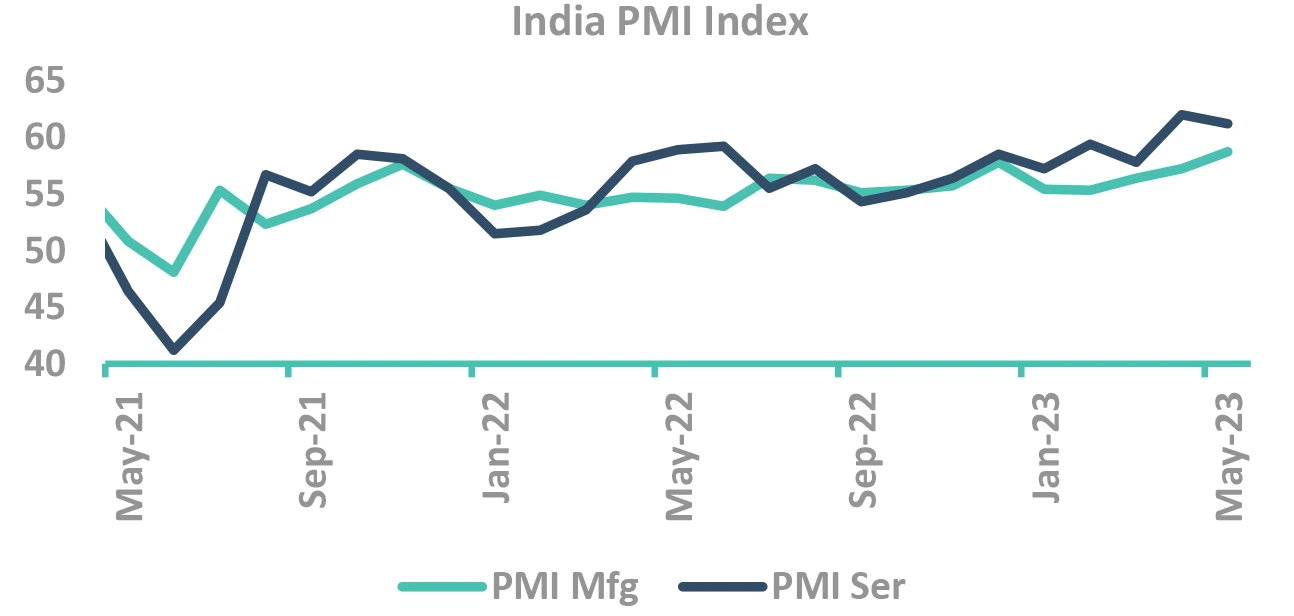
Domestic growth data still robust
- PMI continues to be in expansionary mode
- Consistently high services PMI (May at 61.2)
- GST collections at Rs. 1.57 lac cr; YoY growth at 11%
-
Strong credit growth
- Led by retail, MSME and services
- Credit to large industry also picking up (specially in infra related sectors)
-
How closely do yields track growth?
- Yields have usually tracked GDP growth, with correlation being stronger when growth slows, barring
- ✓ 2013, rupee depreciation and debt outflows
- ✓ 2017, during demonetization
- Yields have usually tracked GDP growth, with correlation being stronger when growth slows, barring
-
FY24, growth may not be big driver for yields
- FY23 GDP came in at 16.1%, in line with RBI projections
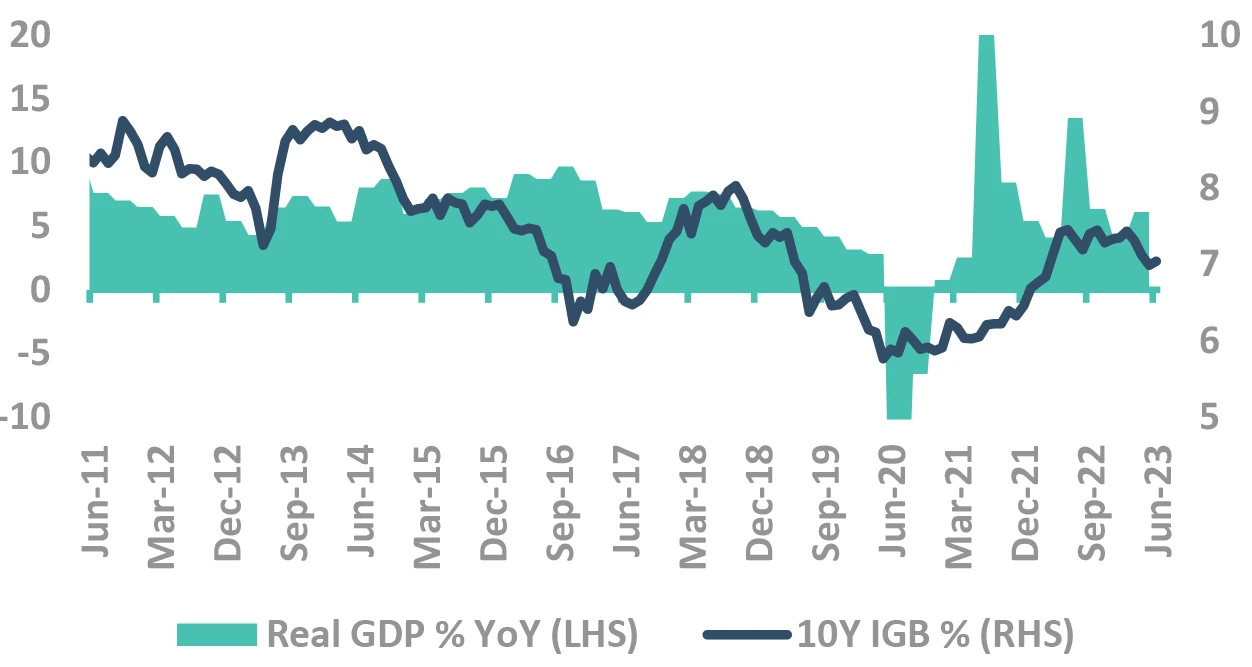
Takeaway:
Domestic growth seems resilient so far despite global slowdown fears
Source – Bloomberg GDP: Gross Domestic Product; PMI: Purchasing Managers’ Index; GST: Goods and Service Tax; IGB: India Government Bond; Mfg: Manufacturing; MSME – Micro, Small & Medium Enterprises
What made RBI Pause?
What drives pauses: Series of hygiene factors
The checklist for pause:
-
When the US Fed starts pausing
- Reduces risk of capital outflows
-
When inflation is within comfort
- Reduces risk of inflationary policy
- Barring 2014, when RBI did not have 6% CPI target
- ✓ But CPI was falling in 2014
-
When BoP (and currency) is stable
- Reduces inflationary / external risks
How is the checklist now?
-
↔ US FED has indicated two more hikes
- Even though FED has paused the rates for now.
- US yields much lower, expecting rate cuts in CY23
-
✓ Inflation moderated to comfort zone
- CPI <5%, but will increase further
-
BoP (rupee) is stable
- Bop in surplus in Q3FY23
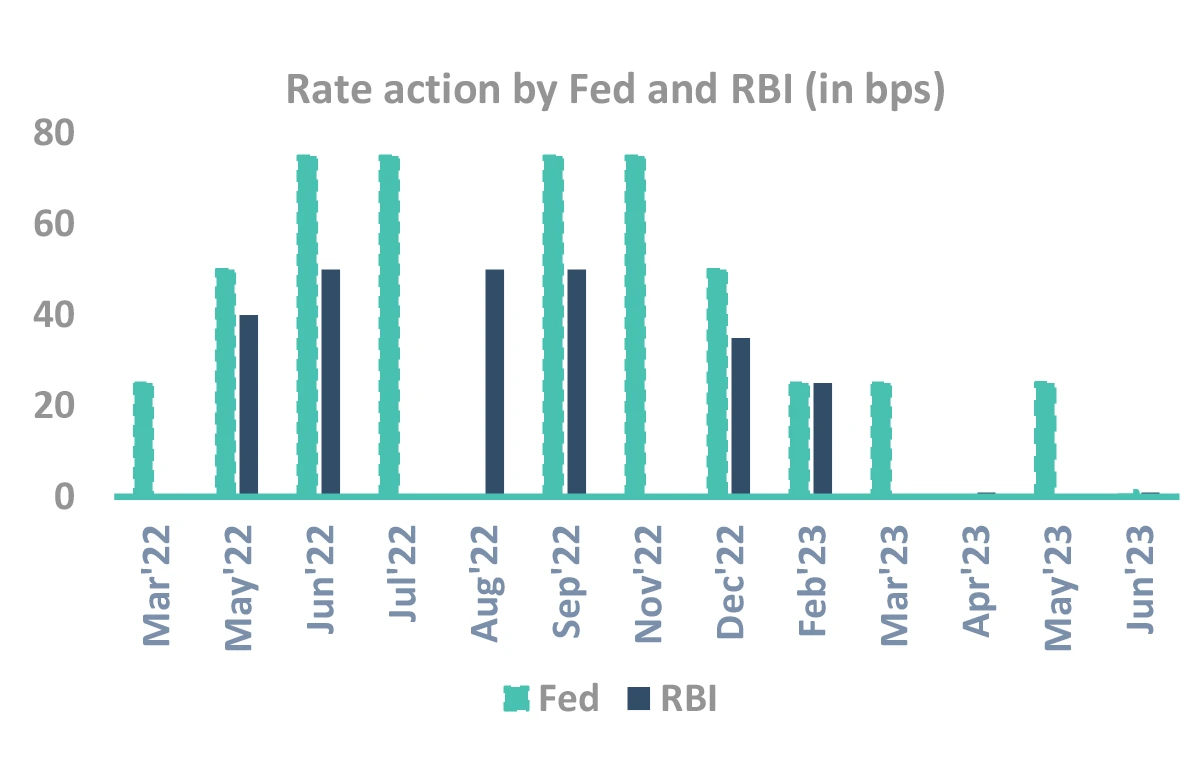
RBI actions followed FOMC – expect the same going ahead
Takeaway:
RBI MPC has shades from FED FOMC. If Fed hikes a lot, don’t be surprised with RBI
Source – Bloomberg, Federal Reserve RBI: Reserve Bank of India; US FED: US Federal Reserve; FOMC: Federal Open Market Committee; MPC: Monetary Policy Committee
Why should RBI follow FOMC?
-
RBI tracks FOMC because of emanating rupee risks…
-
..But rupee is stable, so why should RBI worry about FOMC?
-
Because no one knows how rupee will react if FED rates go ~6%
- Higher FED rates could lead to recession in US impacting
- Software and merchandise exports
- There could be risk-off and capital outflows from emerging countries
- Higher FED rates could lead to recession in US impacting
-
Bottom-line: We are wary of risks. We don’t know how, or even if they will pan out.
FOMC: Federal Open Market Committee
Inflation is low, but set to rise
Growth is resilient, but risks ahead
MPC unlikely to act in near future
Only tail risk to RBI policy rate is large
FOMC actions
Let’s turn to Fiscal policy
Generally, it drives the long bond yields
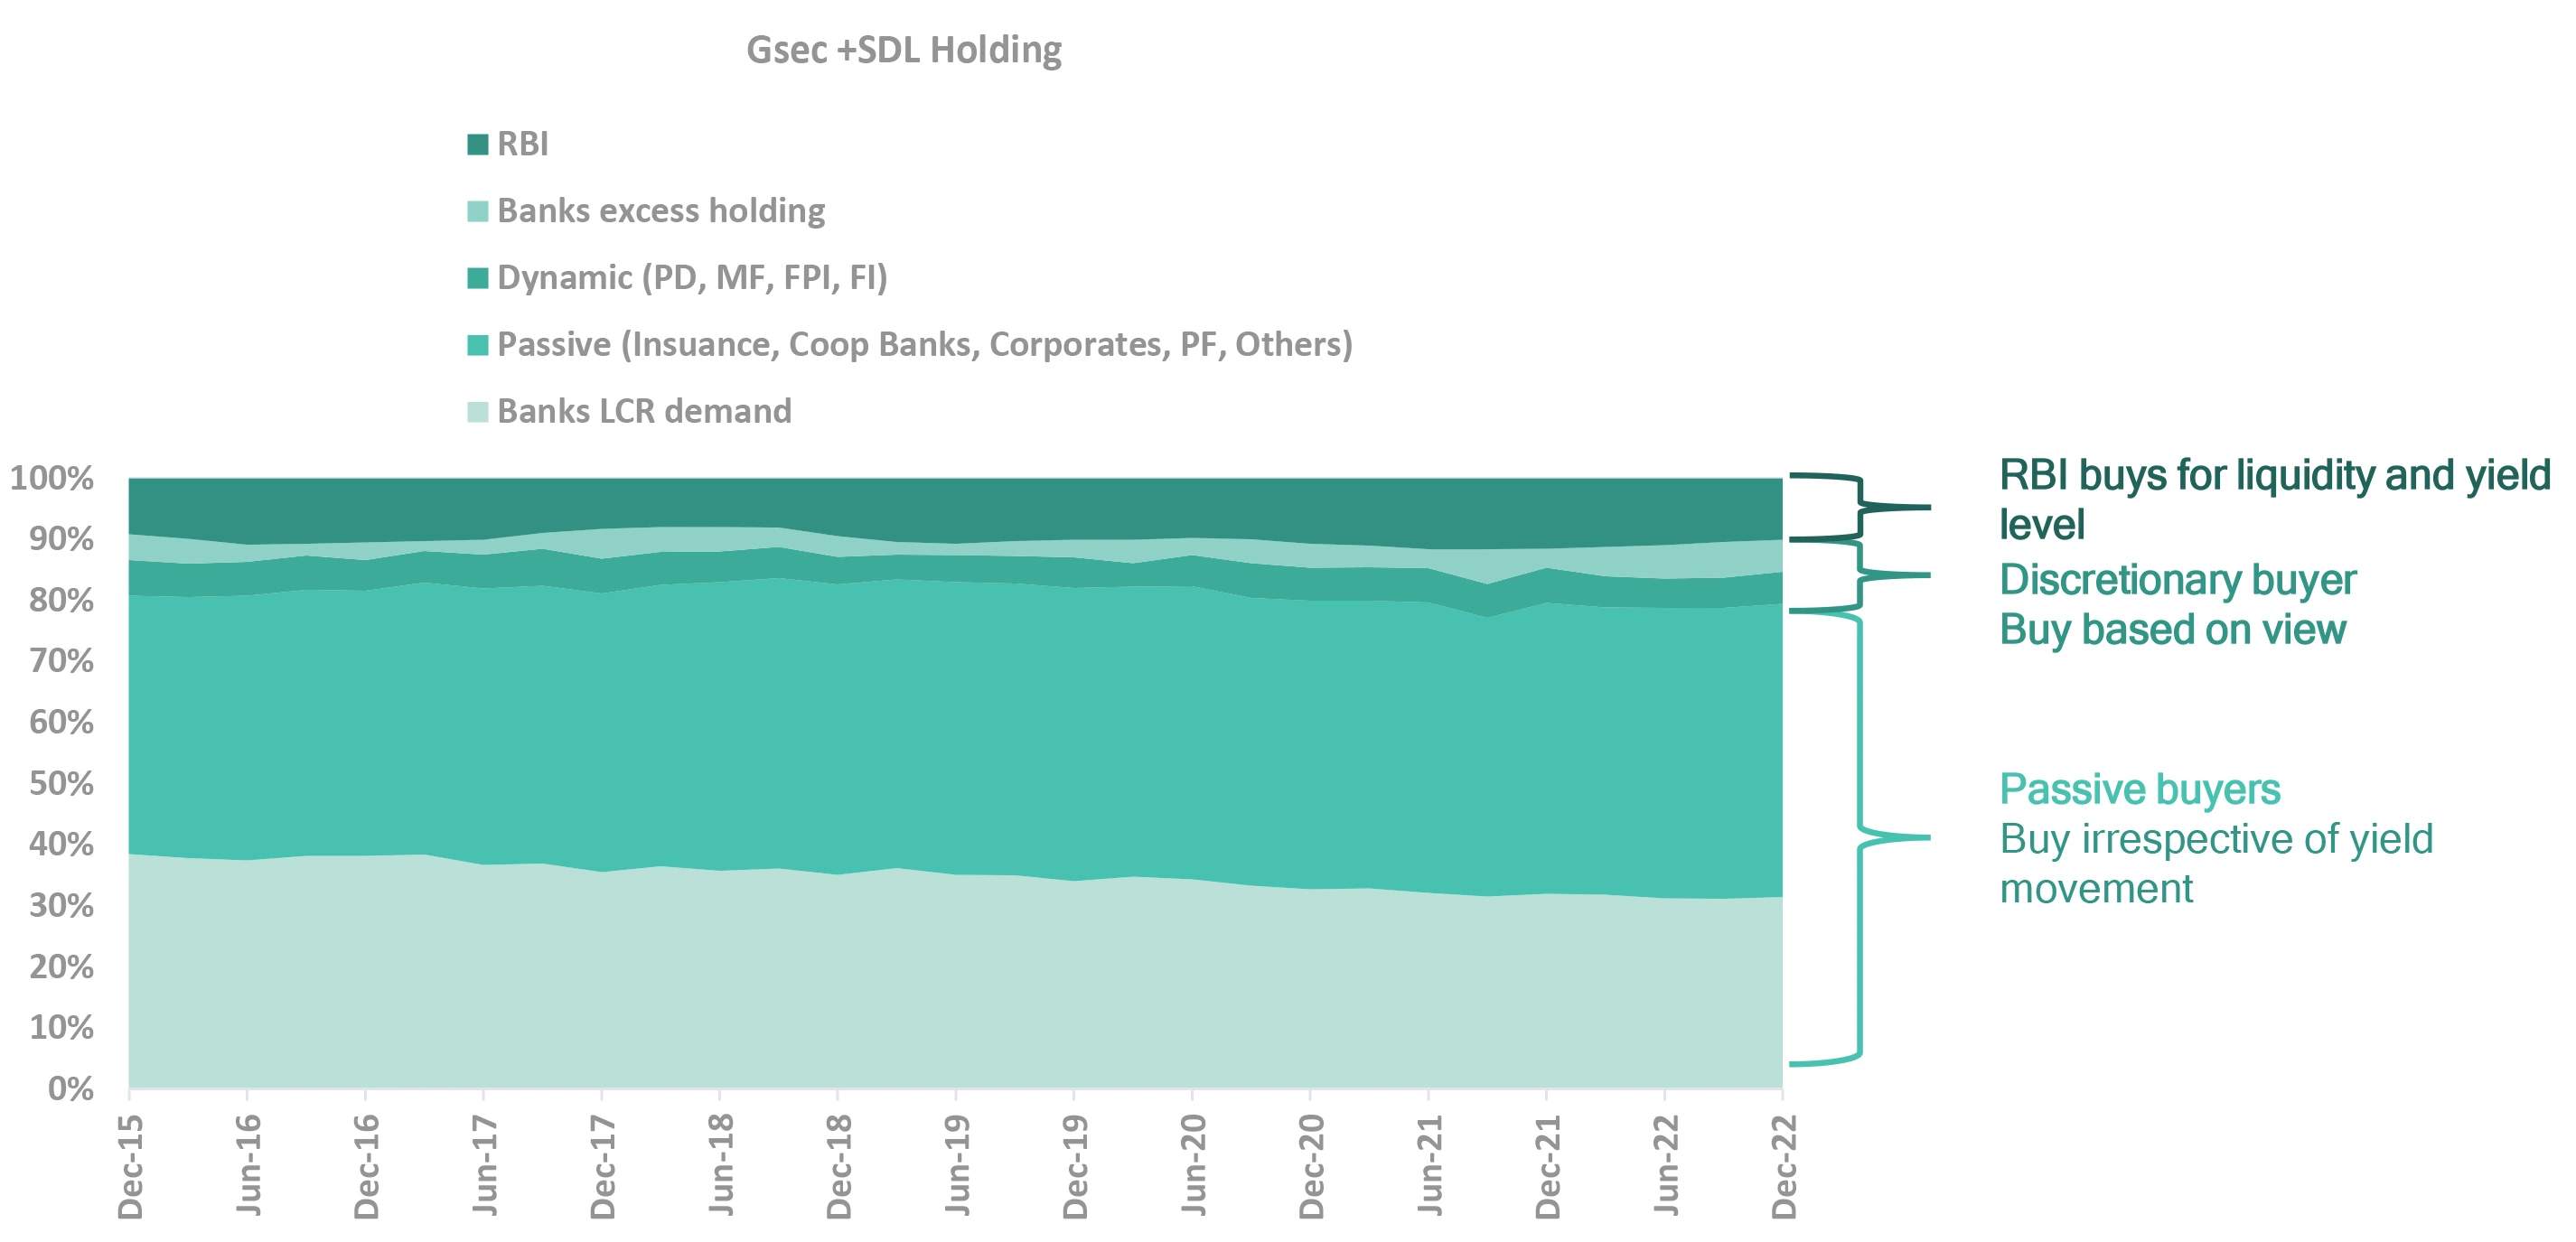
It is reflected in demand/supply mismatch
Only small part of bond buyers are
discretionary buyers.
They drive yields.
Supply fluctuations is borne by these
buyers.
Gsec market still driven by lumpy institutions
Takeaway:
Increase in supply impacts the discretionary buying. Banks excess holding, passive buyers have been absorbing the supply
Source – DBIE LCR – Liquidity Coverage Ratio; SDL – State Development Loans; PF – Provident Funds; PD – Primary Dealerships; MF – Mutual Funds; FPI – Foreign Portfolio Investors; FI – Financial Institutions; RBI: Reserve Bank of India; G-Sec: Government Securities
Comfortable supply/demand dynamics for
FY24
But it will be bumpy ride
Last 3 months demand/supply has been
rosy
(latent purchases, low SDL issuances)
May see small Bumps ahead!
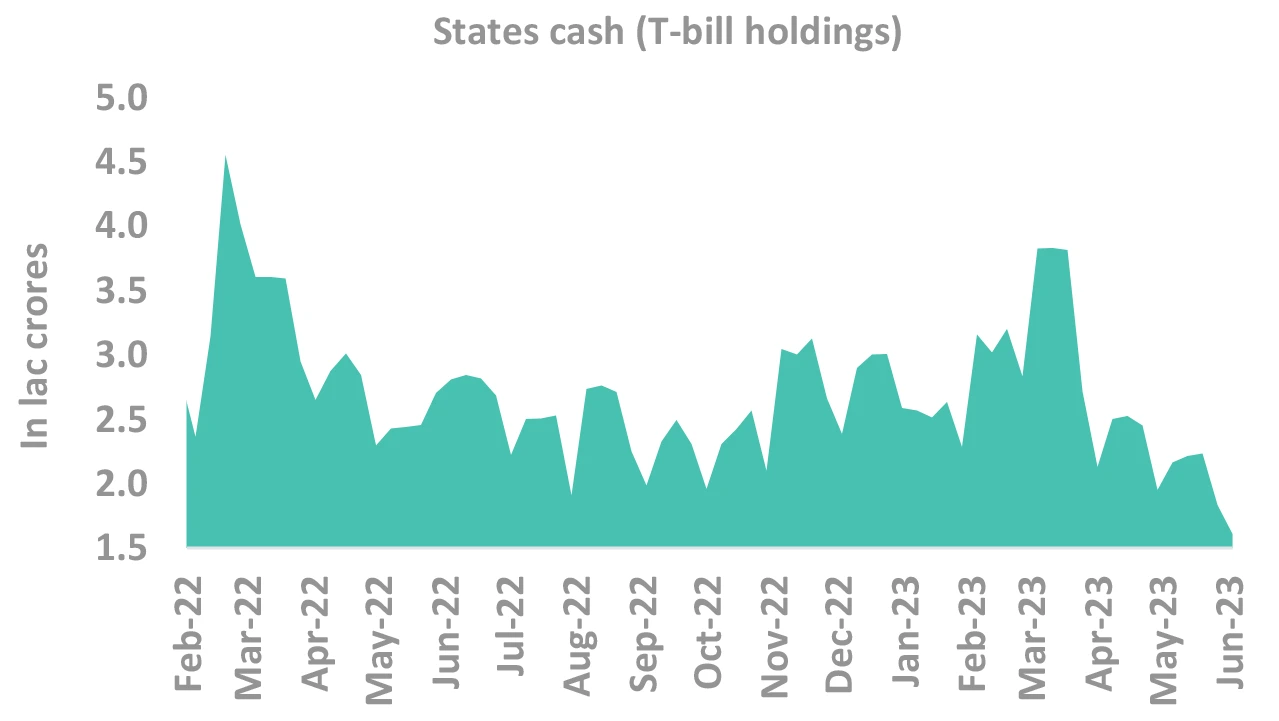
SDL supply picks ups… will it impact yields
-
SDL borrowing has increased gradually in FY24
- Apr’23 borrowing 60% lower than calendar
- May’ 23 higher than calendar (Rs 3k cr)
- June’ 23 borrowing to be even higher than calendar
-
Lower Cash to marginally increase SDL issuance
- The Annual states borrowing will not be large (2.6% of GSDP assumption)
- Limited excess supply, even in worse of times.
-
SDL issuance impact will be limited
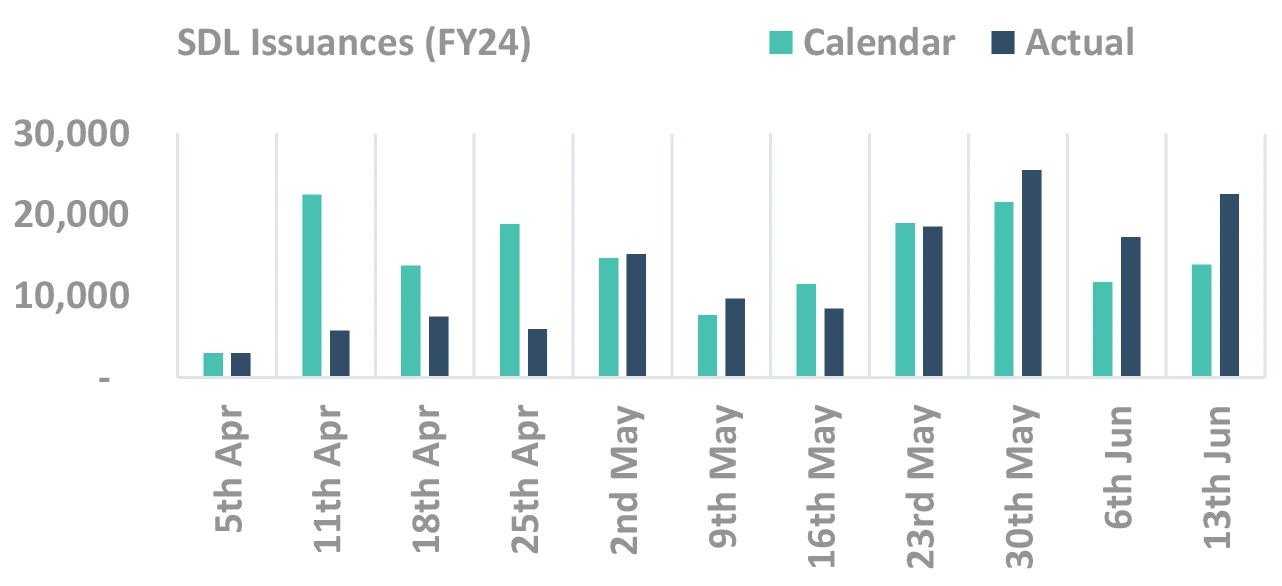
Takeaway:
SDL supply picking up with drop in cash balance, albeit may remain muted in FY24
Source – DBIE, RBI T-bill: Treasury Bill; SDL: State Development Loans; GSDP: Gross State Domestic Product
Banks have already bought a significantly!
-
Banks SLR holdings has risen sharply
- Part of SLR holding (~1%) is hedges of FRA & TRS, and not naked holdings
- Yet, SLR holding remains high
-
SLR ratio may reduce, still absolute demand will absorb supply for FY24
- Natural NDTL growth will still lead to demand
-
But banks have bought nearly Rs. 1.5 lacs in Q1
- Rest of the year demand will be muted
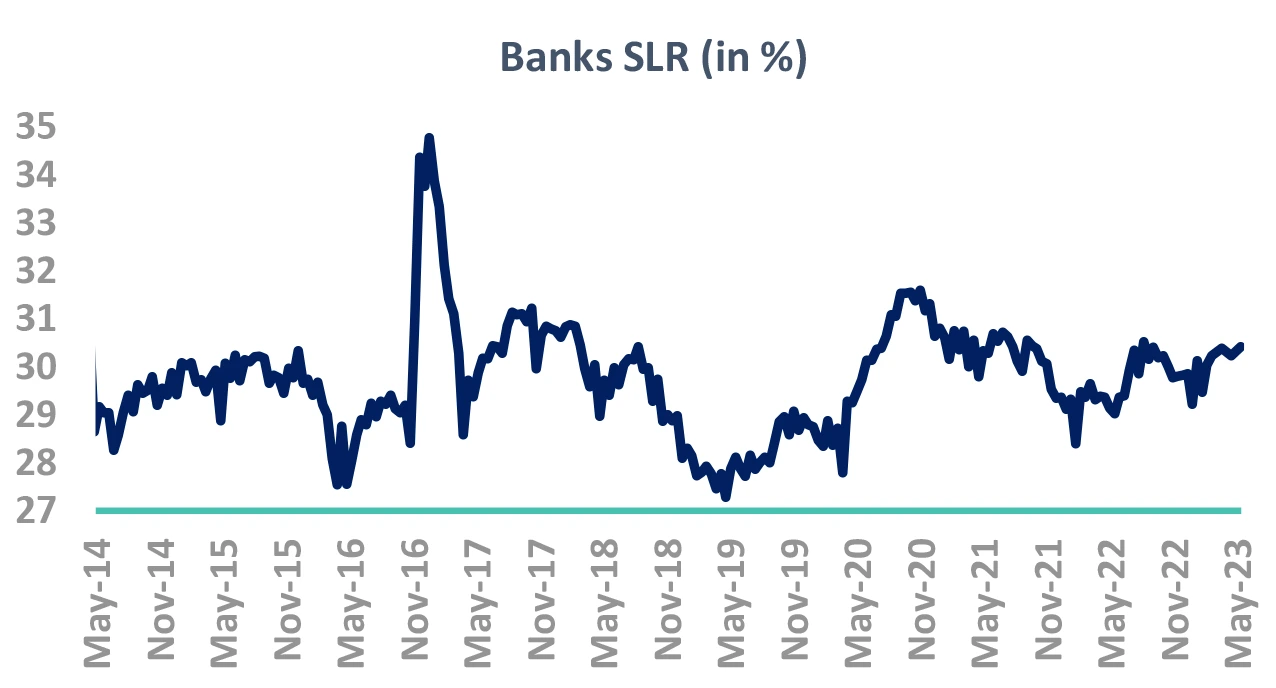
Takeaway:
Banks’ probably lesser demand in future to be negative.
Source – Bloomberg, DBIE, Internal OMO – Open Market Operations, SLR – Statutory Liquidity Ratio; G-Sec – Government Securities; RBI: Reserve Bank of India; FRA: Forward Rate Agreement; TRS: Total Return Swap
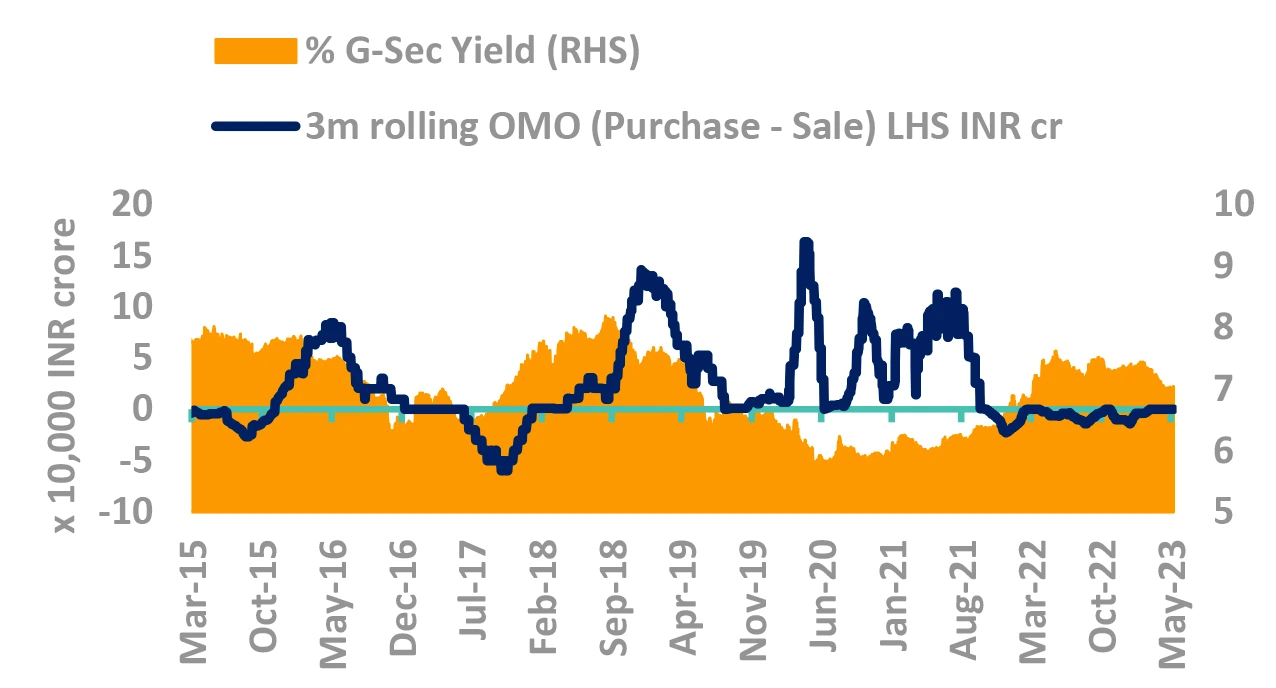
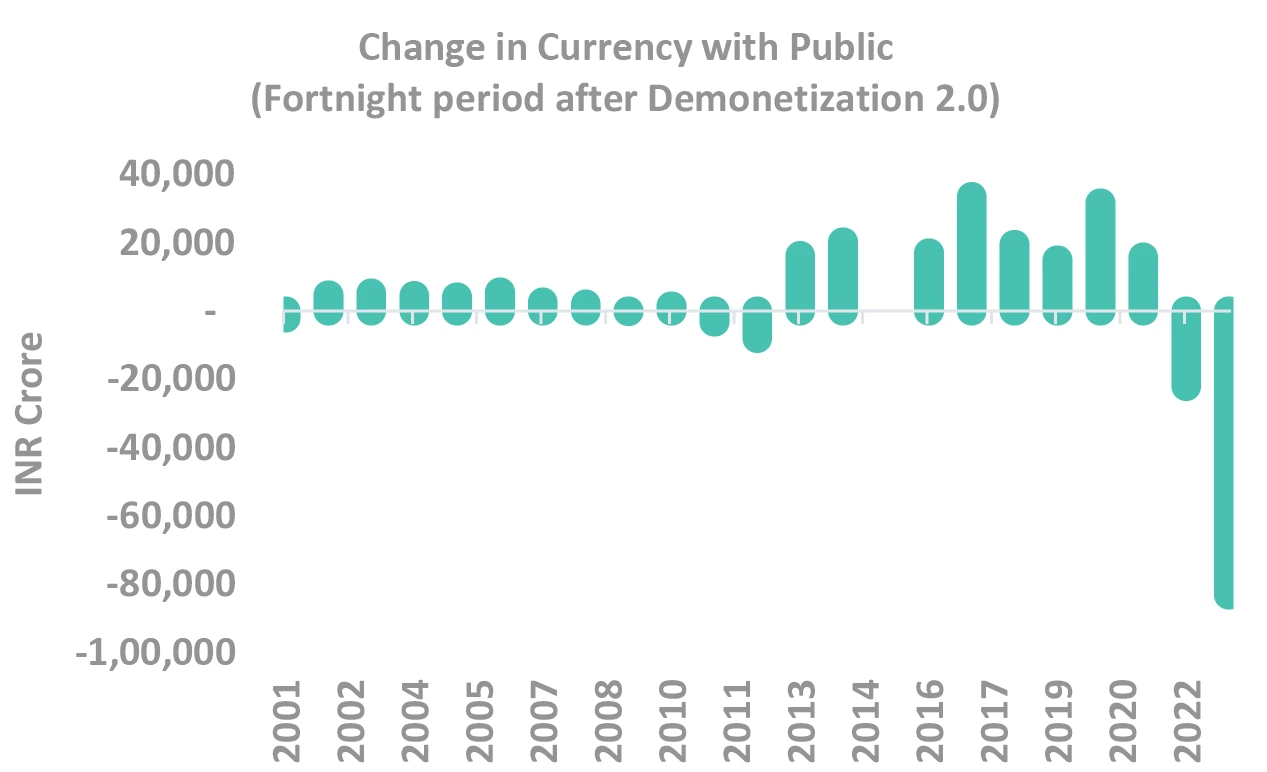
Large liquidity infusion delays OMO or CRR
-
RBI announced dividend of Rs. 87K cr
- Surpassing budget estimates of rs. 48K cr
-
Liquidity to remain in surplus for few months
- Due to seasonality of liquidity
- Seasonal infusion of Rs. 45-60K cr as we enter a period of reversal in CIC until Q3FY24
-
OMO/CRR possibility pushed to Q4/Q3
- Liquidity infusion will not be needed
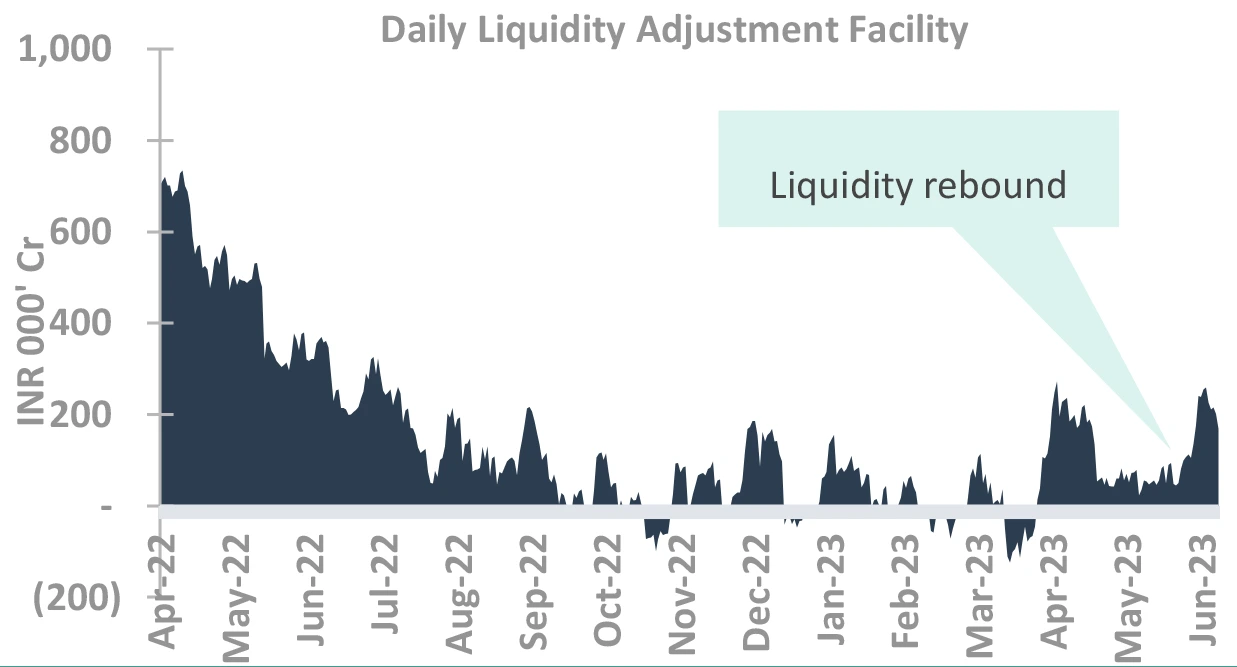
Takeaway:
Chances of OMO or CRR pushed back to at least Q3, probably Q4
Source – Bloomberg, Internal OMO – Open Market Operations; CRR: Cash Reserve Ratio; CIC: Currency in Circulation; RBI: Reserve Bank of India
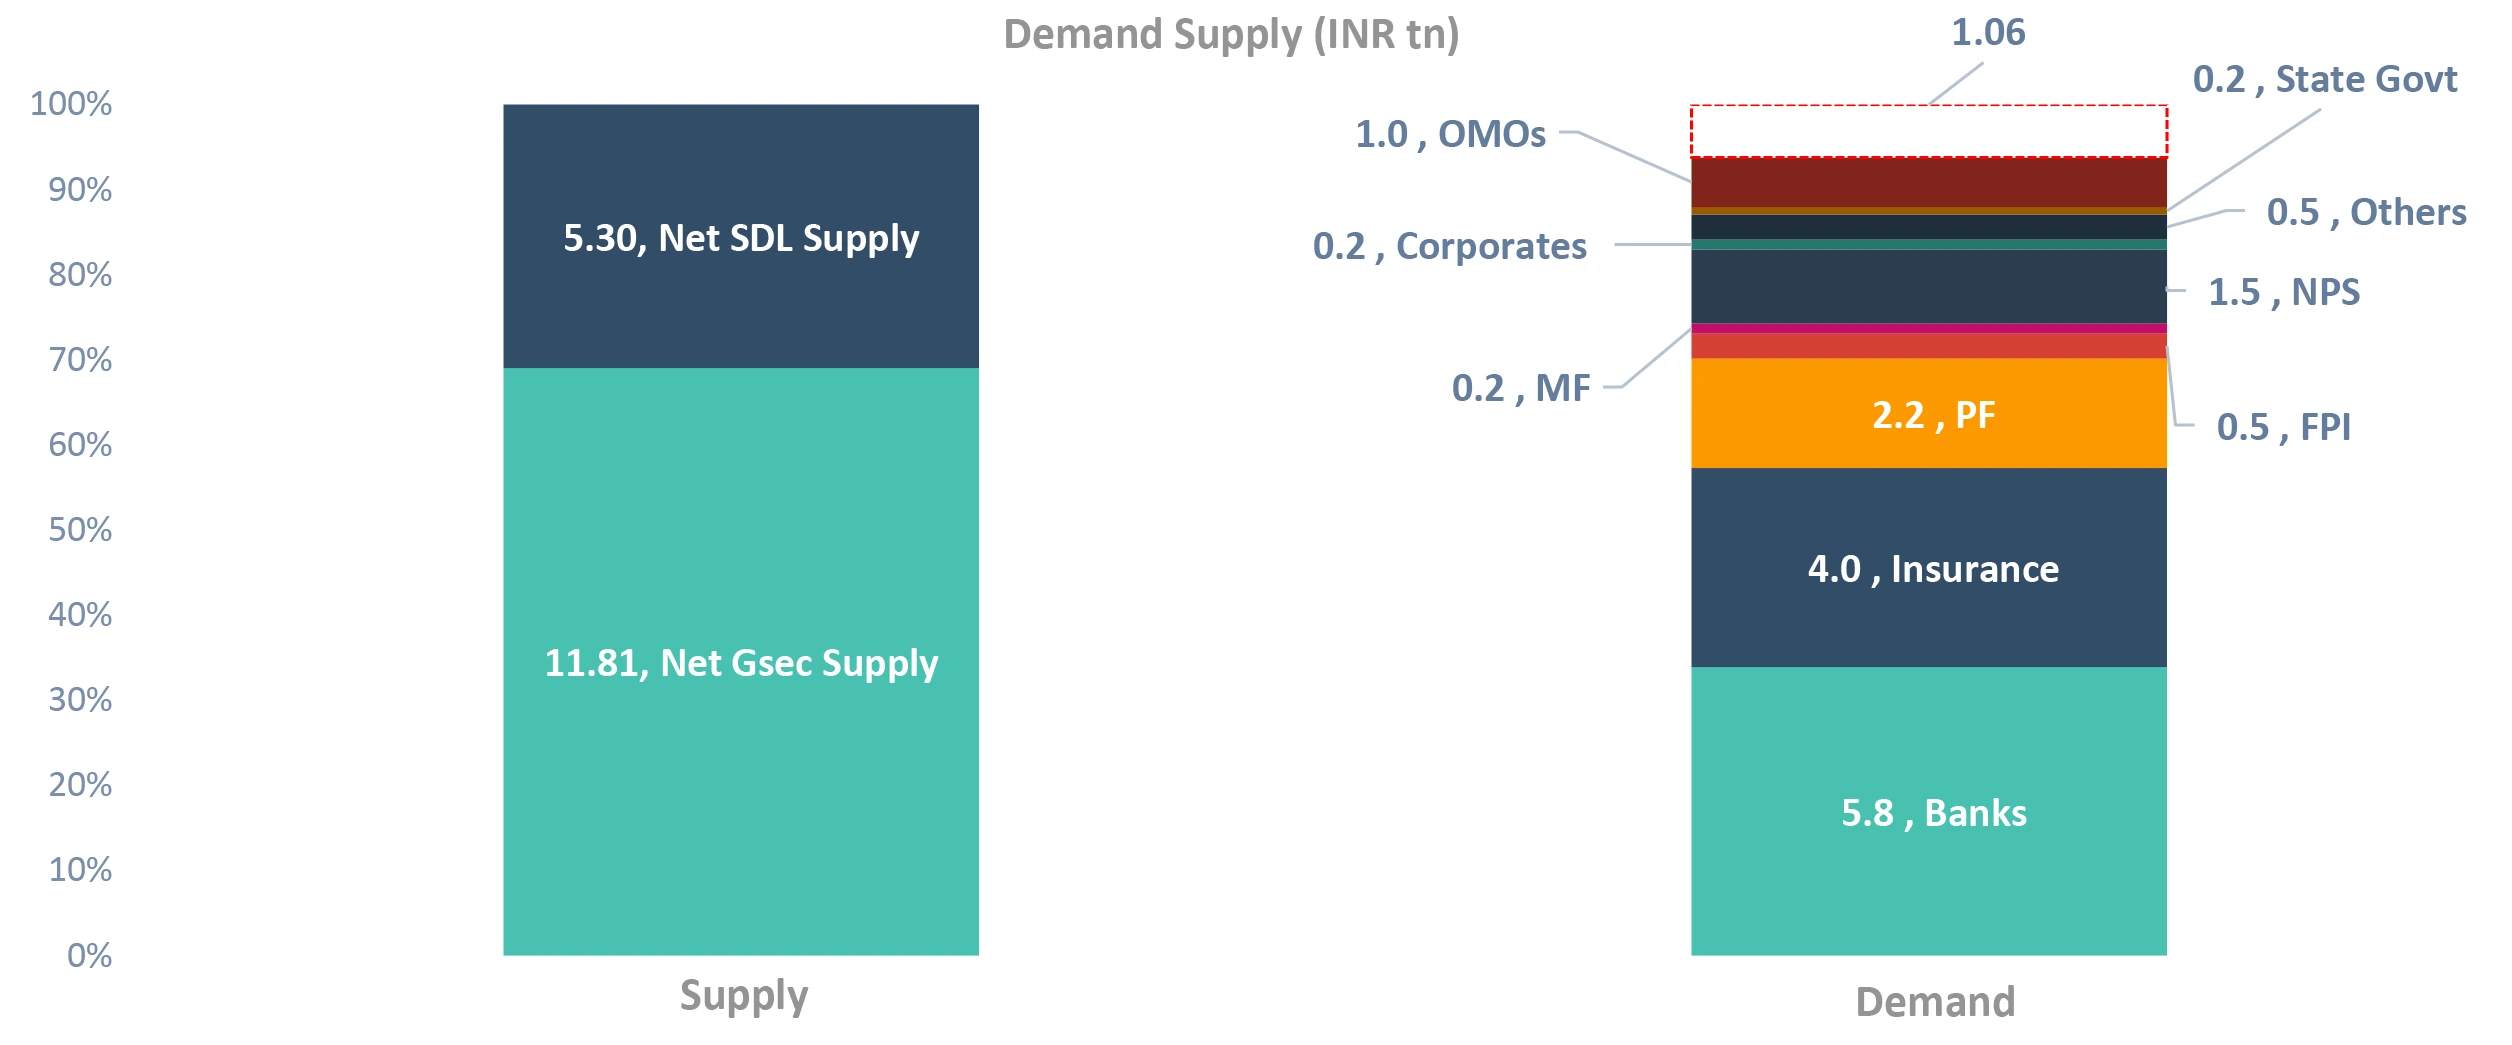
How much is the excess supply
Takeaway:
Estimated excess supply of INR 1.06 tn not very significant. NPS may grow at 20% (we have taken 13%), Banks may sustain current SLR ratio of 30.5% (we have taken 30%)
Source – Internal G-Sec: Government Securities; OMO: Open Market Operation; RBI: Reserve Bank of India; FPI: Foreign Portfolio Investment; NPS: National Pension System; MF: Mutual Fund; SDL: State Development Loans; SLR: Statutory Liquidity Ratio; PF: Provident Fund; EPFO: Employees’ Provident Fund Organisation
While RBI tracks FOMC, but
should Indian yields track
US yields?
No. US yields will create noise,
not trend.
Indian yields – Dancing on its own chords
-
FOMC rate at 5.25% - more hikes at play?
- Labor data continues to remain strong
- Tails risks of services inflation remaining sticky
-
Are spreads of US Treasury and Indian Govt. Bonds low?
- No, Bond yields difference mimics the inflation and policy rate differential.
- ✓ 10Y yields seem to have priced in the inflation spread
- No, Bond yields difference mimics the inflation and policy rate differential.
-
Even if US yields don’t fall, Indian yields may.
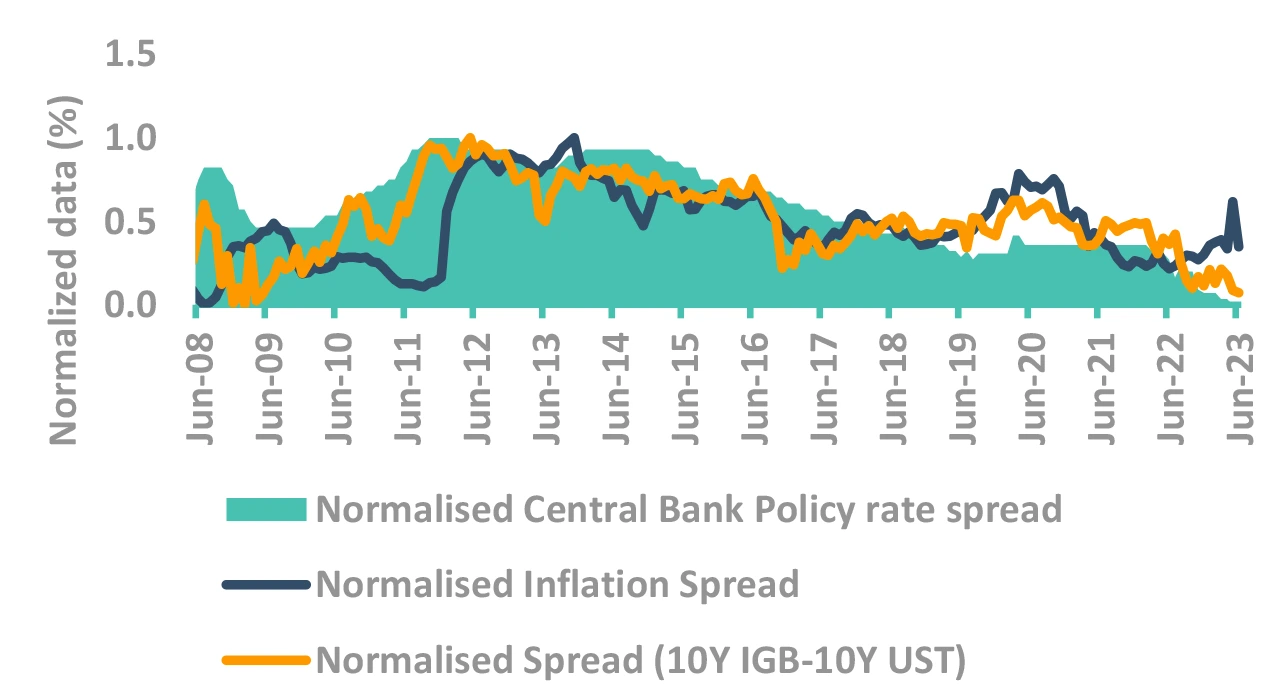
Takeaway:
India bond yields more driven by domestic factors.
Source – Bloomberg, Internal Fed: Federal Reserve; CPI: Consumer Price Inflation; RBI: Reserve Bank of India; IGB: India Government Bond; FOMC: Federal Open Market Committee; UST: US Treasury
What else
that
can’t be bunched up
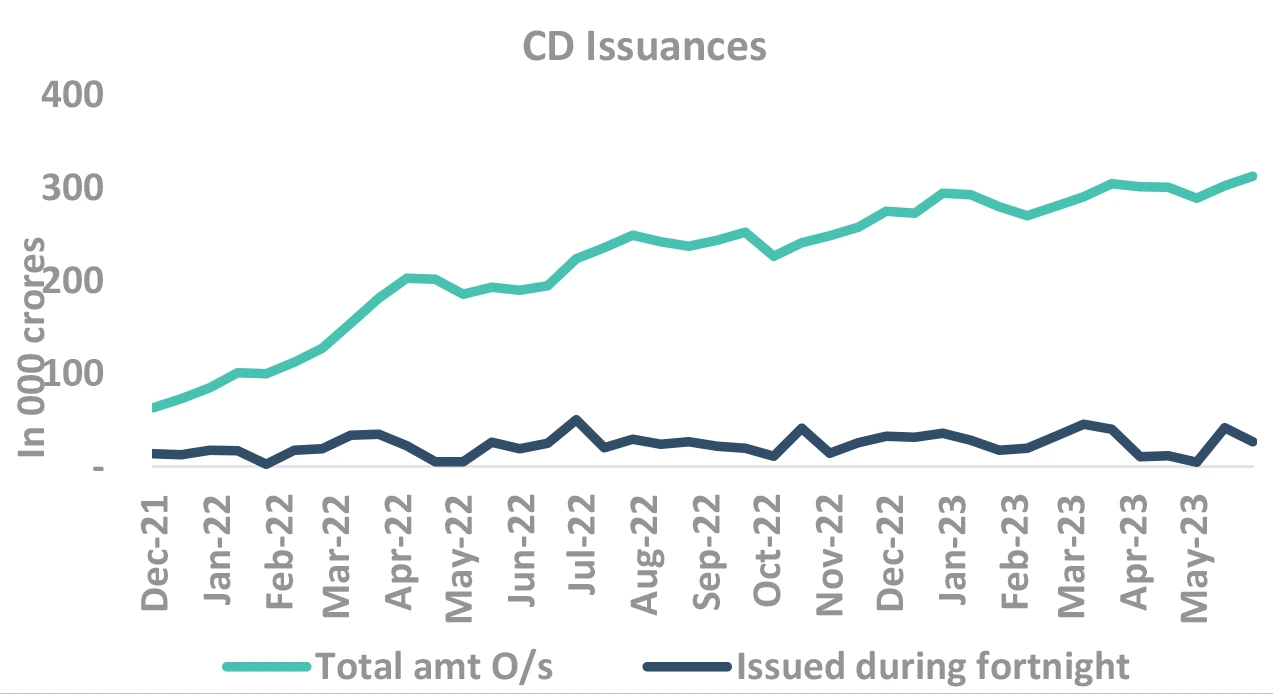
Supply-demand to be the key driver for short end yields
- Divergence between credit and deposit growth continues
- Increased issuances both CD and CP
- With higher maturities lined up in June, expect supply to remain high
- High T-bill supply kept the short end yields elevated; however with liquidity easing short end rates have come off
Source – Bloomberg, Internal CD: Certificate of Deposits; CP: Commercial Paper; T-bill: Treasury Bill
Term premia: Data dependent
-
If there is an extended pause (likely scenario)
- Premia is on a lower side… One may see volatility at these levels.
-
But if there is even one more hike (low probability)
- Premia should rise significantly – touching March levels
-
If there is short pause, followed by cut (low probability)
- In 2014/2018, the term premia reduced
- Both these instances led to rally in duration yields
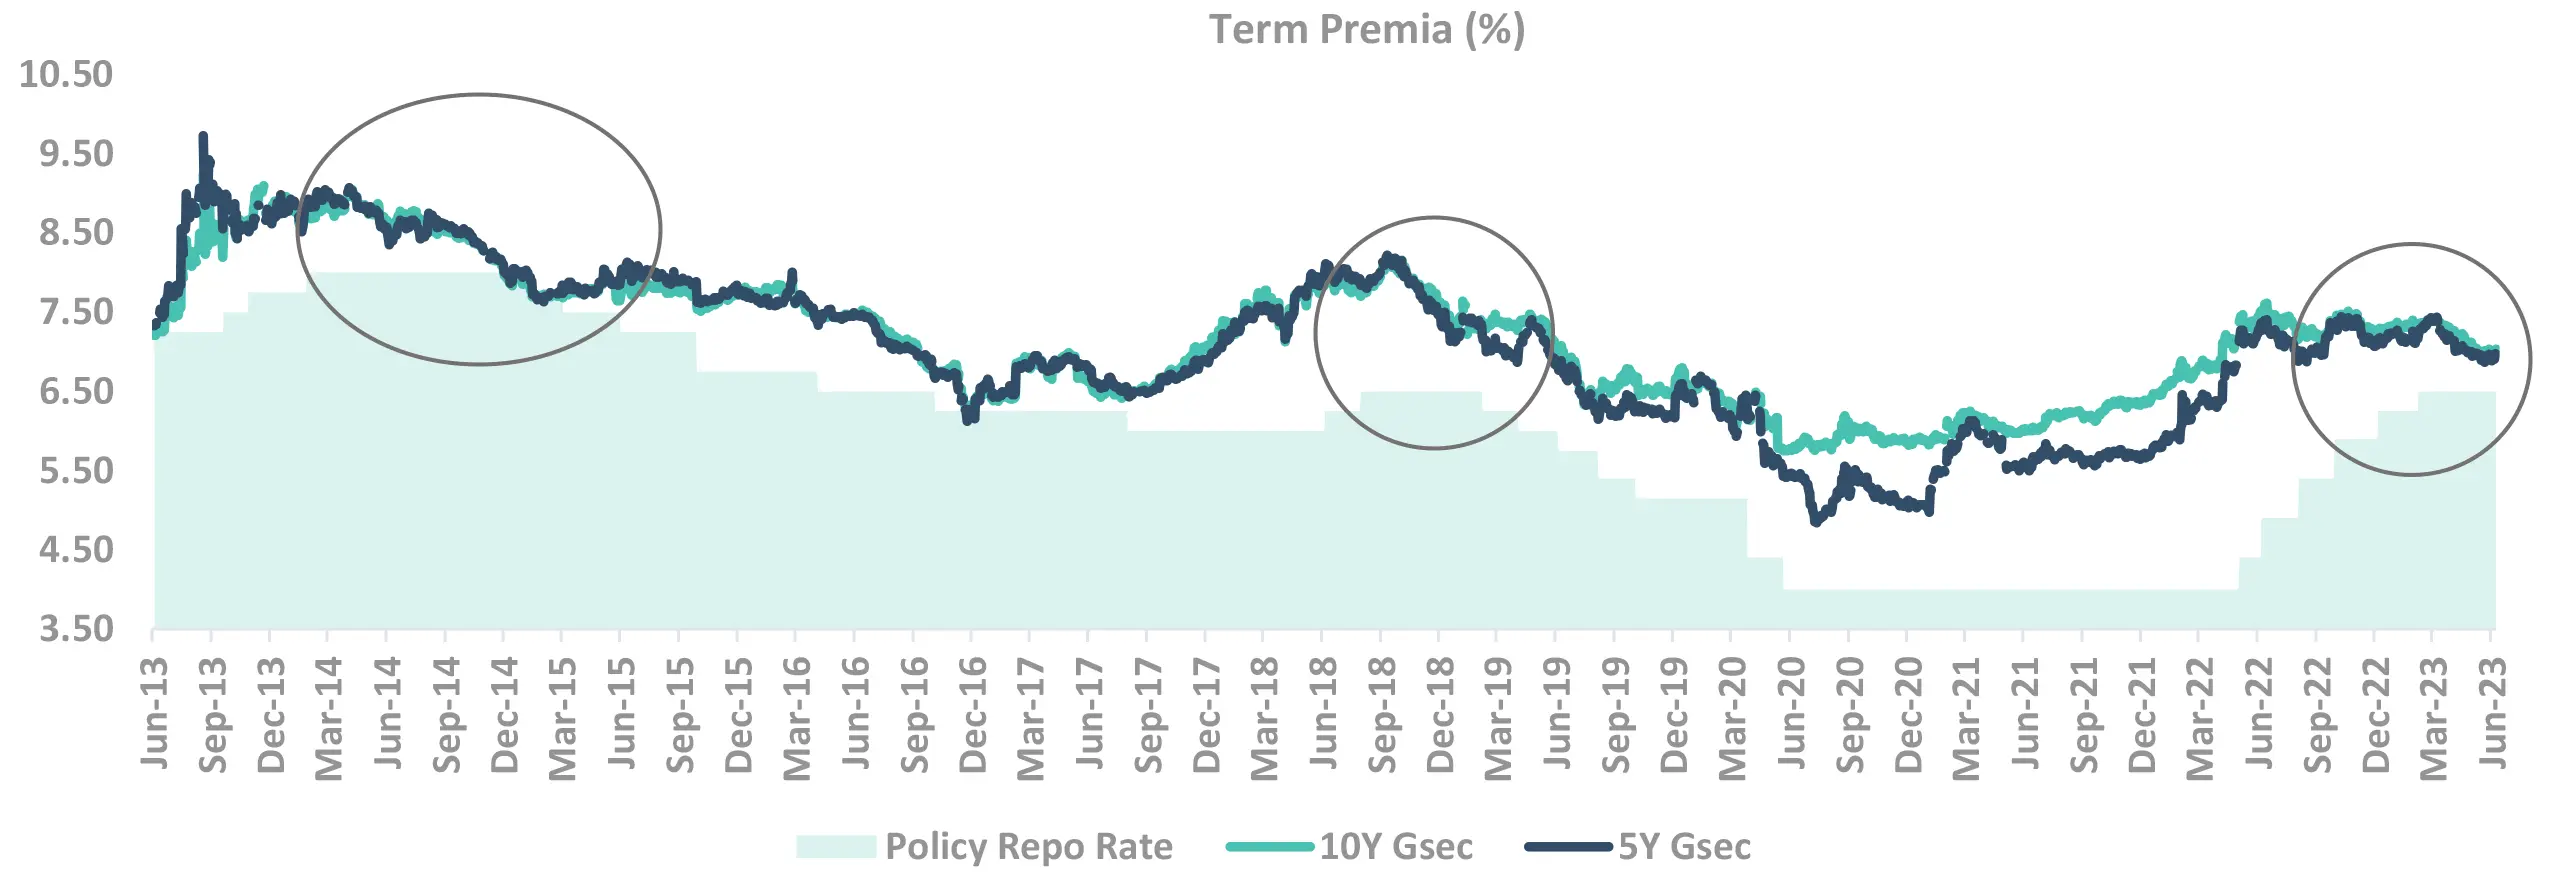
Takeaway:
Term Premia has been low historically in years of pause
Source – Bloomberg
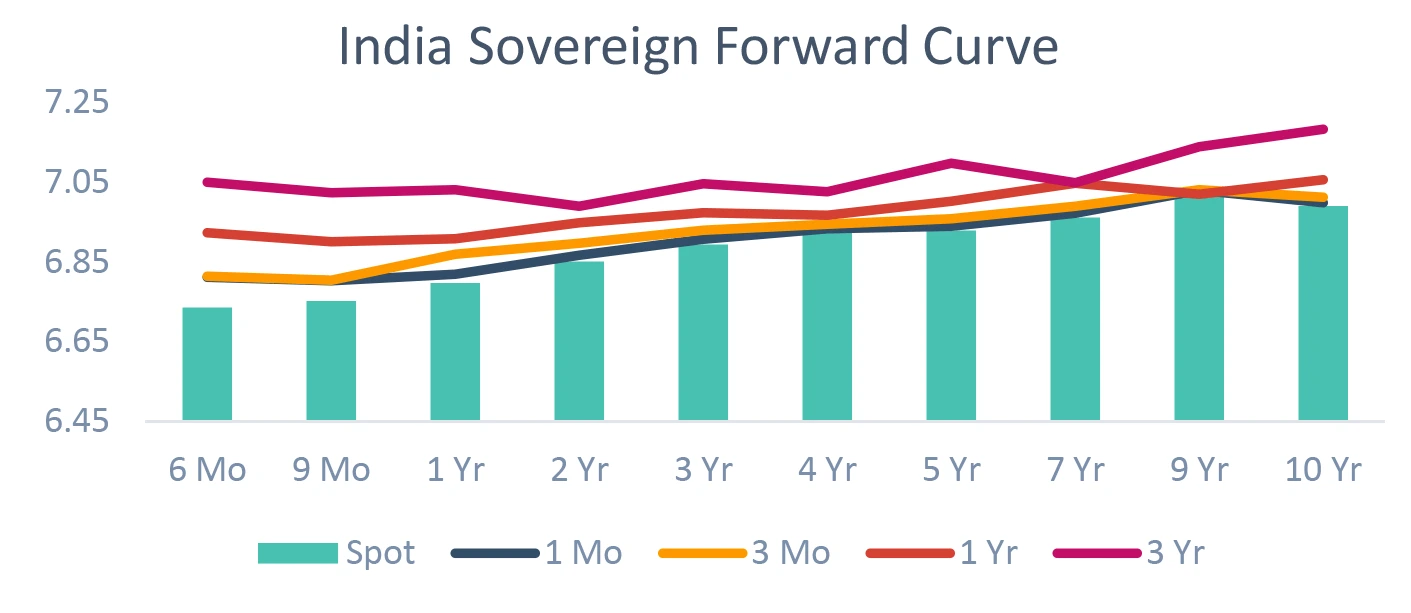
DSP Duration decision: How much of yield movement is priced in?
The chart shows how much expected yield fall/rise is already priced in the current curve.
Large gap between the current yield and forward yield shows that yield change is priced in – and thus yield change will not give capital gain/loss.
Similarly small gap means that the market is not pricing change in yields.
Done with our market view framework?
Now
Our Portfolio creation framework
DSP Portfolio Creation: Multi-step process
DSP Fixed Income Funds follow a defined methodology for fund portfolio construction
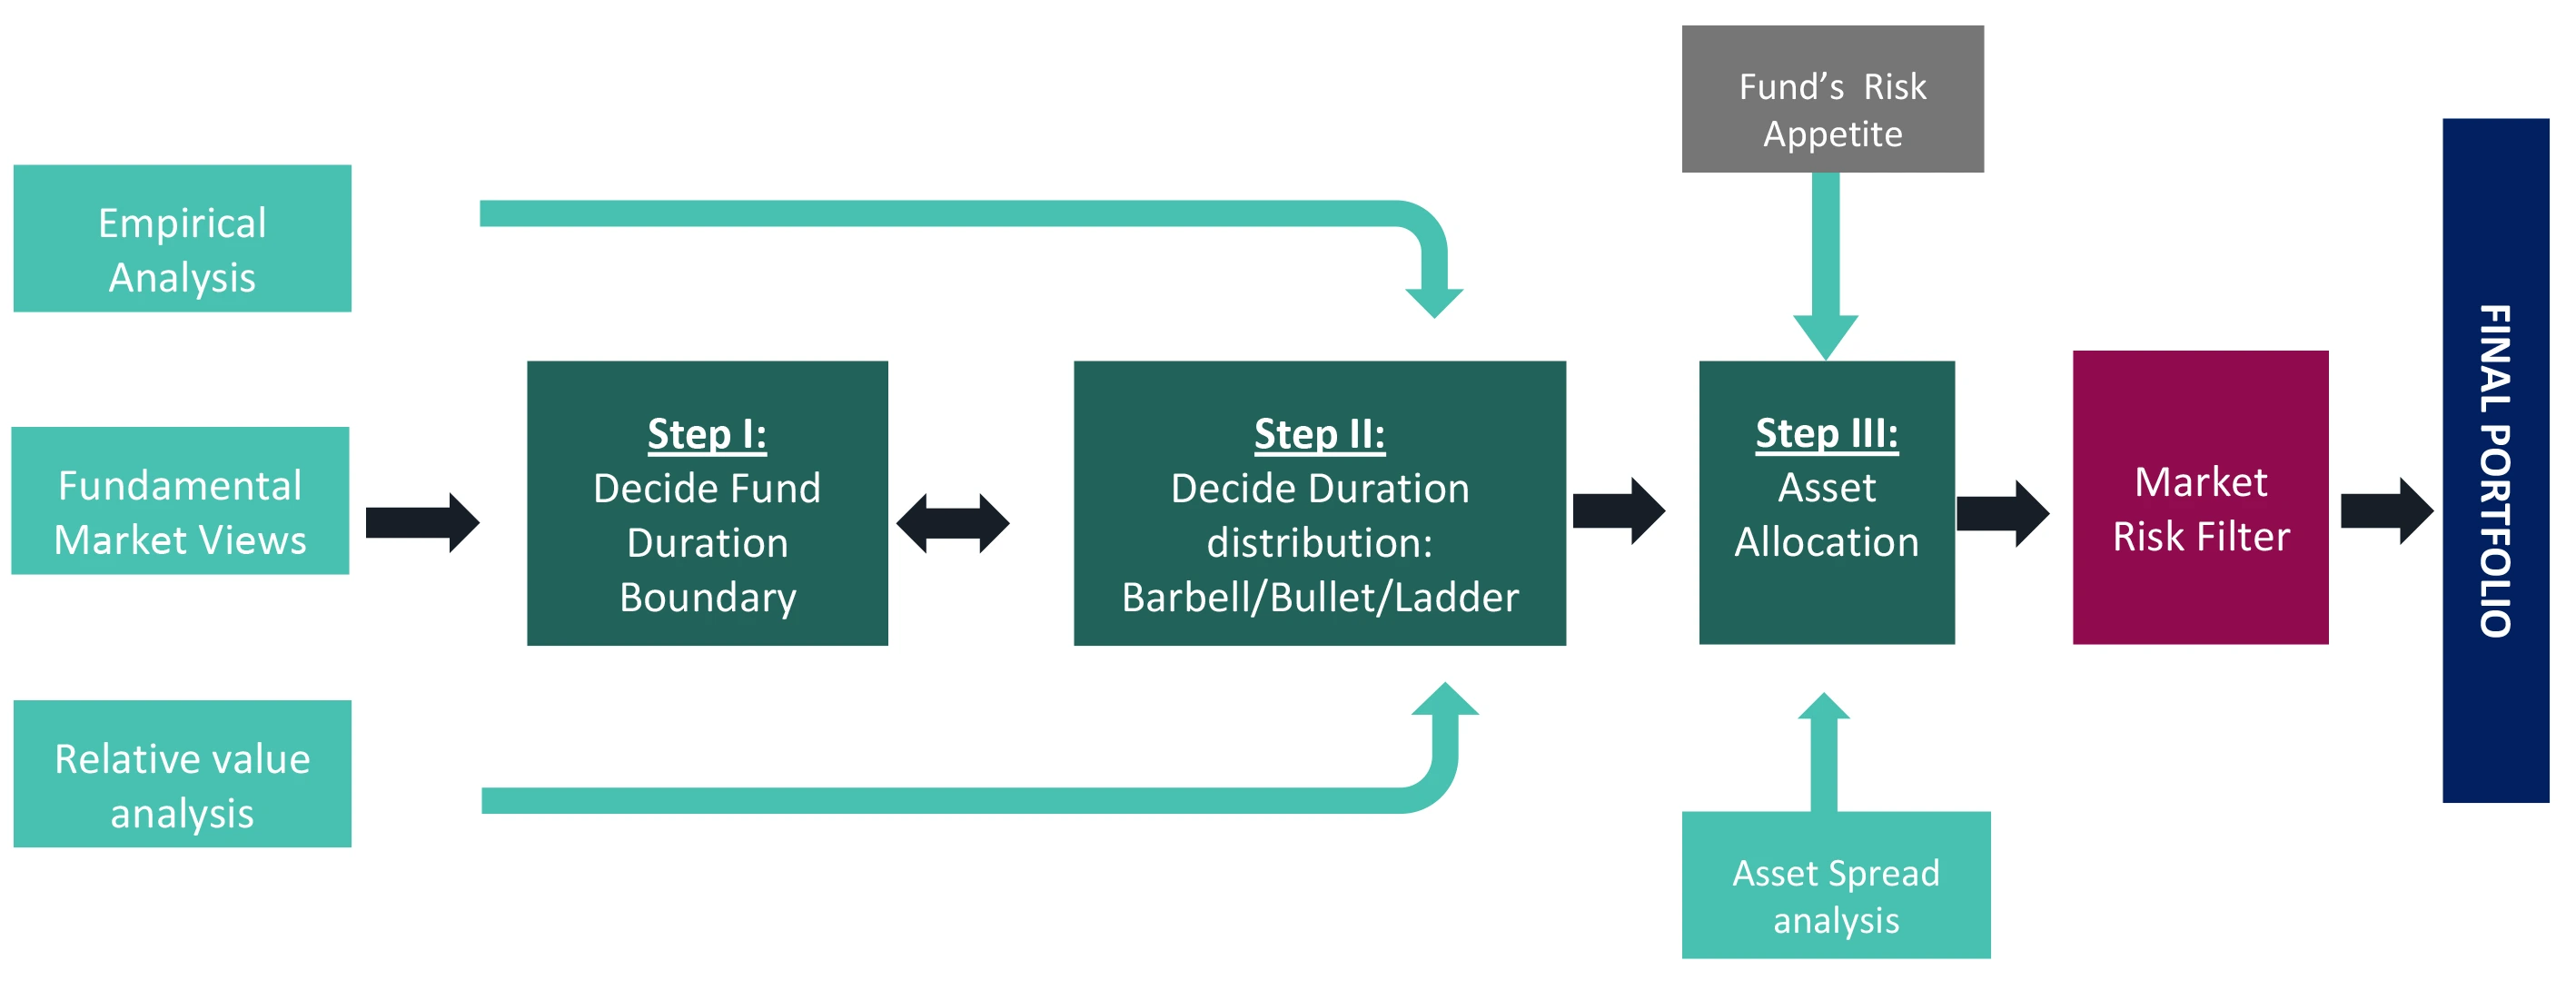
- We apply market risk filter which can help the Fund Managers not to take extreme risks. Thus, Value at Risk is limited by ensuring the positions are balanced.
Investment approach / framework/ strategy mentioned herein is currently followed & same may change in future depending on market conditions & other factors.
DSP Asset Allocation: Corporate bonds vs. Sovereign Bonds
-
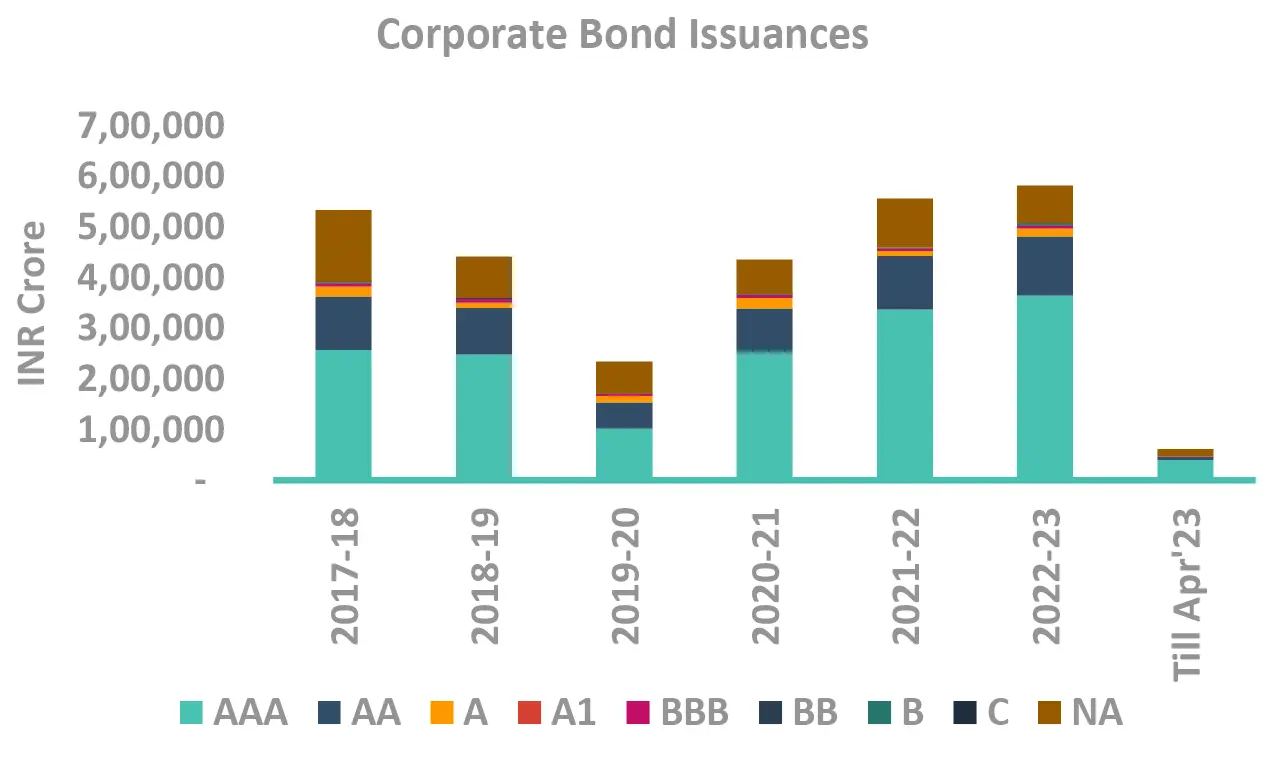
The corporate bond spread curve has flattened
- Corporate bond spreads near their long term average
- Corporate bonds spreads may widen due to
- Steady supply to continue
- Lower demand from MF due to taxation changes
- We prefer longer tenor corporate bonds as spreads will be supported:
- Lower supply after one large Pvt Bank and HFC merger
- Robust demand from non-discretionary buyers
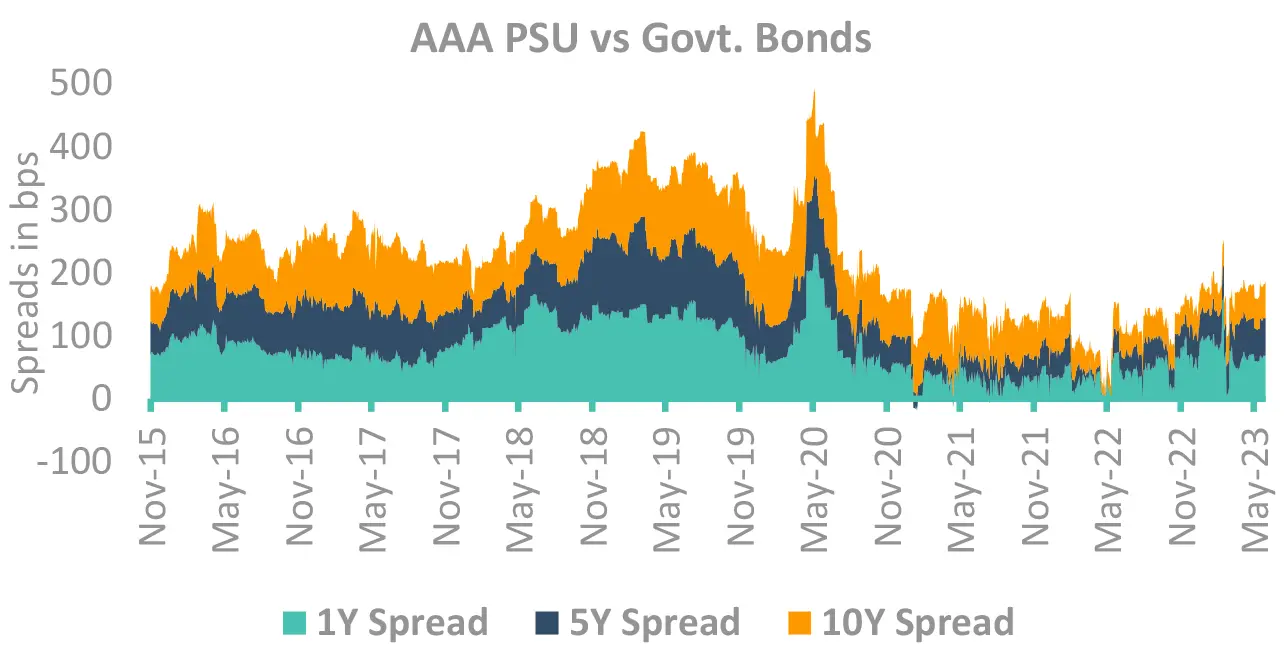
Takeaway:
Corporate bond spreads near their long term average, spread curve flat.
Source – Bloomberg, CCIL
Key Risks associated with investing in Fixed Income Schemes
Interest Rate Risk - When interest rates rise, bond prices fall, meaning the bonds you hold lose value. Interest rate movements are the major cause of price volatility in bond markets.
Credit risk - If you invest in corporate bonds, you take on credit risk in addition to interest rate risk. Credit risk is the possibility that an issuer could default on its debt obligation. If this happens, the investor may not receive the full value of their principal investment.
Market Liquidity risk - - Liquidity risk is the chance that an investor might want to sell a fixed income asset, but they’re unable to find a buyer.
Re-investment Risk - If the bonds are callable, the bond issuer reserves the right to “call” the bond before maturity and pay off the debt. That can lead to reinvestment risk especially in a falling interest rate scenario.
Rating Migration Risk - - If the credit rating agencies lower their ratings on a bond, the price of those bonds will fall.
Other Risks
Risk associated with
- floating rate securities
- derivatives
- transaction in units through stock exchange Mechanism
- investments in Securitized Assets
- Overseas Investments
- Real Estate Investment Trust (REIT) and Infrastructure Investment Trust (InvIT)
- investments in repo of corporate debt securities
- Imperfect Hedging using Interest Rate Futures
- investments in Perpetual Debt Instrument (PDI)
 Account Statement
  Capital Gain Statement
  Key Information Memorandum
  PAN Updation
  Register / Modify KYC Online
  Nominee Registration
  Email / Phone Updation
  OTM / eNACH Registration
  Guidelines for Incapacitated Investors
  FAQs
FAQs Reach us

