DSP Converse April 2024
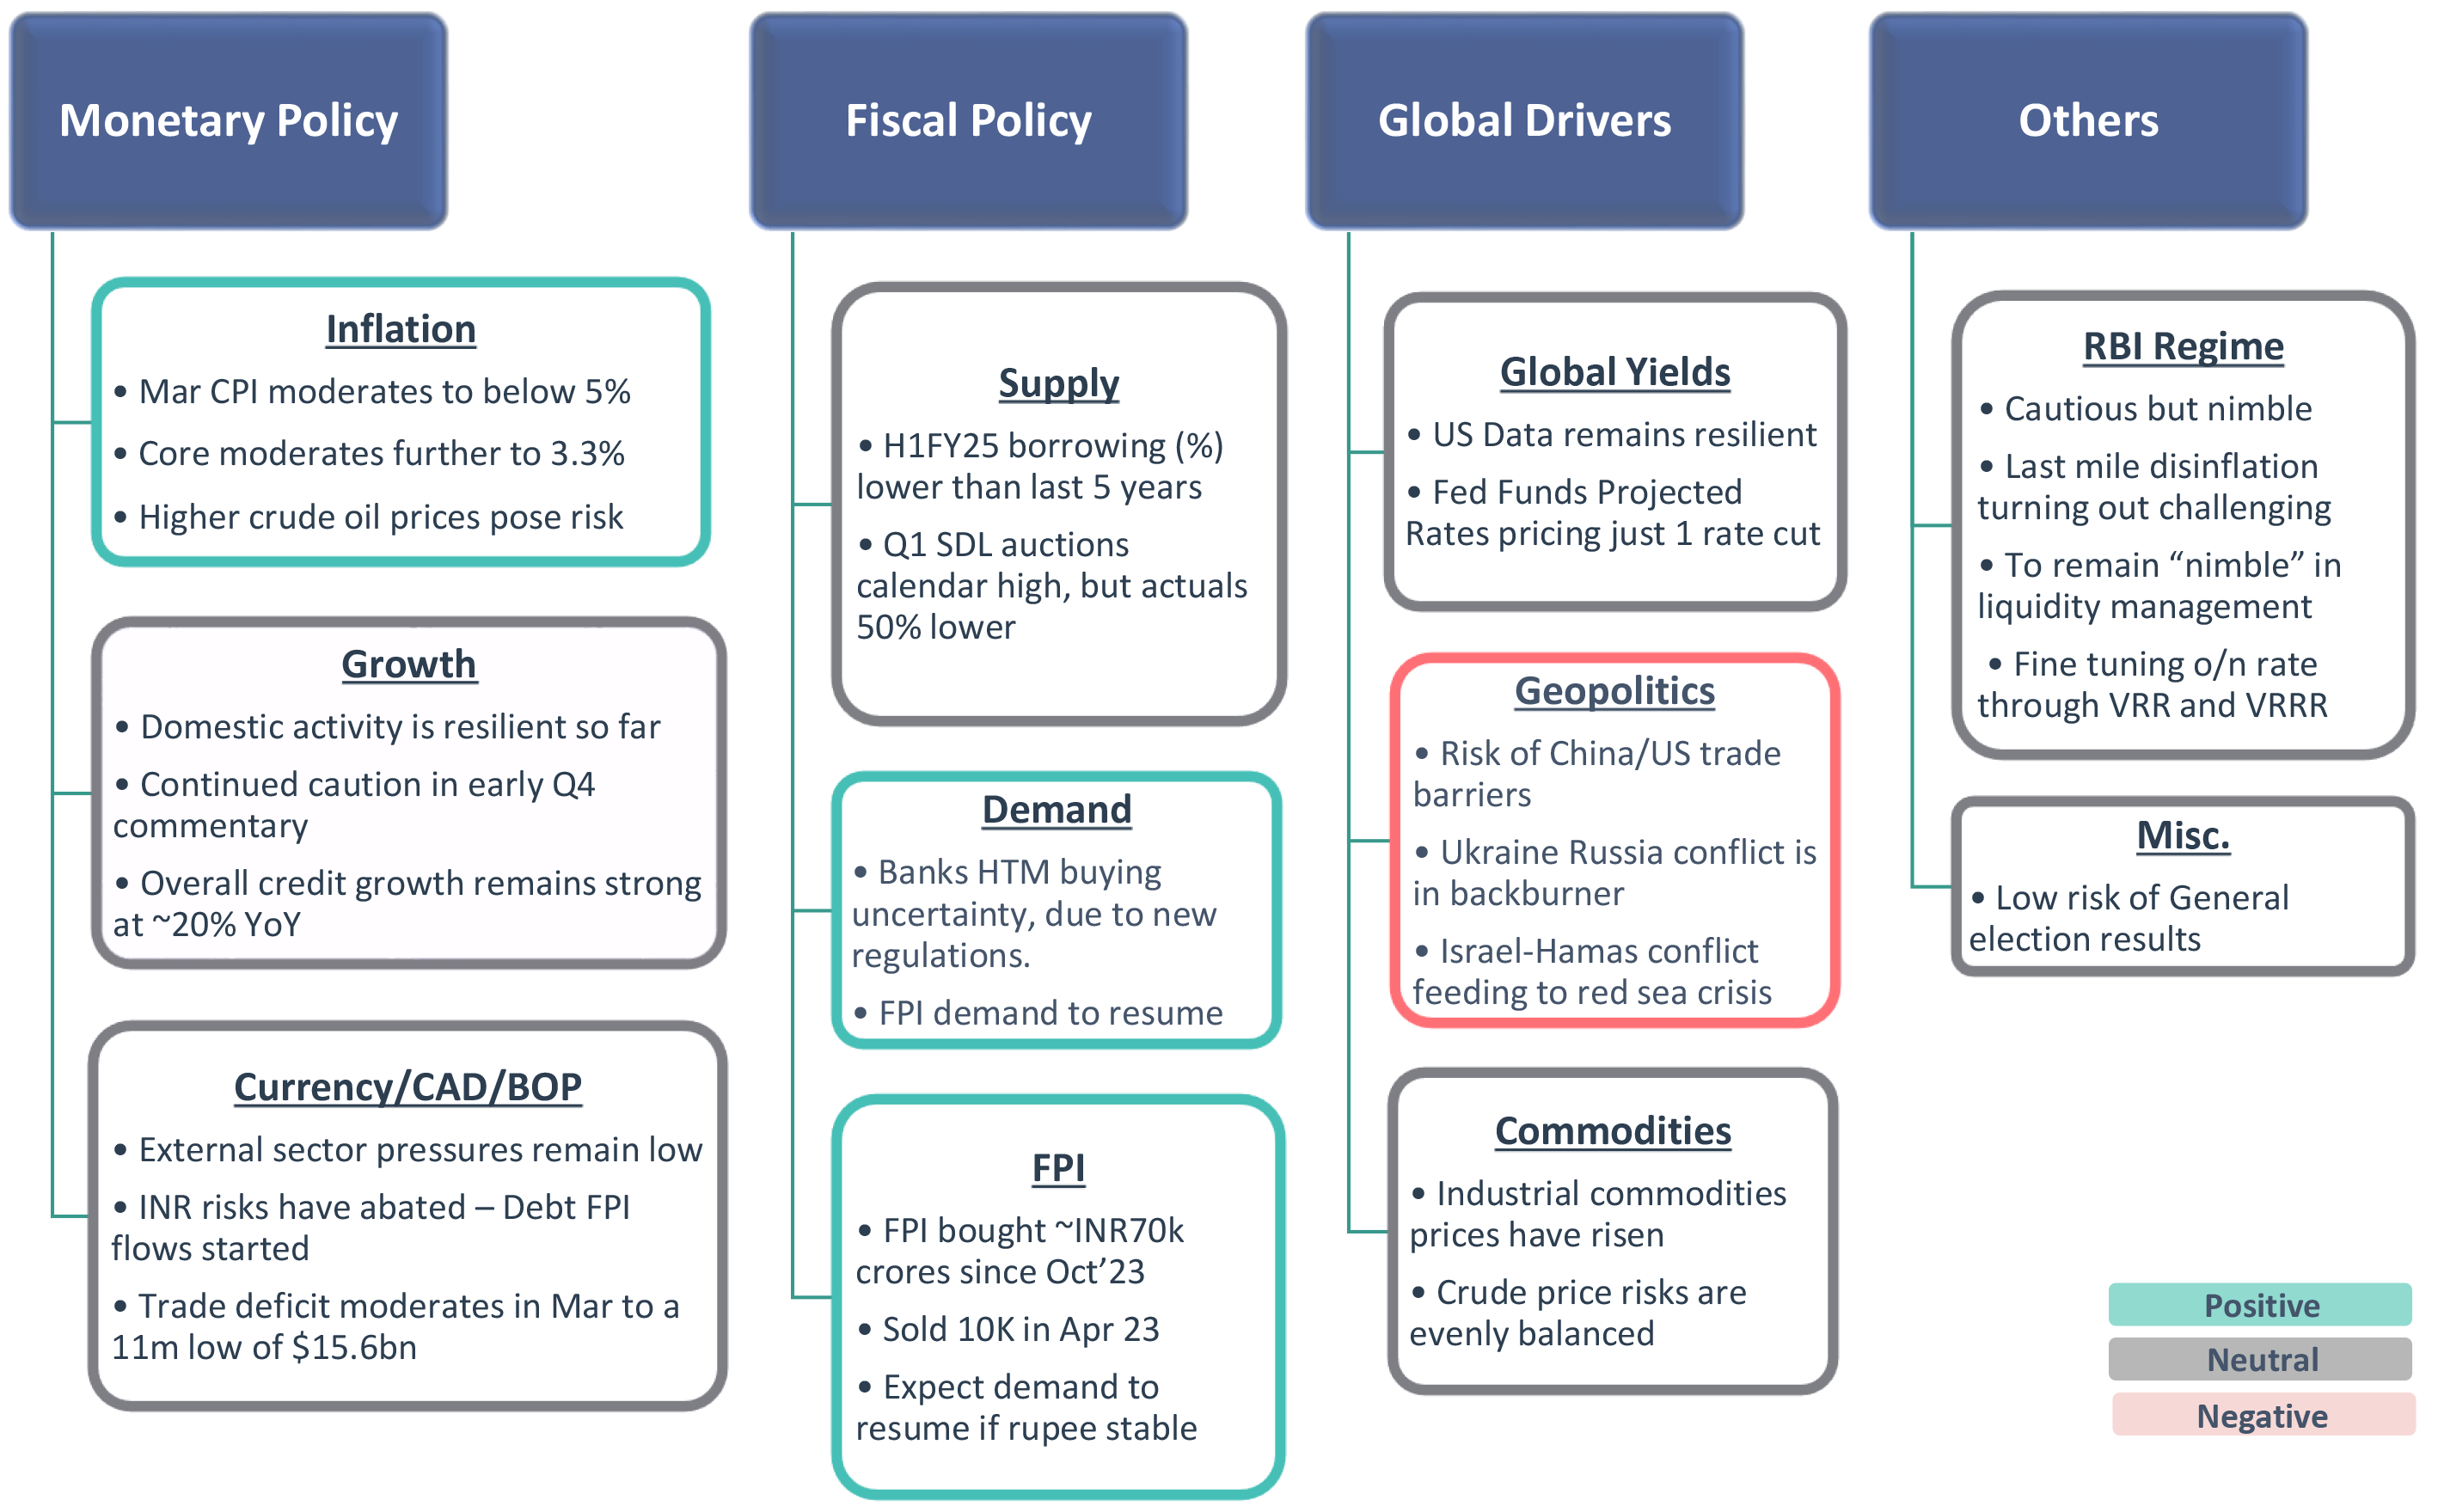
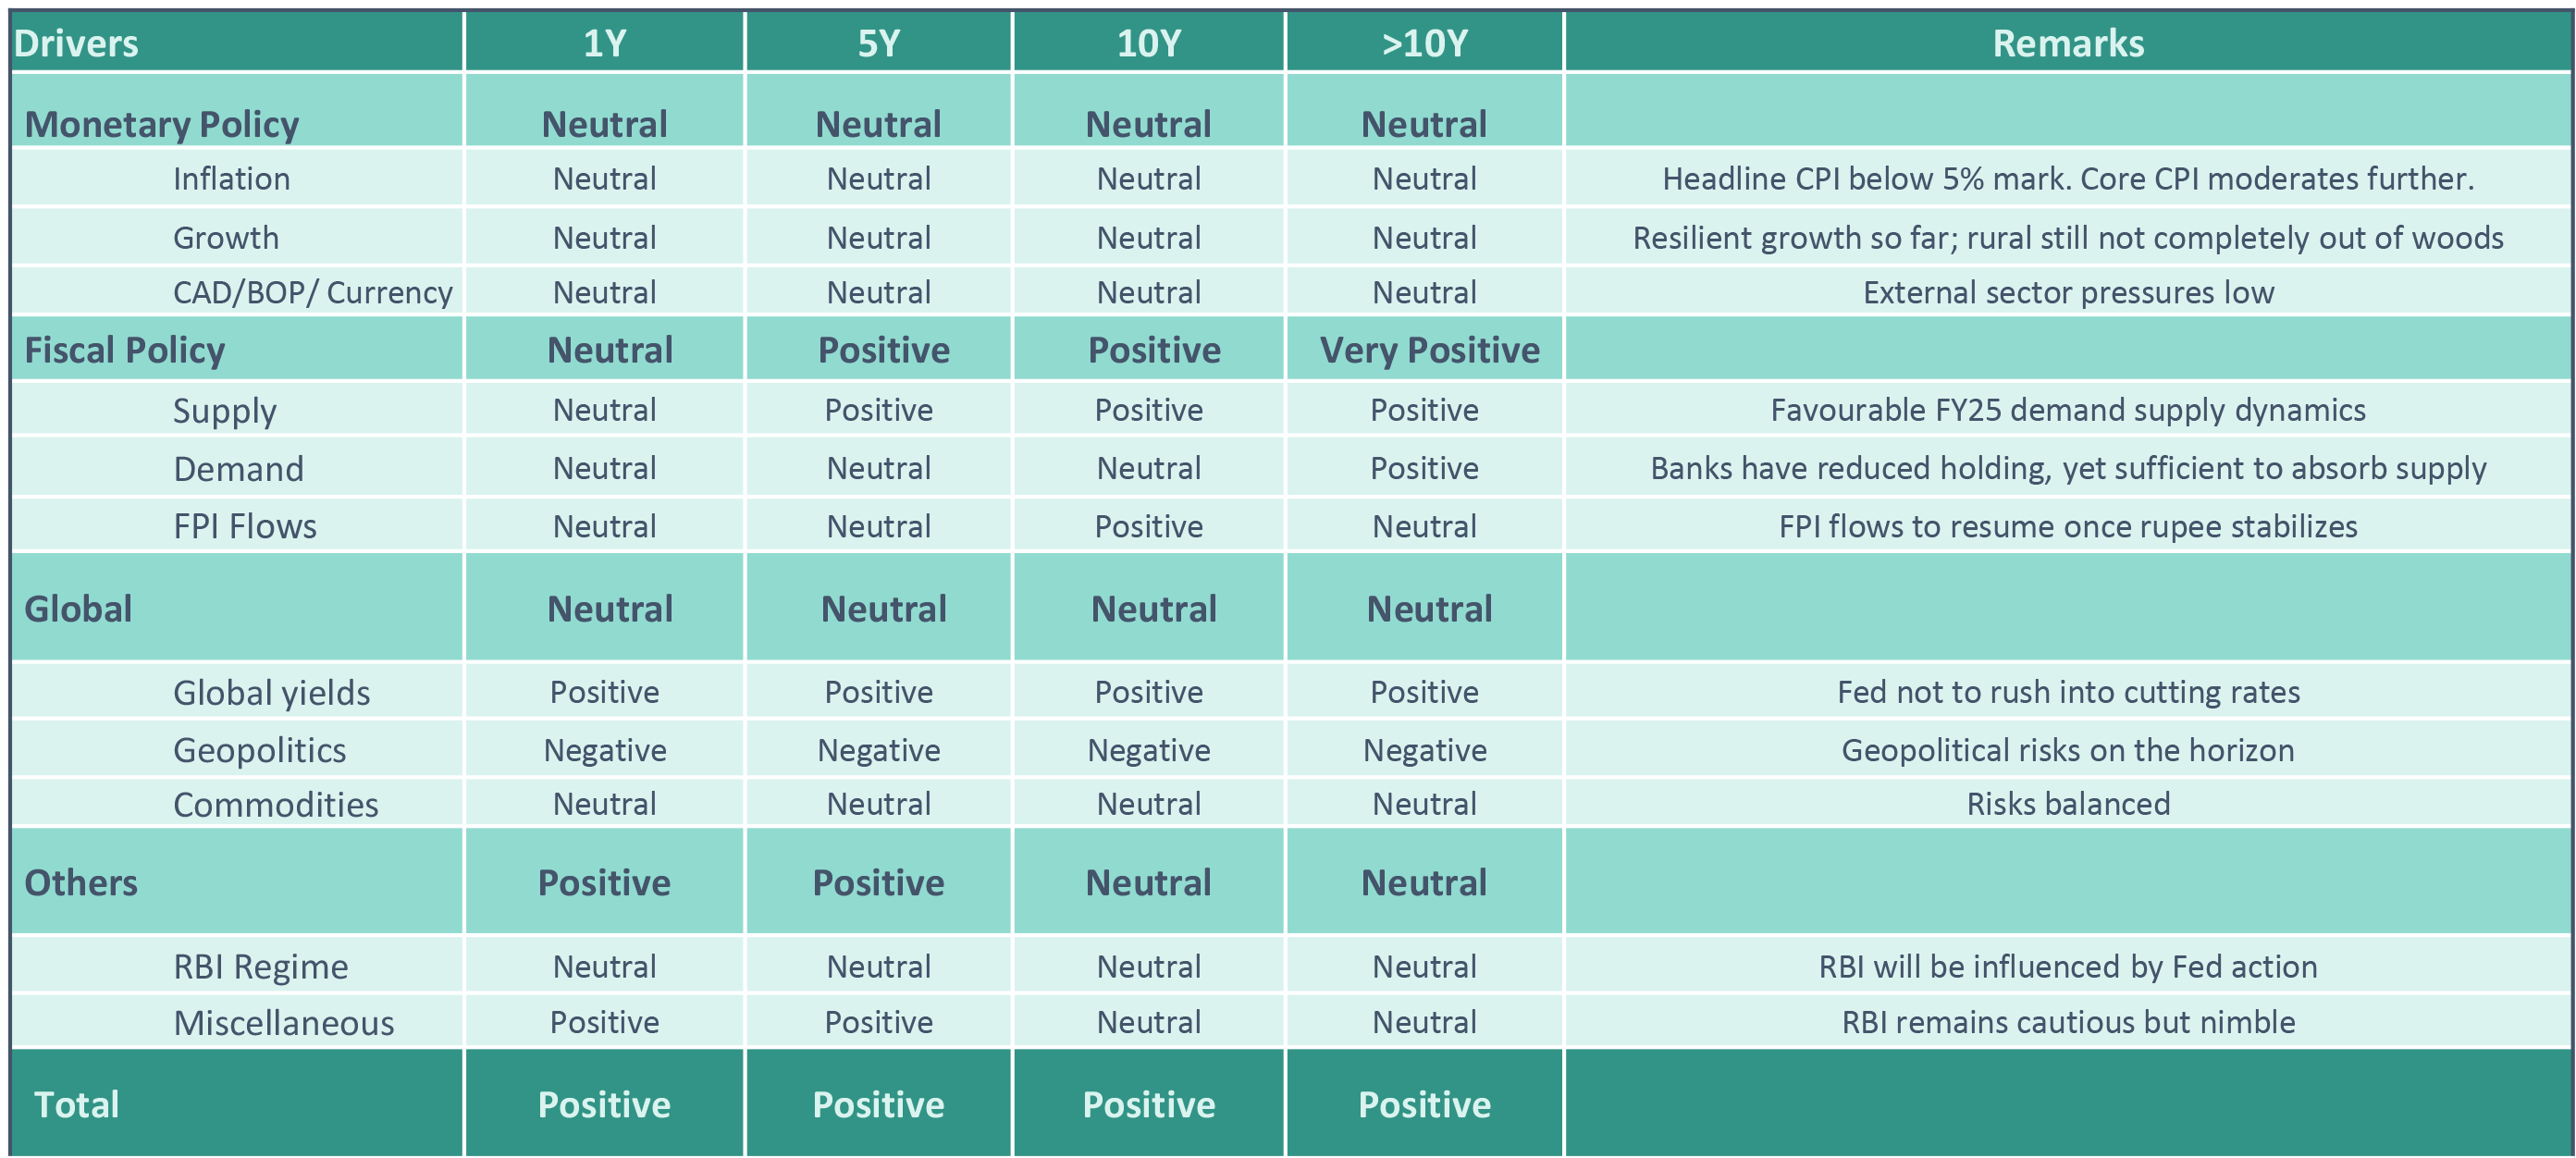
Our Framework
Takeaway:
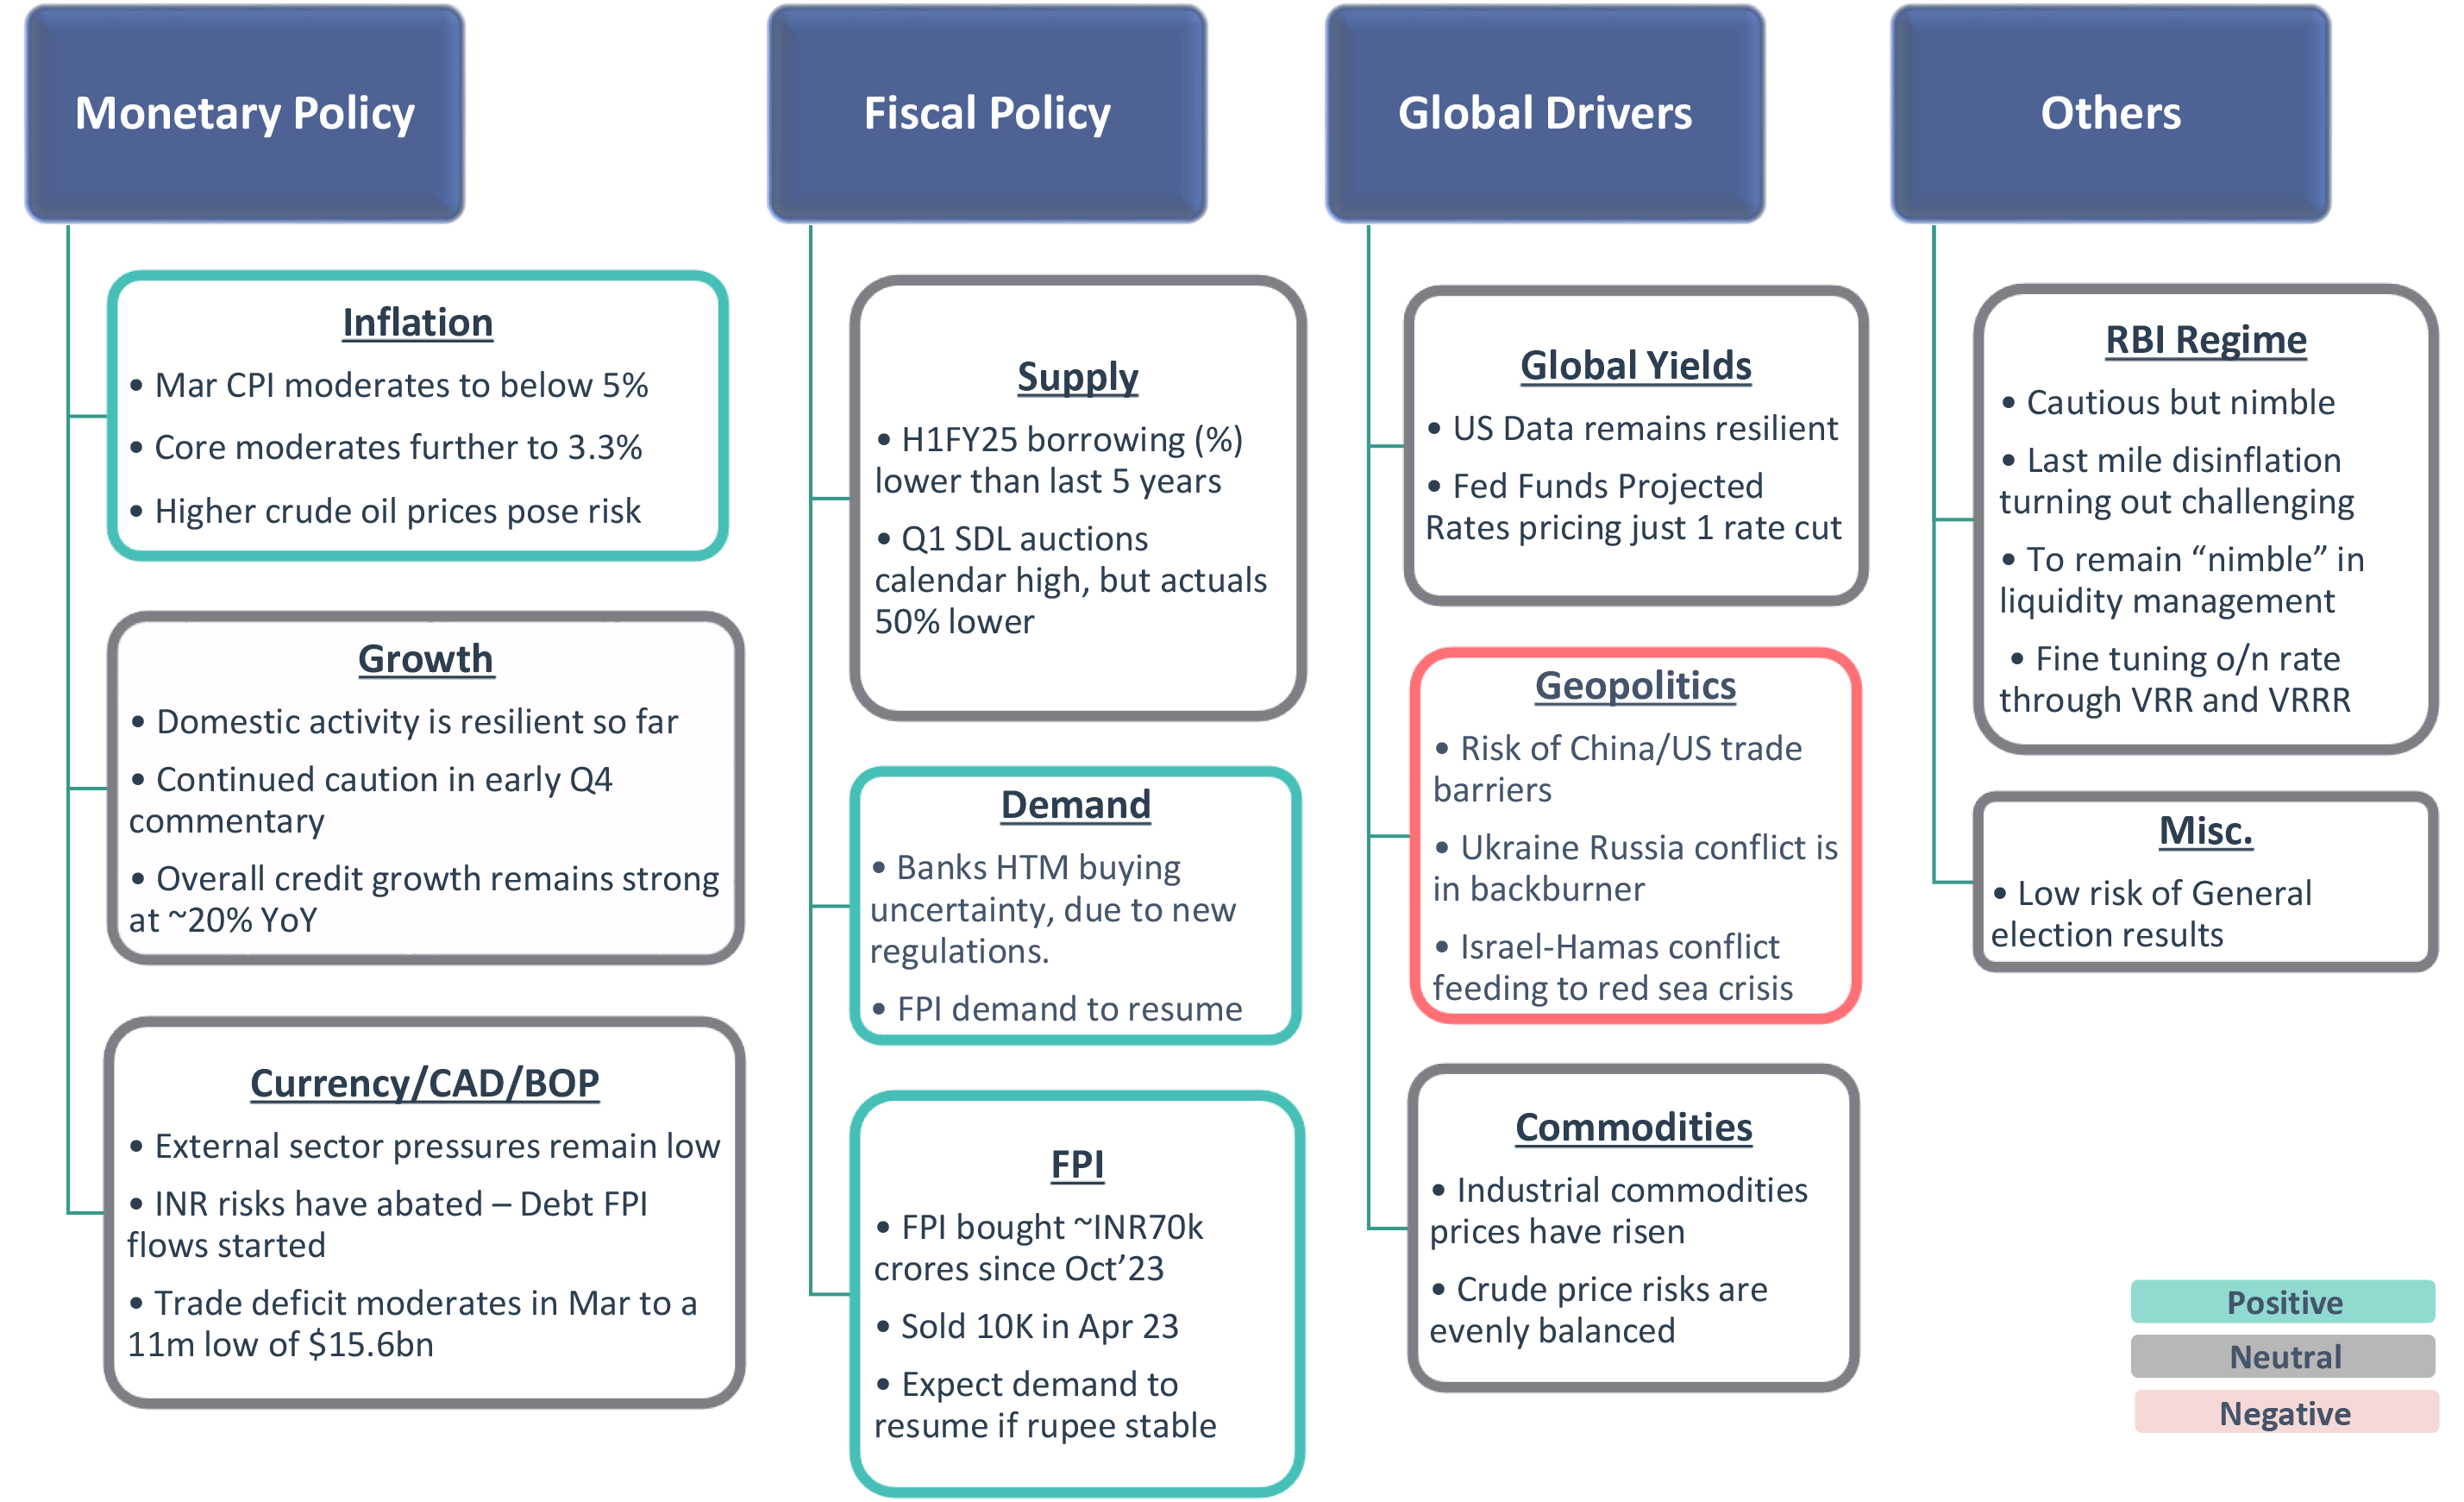
Domestic environment steady, US pricing of rate cut expectations to drive bond yields
CAD – Current Account Deficit; BoP – Balance of Payment; SLR – Statutory Liquidity Ratio; SDL – State Development Loans; RBI: Reserve Bank of India; G-Sec: Government Securities; FPI: Foreign Portfolio Investment; NSSF: National Small Savings Fund; VRR: Variable Repo Rate; VRRR: Variable Reverse Repo Rate; o/n: Overnight
Be Long! Why?
Domestic macros supportive of lower yields
Yet, cut duration risk a bit! Why?
US data is uncertain, currency risks on yields have increased.
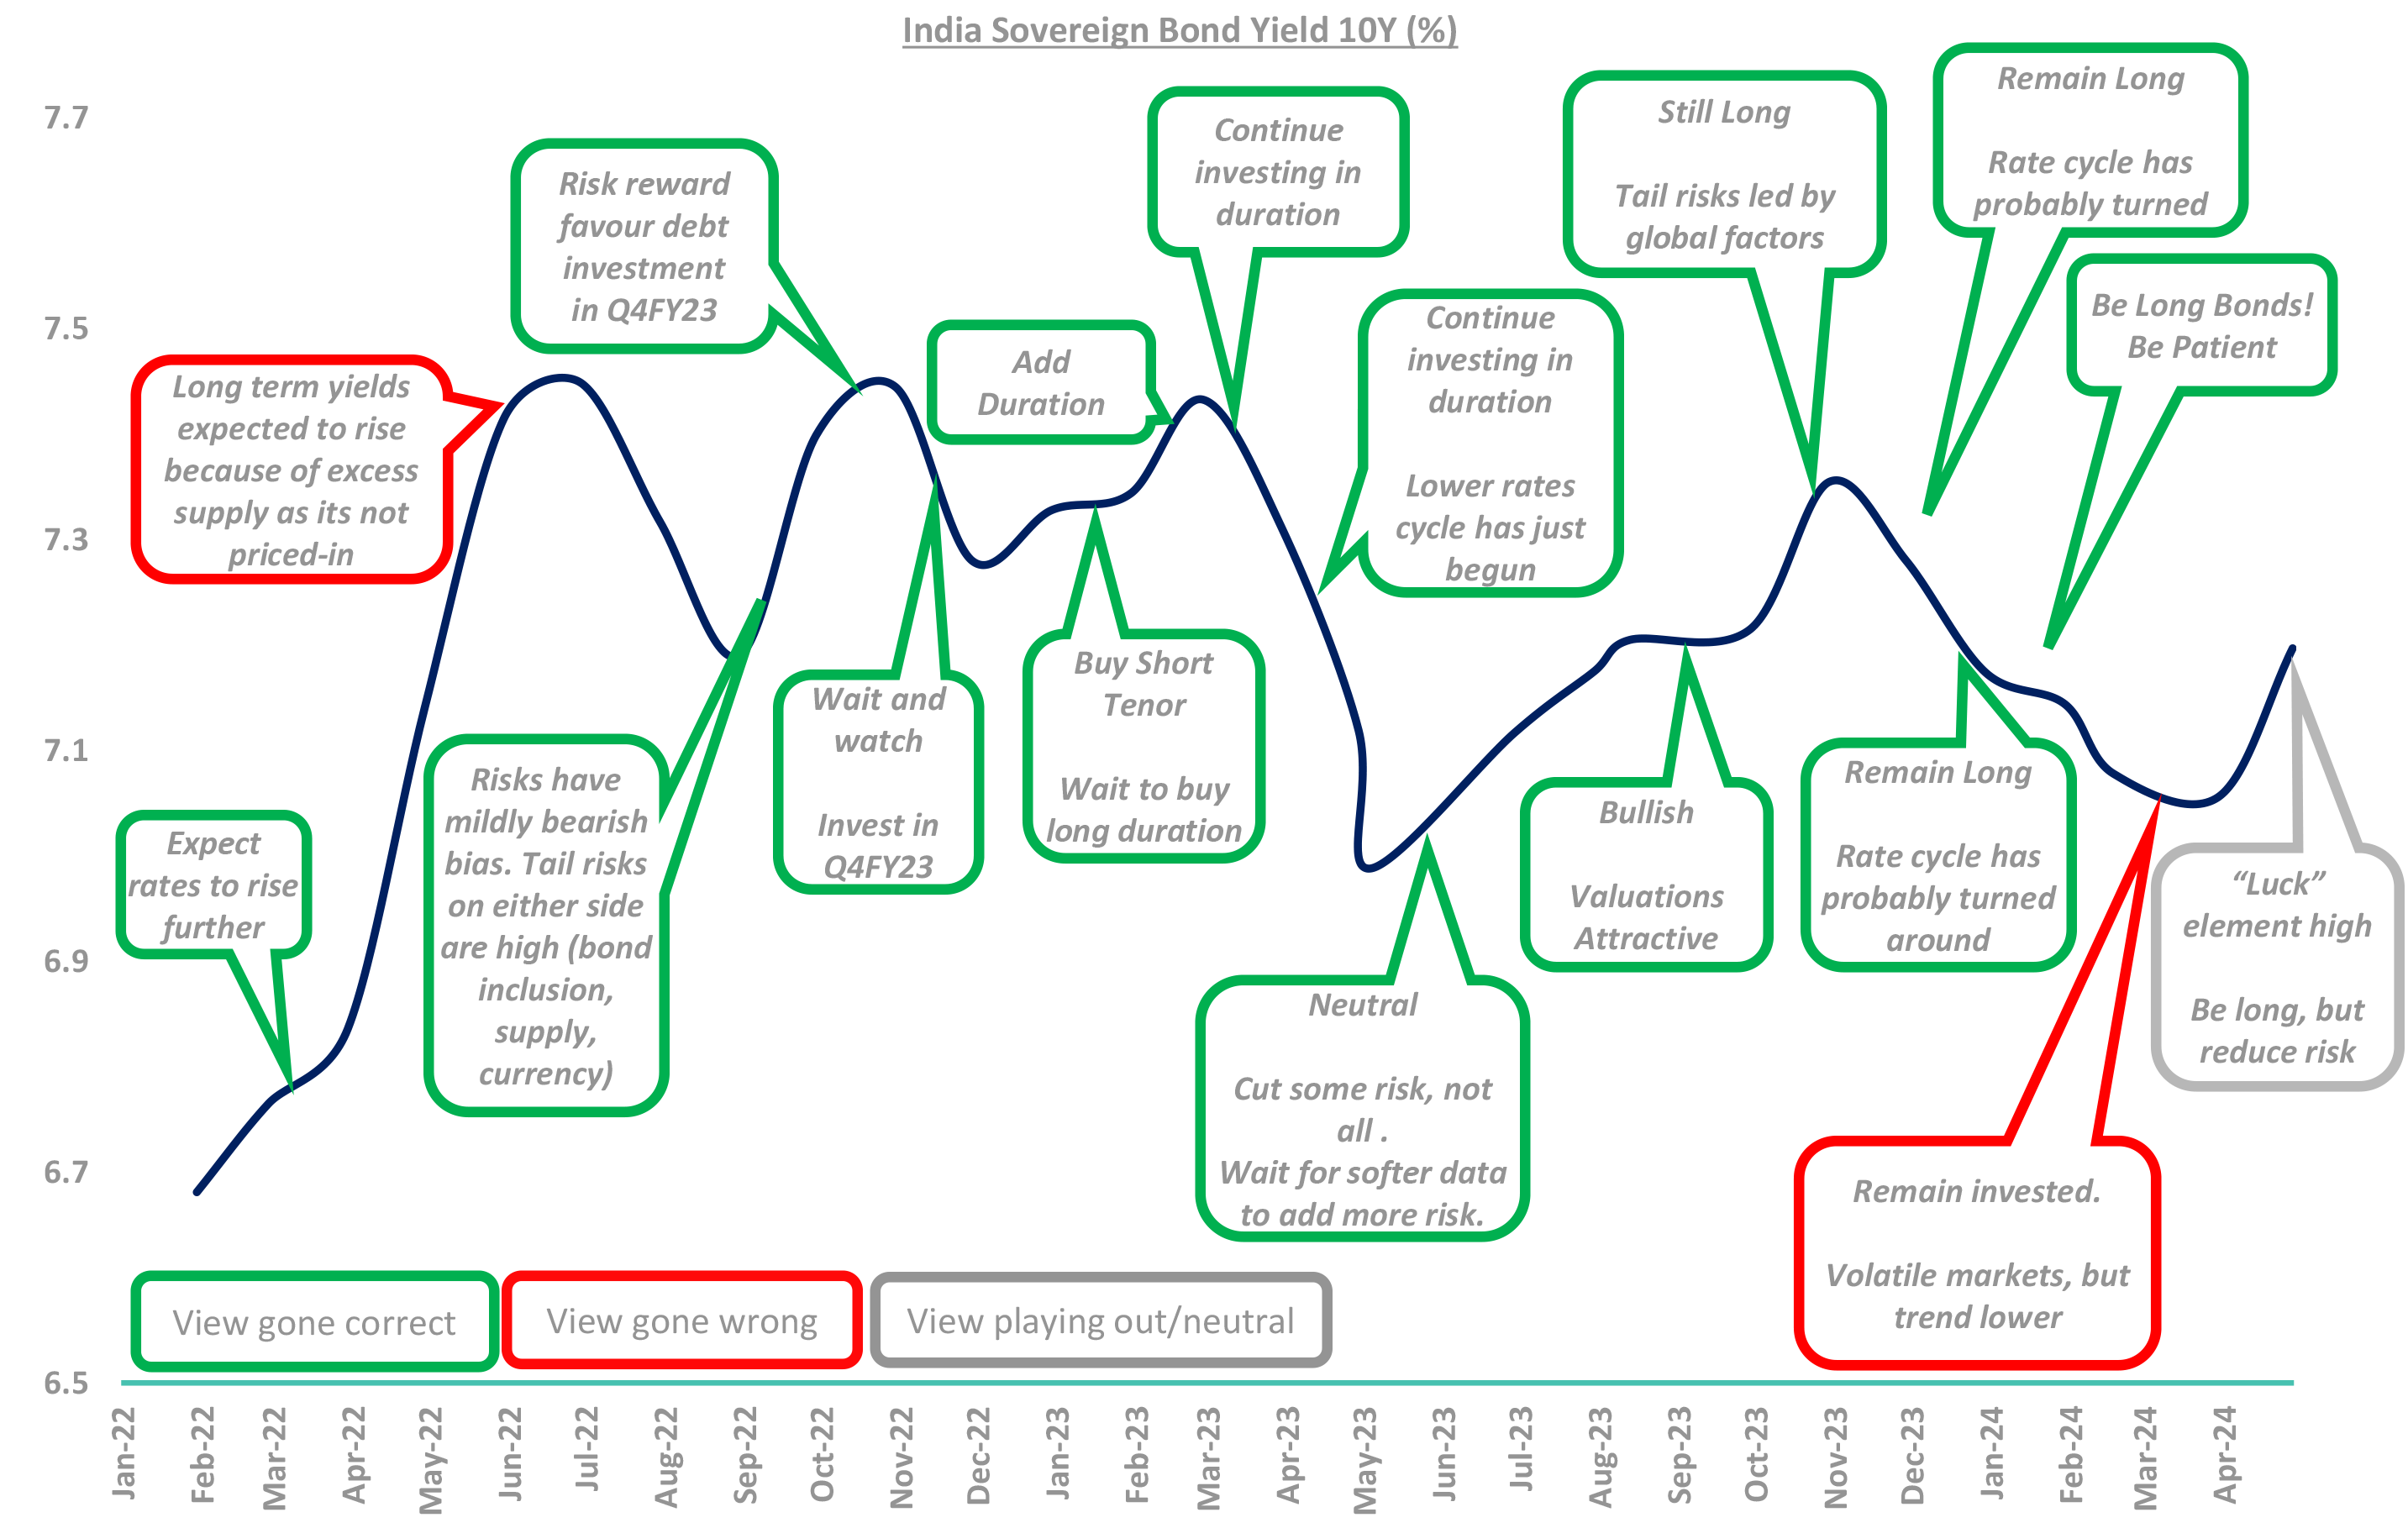
Let’s revisit our rates call trajectory
Source – Bloomberg, Internal
To start with,
Recap of events since last DSP CONVERSE release.
RBI's “status quo” Policy
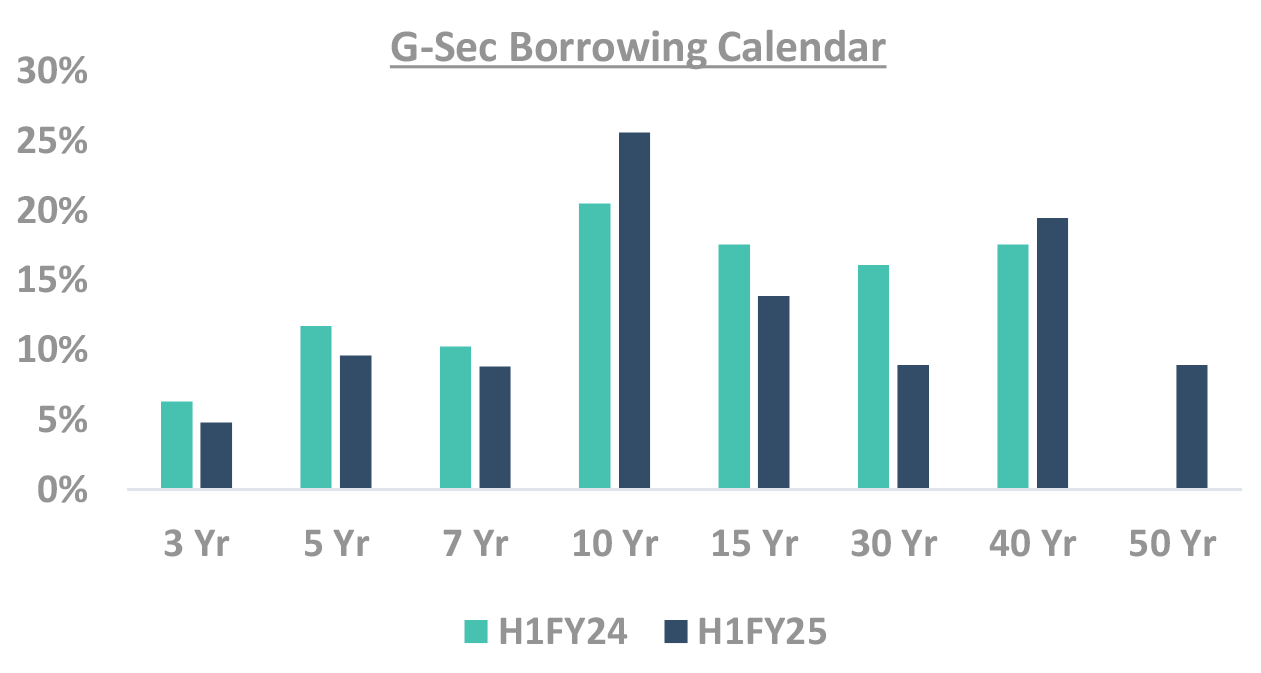
Lower H1FY25 borrowing calendar
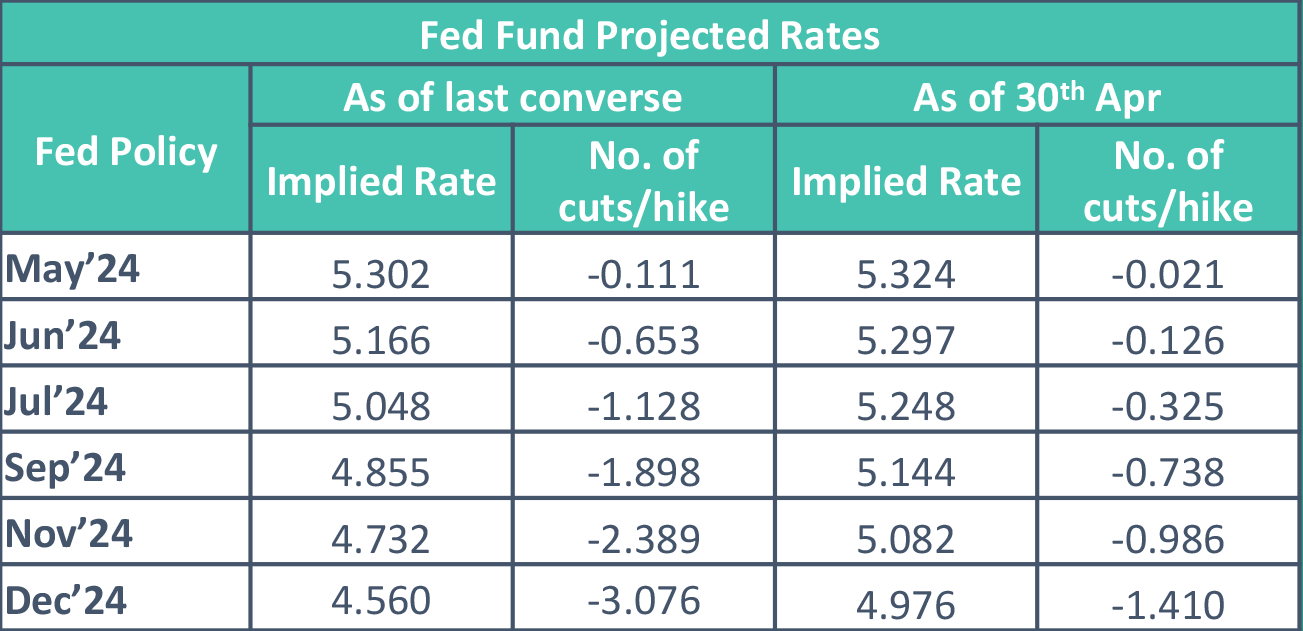
US Fed needs “greater confidence” to cut US Data showing resilience
RBI Policy and Borrowing Calendar
-
REPO rate unchanged at 6.5%
-
Stance retained at “focused on withdrawal of accommodation”
- ✓ By a majority of 5 out of 6 members
Inflation Projections unchanged for FY25 at 4.5%
- ✕ Increasing incidence of climate shocks and low reservoir levels (in southern states) pose concern
- ✕ Tight demand supply conditions in certain pulses, prices of key vegetables & crude oil need close monitoring
Real GDP growth projection unchanged for FY25
- ✕ Headwinds from geopolitical tensions, geo-economic fragmentation, volatile financial markets & rising redsea disruptions
-
To review LCR framework for banks
-
H1FY25 borrowing calendar mildly positive
- ✓ Gross supply at 53.1% of total borrowing for FY25
- Lower than last 5 years
- ✓ Skewed towards 10Y and ultra-long duration
- Where the demand is expected to be
- ✓ Gross supply at 53.1% of total borrowing for FY25
-
Higher than expected Q1FY25 SDL borrowing
- ✓ At 2.54 lac crores
- ✓ However, actual issuance has been 50% lower so far
Source – RBI GDP: Gross Domestic Product
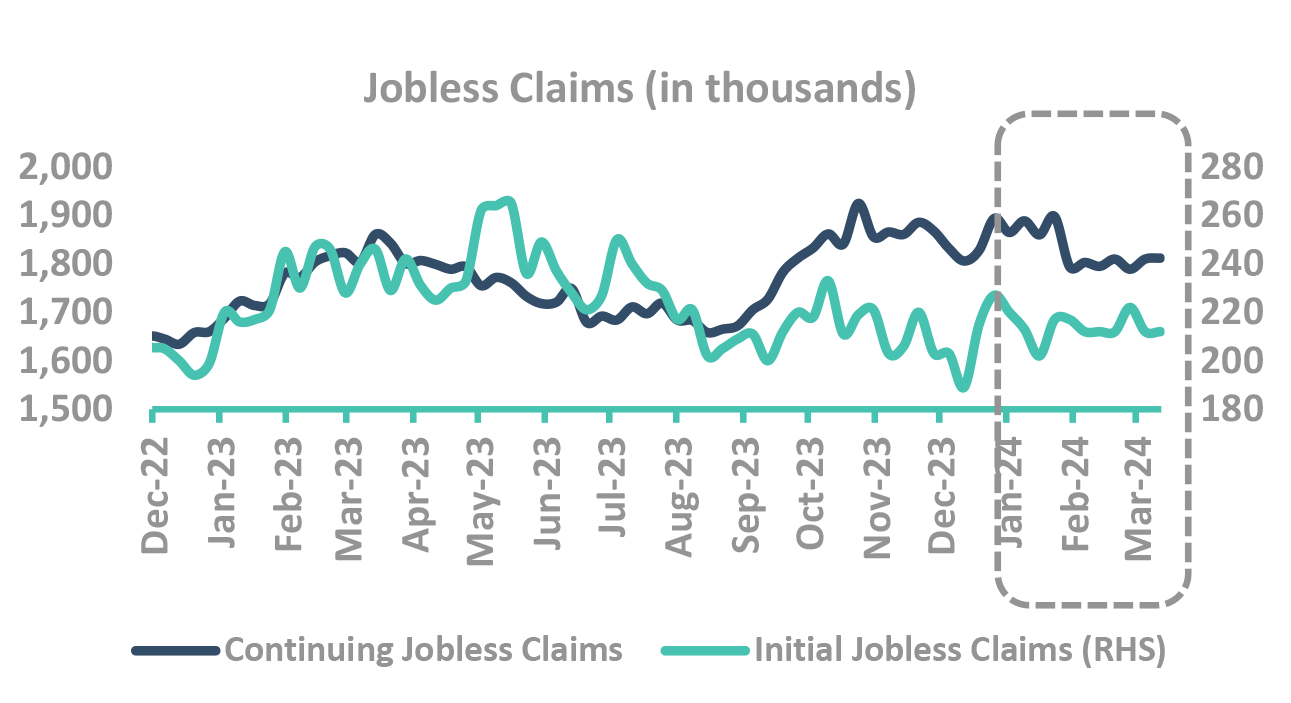
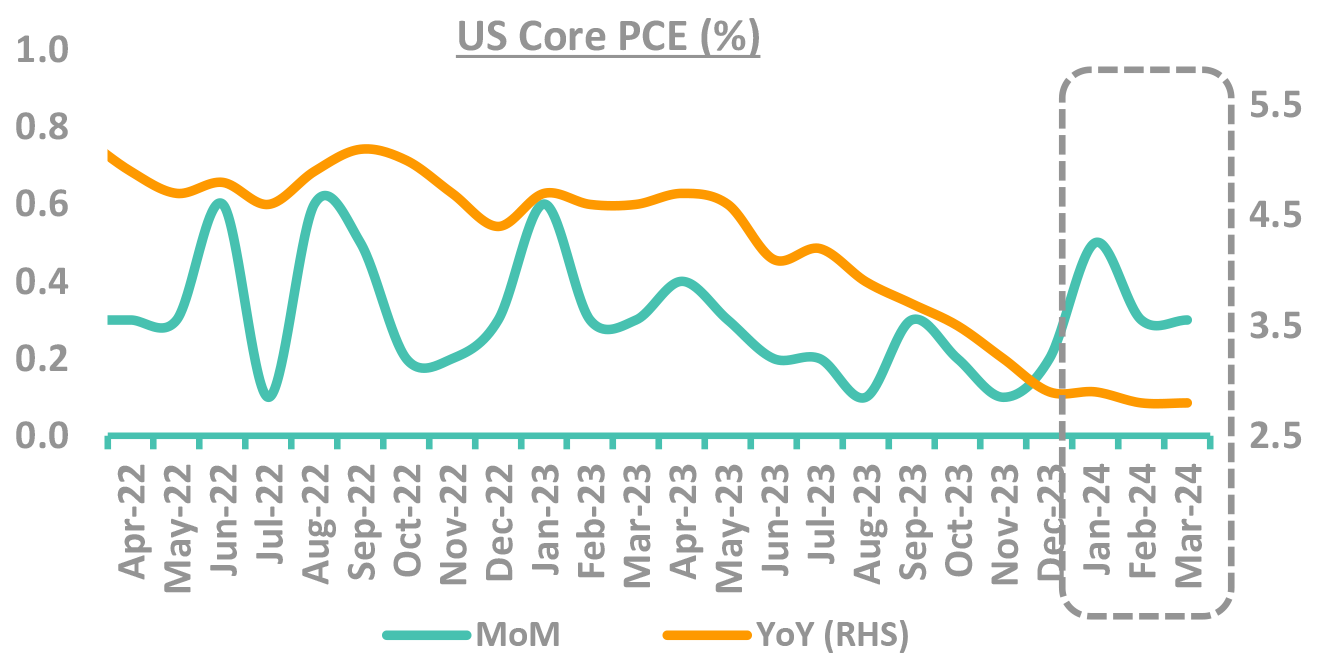
US data shows resilience and Fed not to rush into cutting rates
Takeaway:
Fed not to rush into cutting rates
Source – Bloomberg, Federal Reserve PCE: Personal Consumption Expenditure; FOMC: Federal Open Market Committee
Now our framework
And
What we track
Our Framework
Takeaway:
Domestic environment steady, US pricing of rate cut expectations to drive bond yields
CAD – Current Account Deficit; BoP – Balance of Payment; SLR – Statutory Liquidity Ratio; SDL – State Development Loans; RBI: Reserve Bank of India; G-Sec: Government Securities; FPI: Foreign Portfolio Investment; NSSF: National Small Savings Fund; VRR: Variable Repo Rate; VRRR: Variable Reverse Repo Rate; o/n: Overnight
Resilient domestic economic activity
Expansion in urban demand while rural still not completely out of woods
Inflationary risks seem contained
RBI to be nimble in liquidity management
Core CPI moderates further. Risks seem contained
-
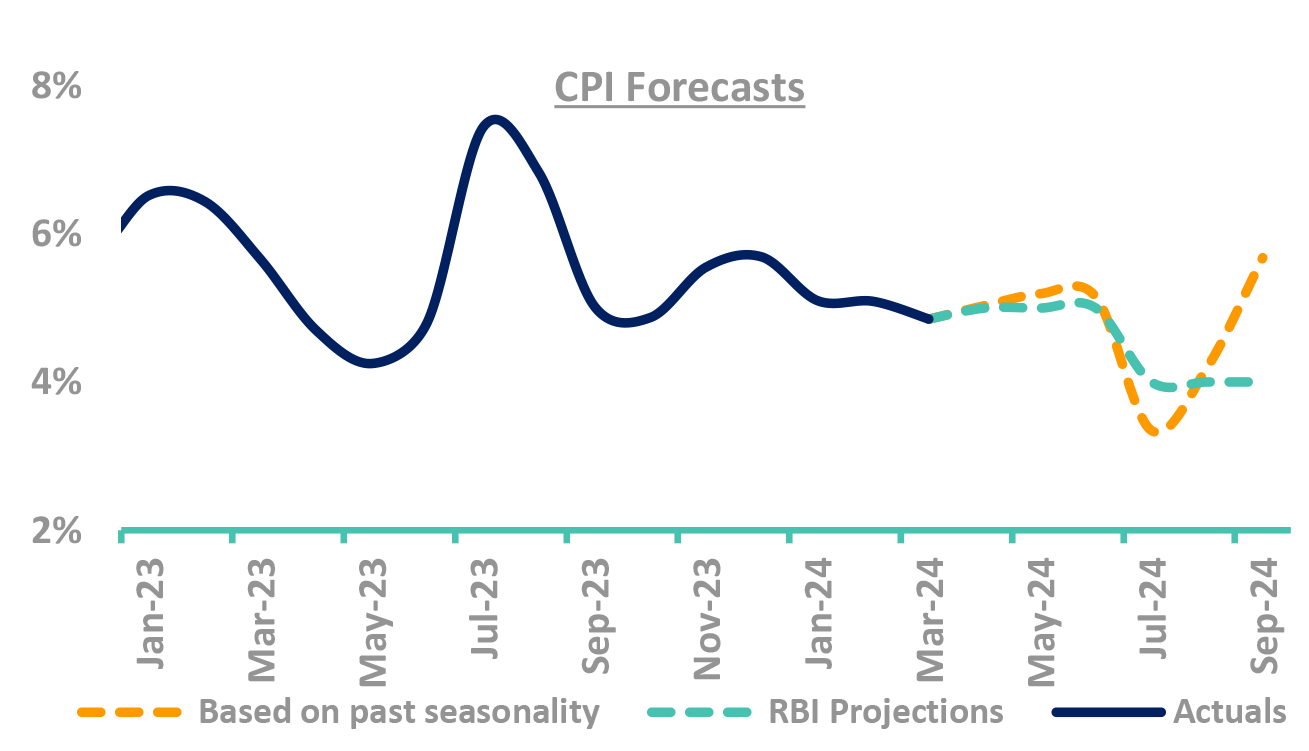
Mar CPI moderates to 4.85% (5.1% in Feb)
- Back below 5% mark after 4 months
- Led by lower food & fuel inflation
- Crude oil prices and higher non-energy commodity prices pose upside risk
Core continues to provide comfort
- Moderates further to 3.3% (3.4% in Feb)
- Lower on M-o-M basis as well at 0.2% (0.3% in Feb)
-
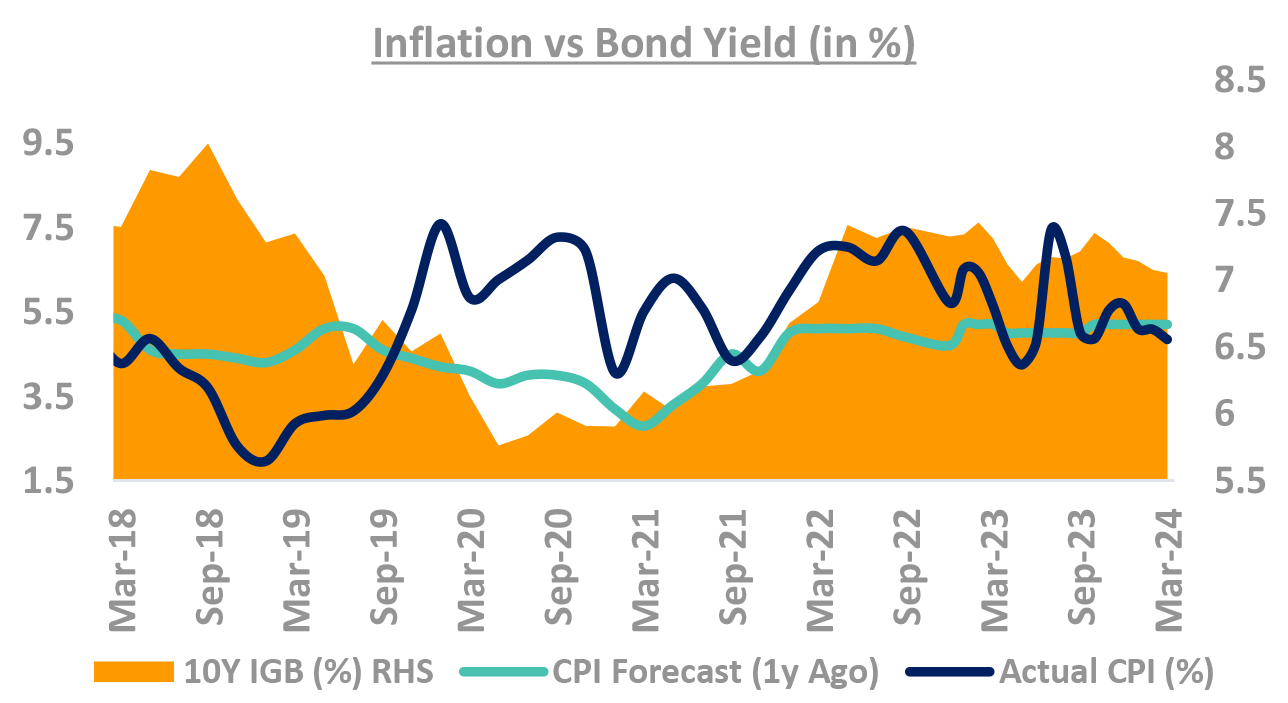
Do yields track inflation projection? No.
- Orange area (chart) is 10Y yields, Blue line is CPI
Can forecasters predict Indian CPI? No.
- Green line is forecasters CPI 1-Yr ahead prediction
- Blue line is where inflation actually came
- Guess the error of margin!
CPI forecast corelated (not causality) to yields
- Low predictive power, high current corelation
Takeaway:
Domestic inflation risks seem contained. Volatility in CPI has not impacted yields (especially in 2023)
Source – Bloomberg, RBI, Internal CPI: Consumer Price Inflation; RBI: Reserve Bank of India; IGB: India Government Bond
Domestic growth resilient so far: But watch out for trends
-
Watch out for domestic growth
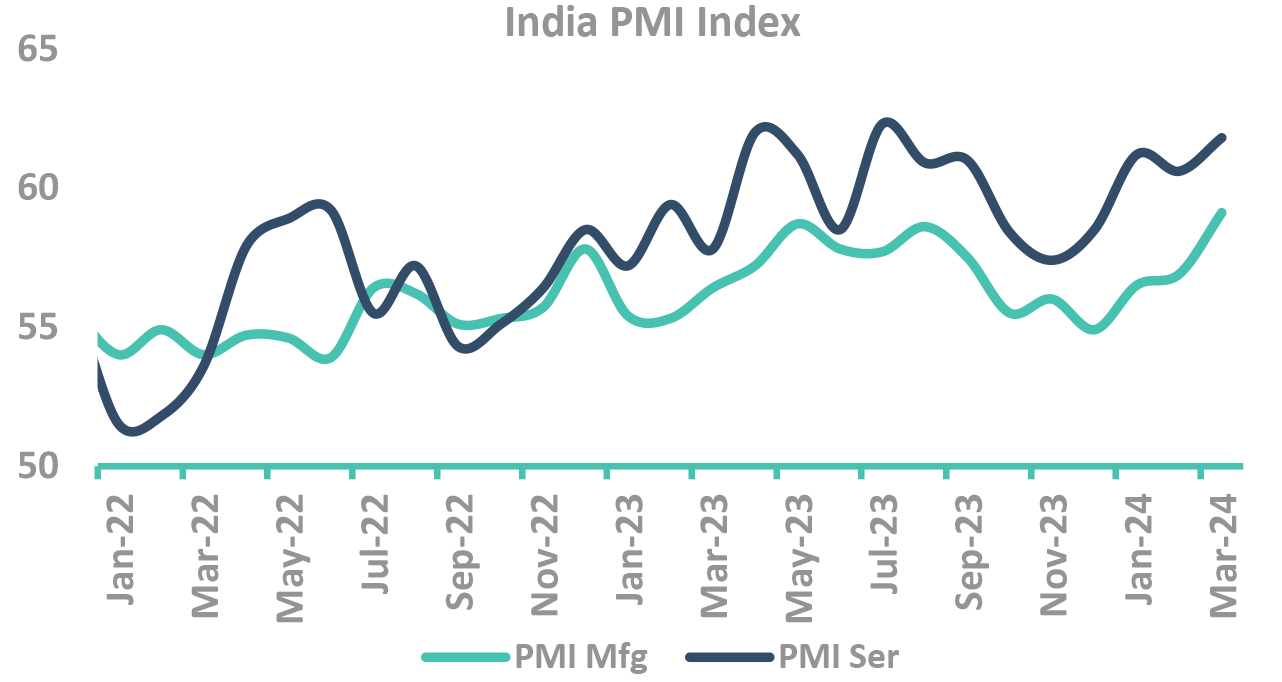
- PMI continue to be in expansionary mode
- ✓ Manufacturing PMI at 16y high
- Mar sees 2nd highest GST revenue at 1.78 lac crores (up 11.5% YoY)
- Early Q4 commentary highlight continued caution
- PMI continue to be in expansionary mode
Overall credit growth remains strong at ~20%
- Unsecured loan growth has slowed down
- Pickup in housing and credit to large industries
- Services growth remains strong
-
How closely do yields track growth?
- Yields have usually tracked GDP growth, with
correlation stronger when growth slows, barring
- ✓ 2013, rupee depreciation and debt outflows
- ✓ 2017, during demonetization
- Yields have usually tracked GDP growth, with
correlation stronger when growth slows, barring
FY24, growth may not be big driver for yields
- FY23 GDP growth at 7.2% -in line with RBI projections.
- Q3FY24 GDP Growth came in at 8.4%.
.webp)
Takeaway:
Domestic growth seems to be resilient so far but watch out for emerging trends
Source – Bloomberg, PIB, Internal GDP: Gross Domestic Product; PMI: Purchasing Managers’ Index; GST: Goods and Service Tax; IGB: India Government Bond
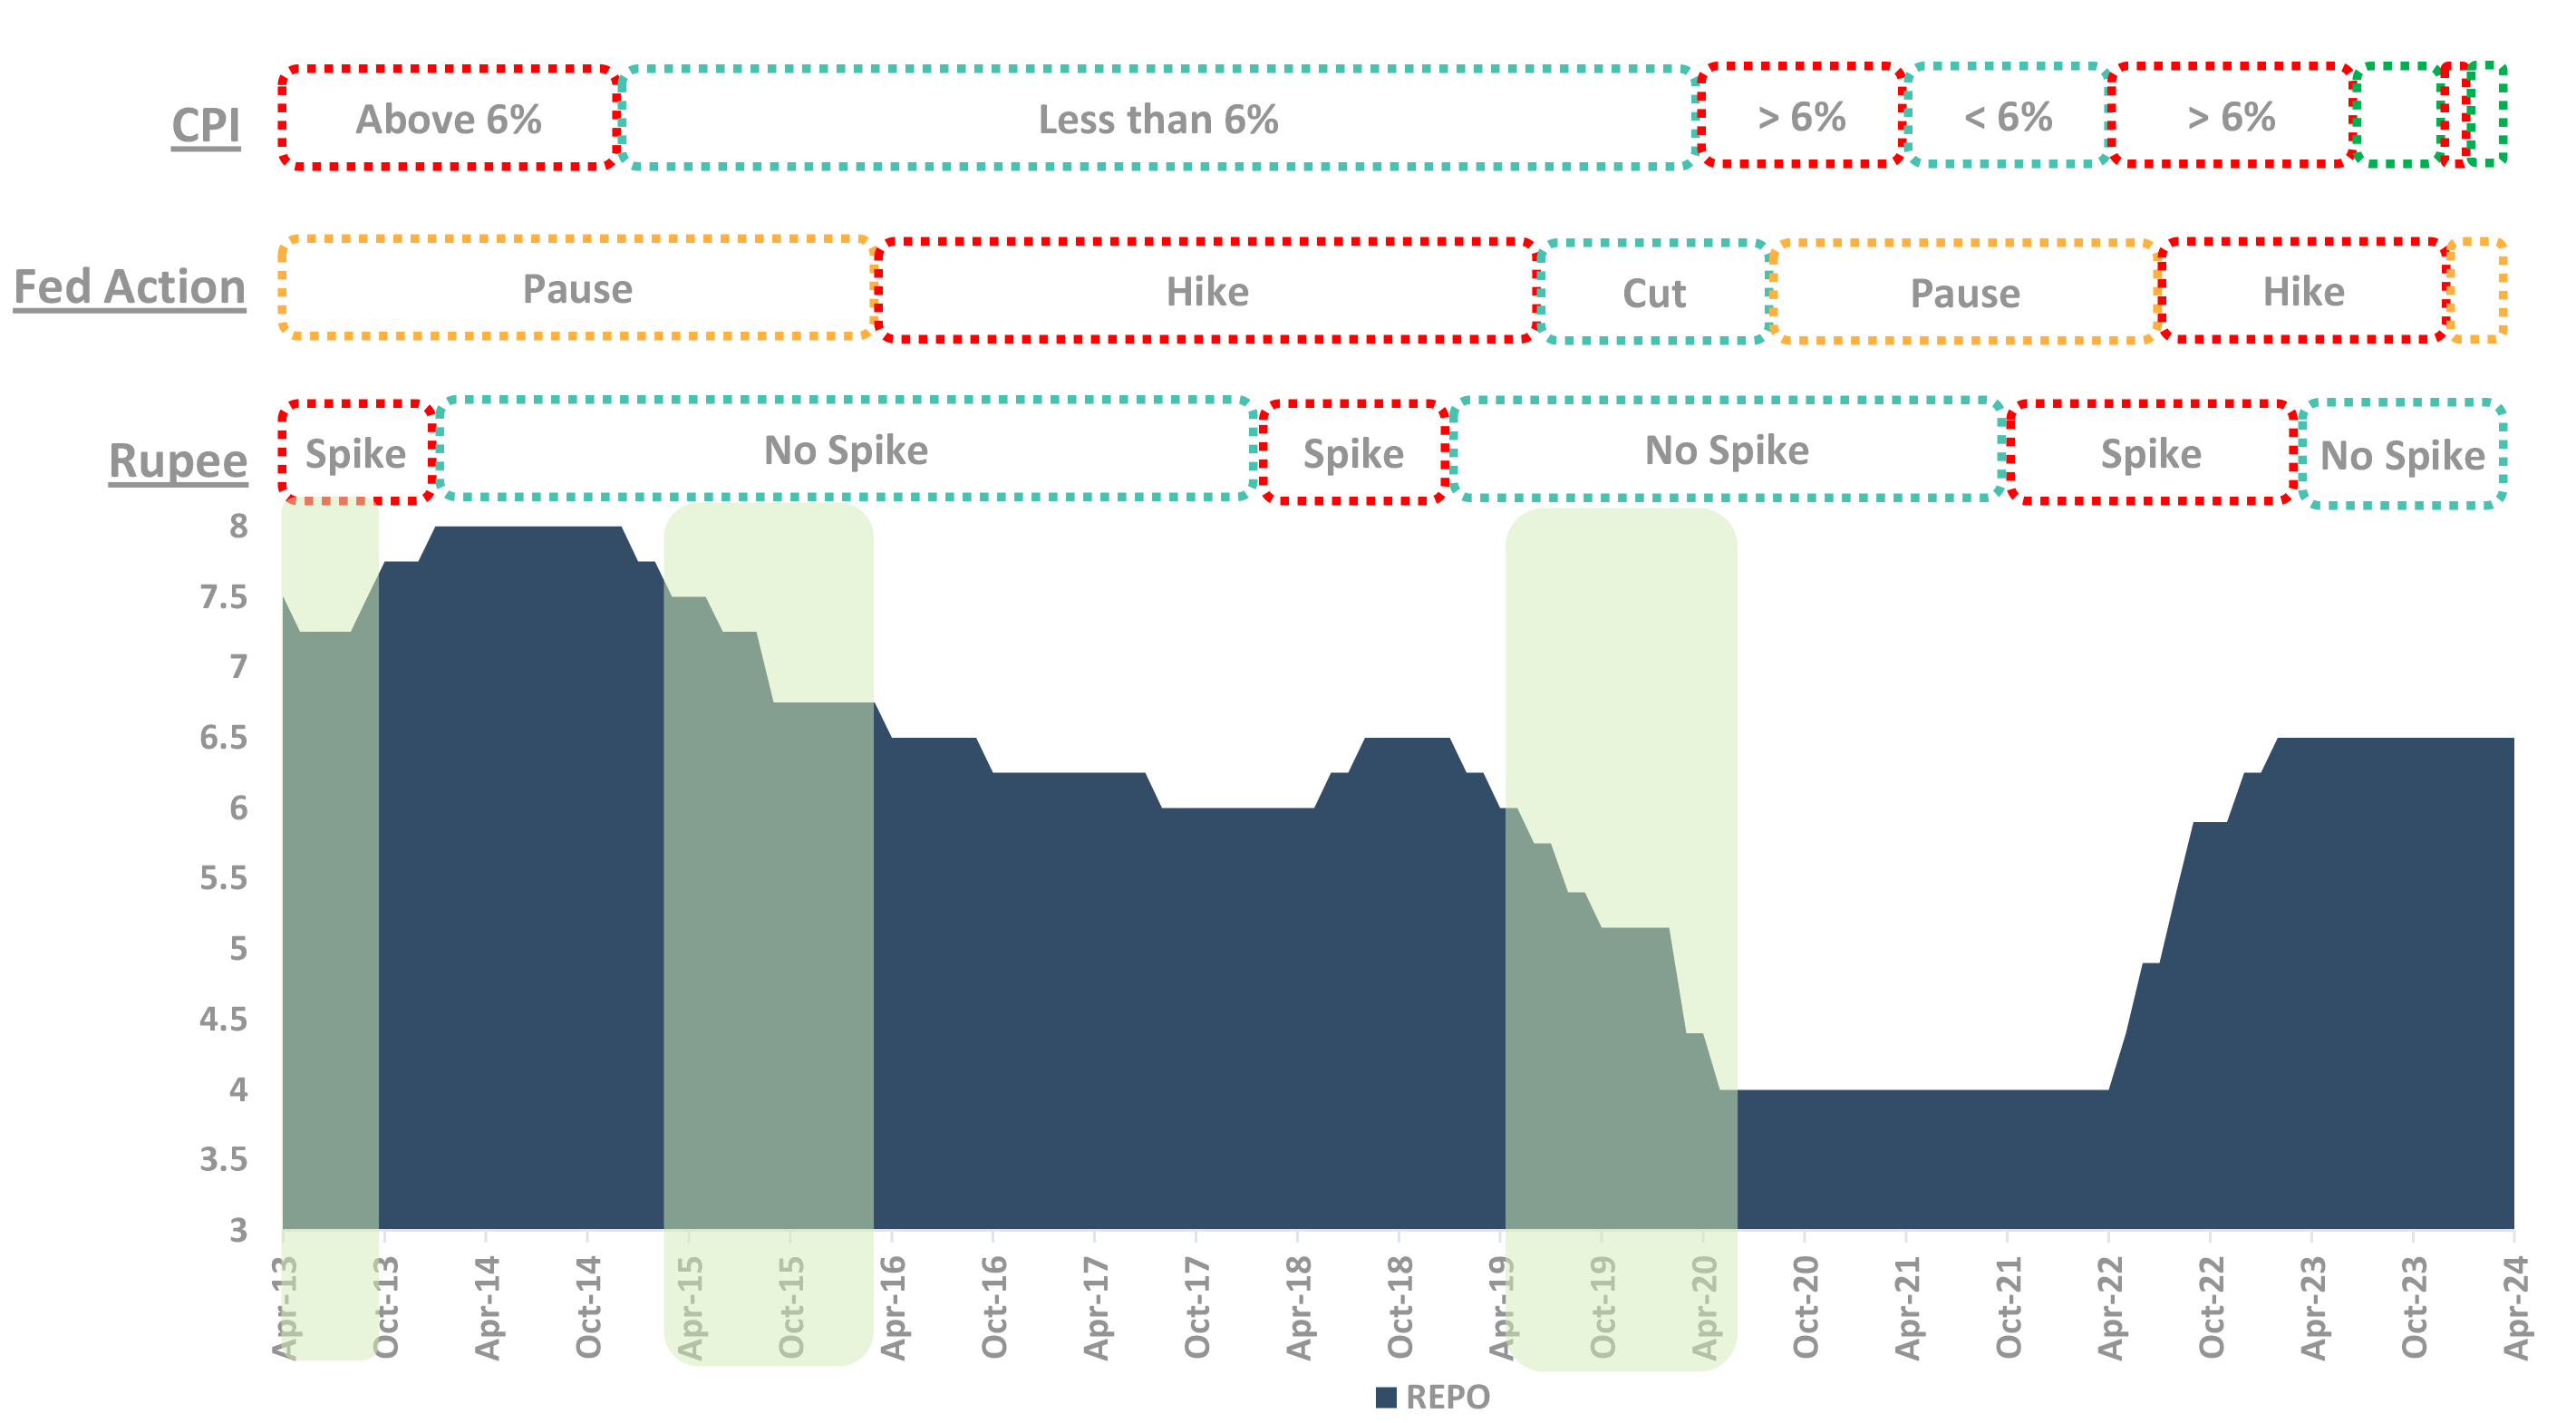
What makes RBI Cut Rates?
Rate cuts: Waiting for evidence from Fed cuts
-
Checklist for cut:
- Fed Pause/Cut
- Stable Rupee
- CPI less than 6% (except in 2013 when RBI didn’t have 6% target)
-
How is the Checklist now:
- Awaiting cuts from FED
- Given the FPI flows, forex reserves at $600bn+ and normalization of trade deficit, rupee to remain stable
- Inflation risks seem contained
Core CPI moderates further
Growth remains resilient
FPI flows to support INR
Low risk in general elections
Let’s turn to Fiscal policy
Generally, it drives the long bond yields
It is reflected in demand/supply equation
Fiscal policy is favouring bonds right now
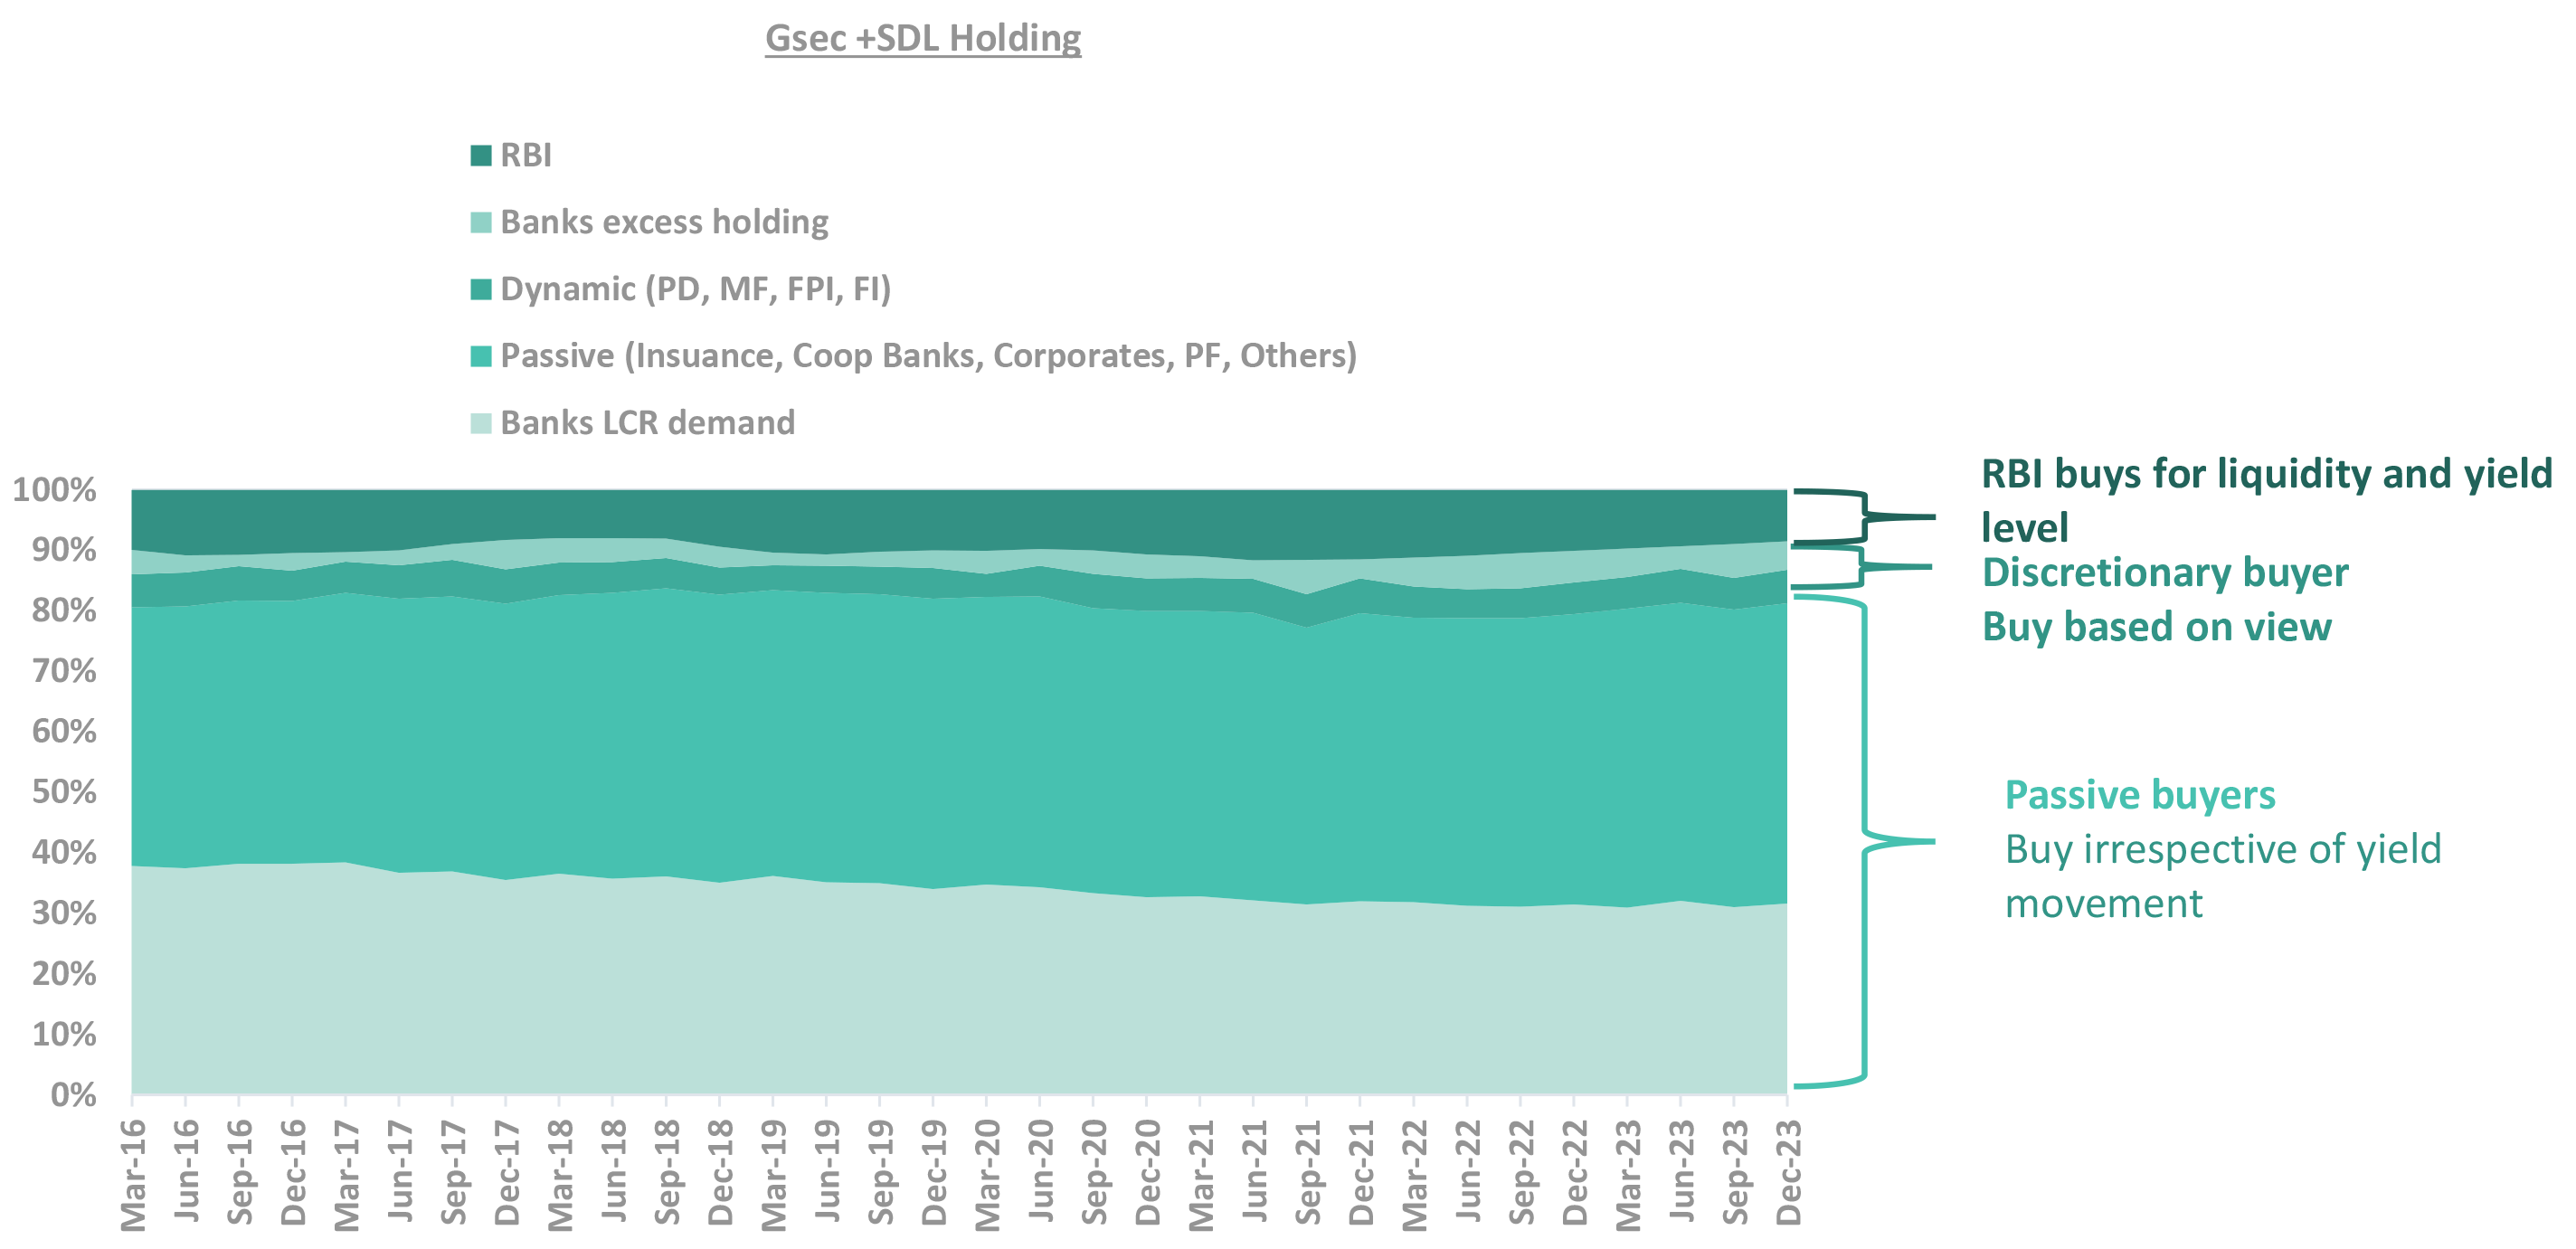
Only a small part of bond buyers are discretionary buyers
They drive yields
Supply fluctuation is borne by these buyers
Gsec market is still driven by lumpy institution purchases
Takeaway:
Increase in supply impacts the discretionary buying. Banks excess holding, passive buyers have been absorbing the supply
Source – DBIE LCR – Liquidity Coverage Ratio; SDL – State Development Loans; PF – Provident Funds; PD – Primary Dealerships; MF – Mutual Funds; FPI – Foreign Portfolio Investors; FI – Financial Institutions; RBI: Reserve Bank of India; GSec: Government Securities
Comfortable supply/demand dynamics for FY25
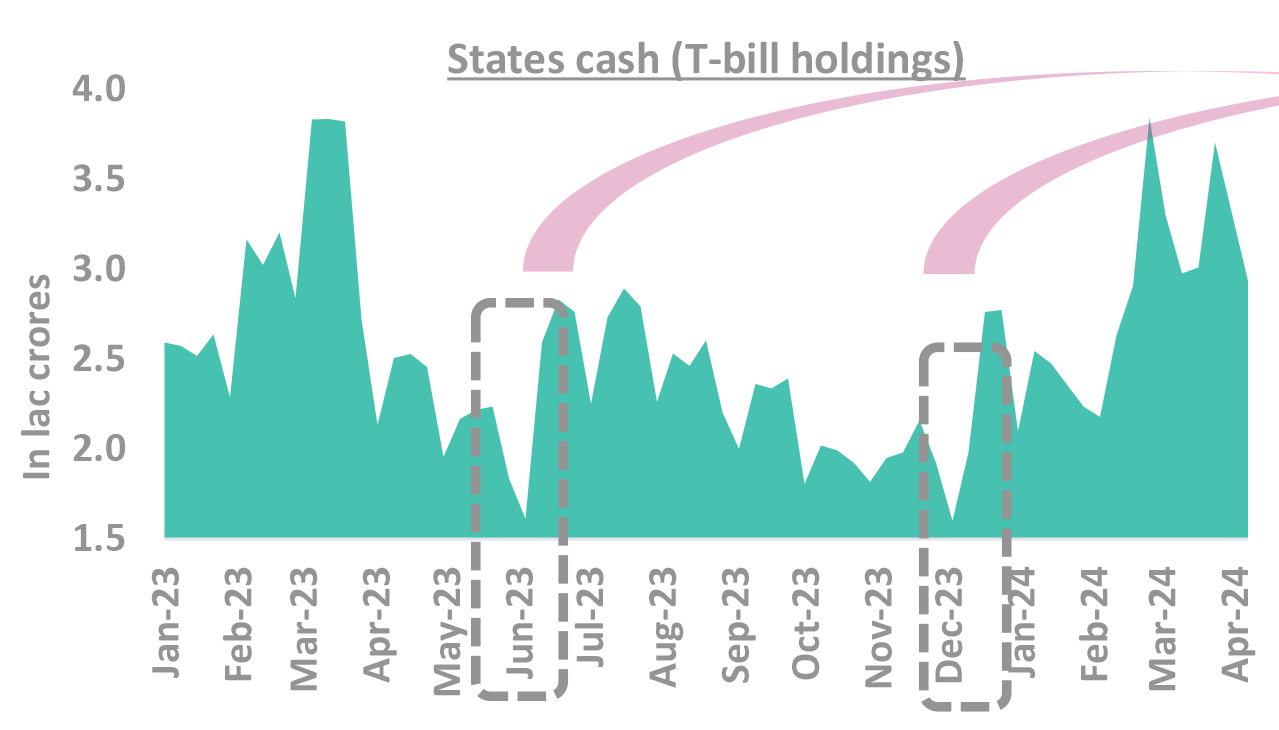
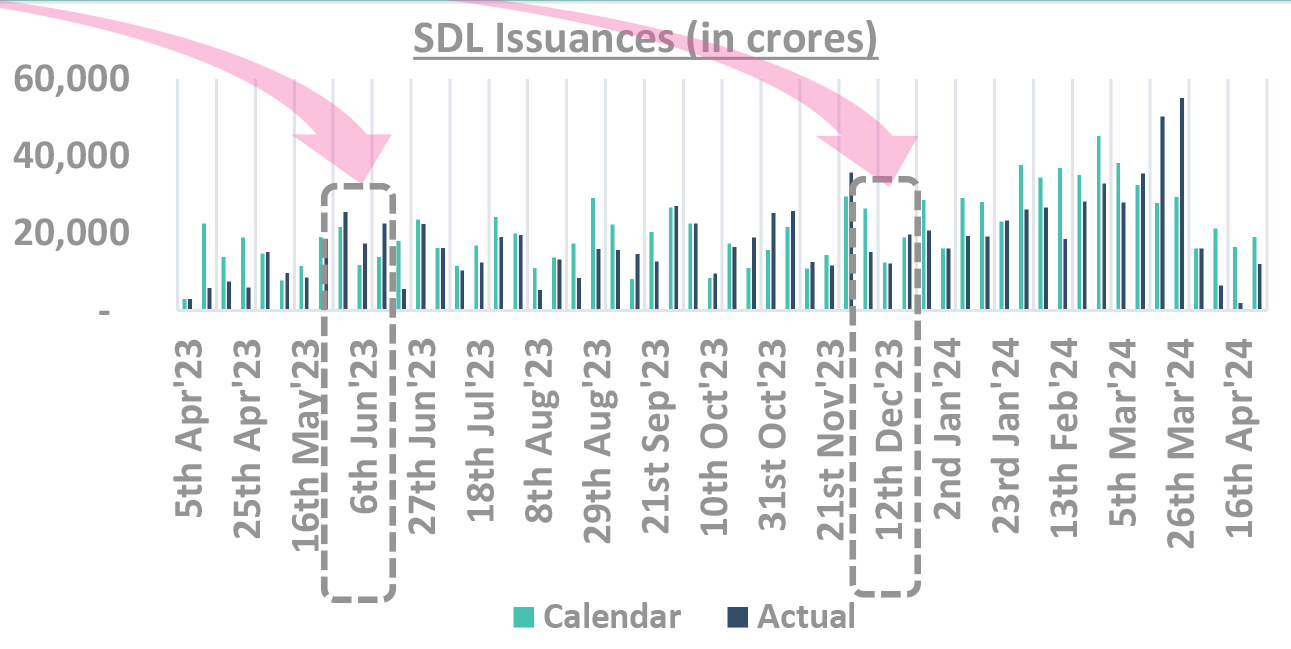
SDL supply only increases when states cash dip
Takeaway:
SDL demand-supply to remain well-matched in FY25
Source – DBIE, RBI T-bill: Treasury Bill; SDL: State Development Loans
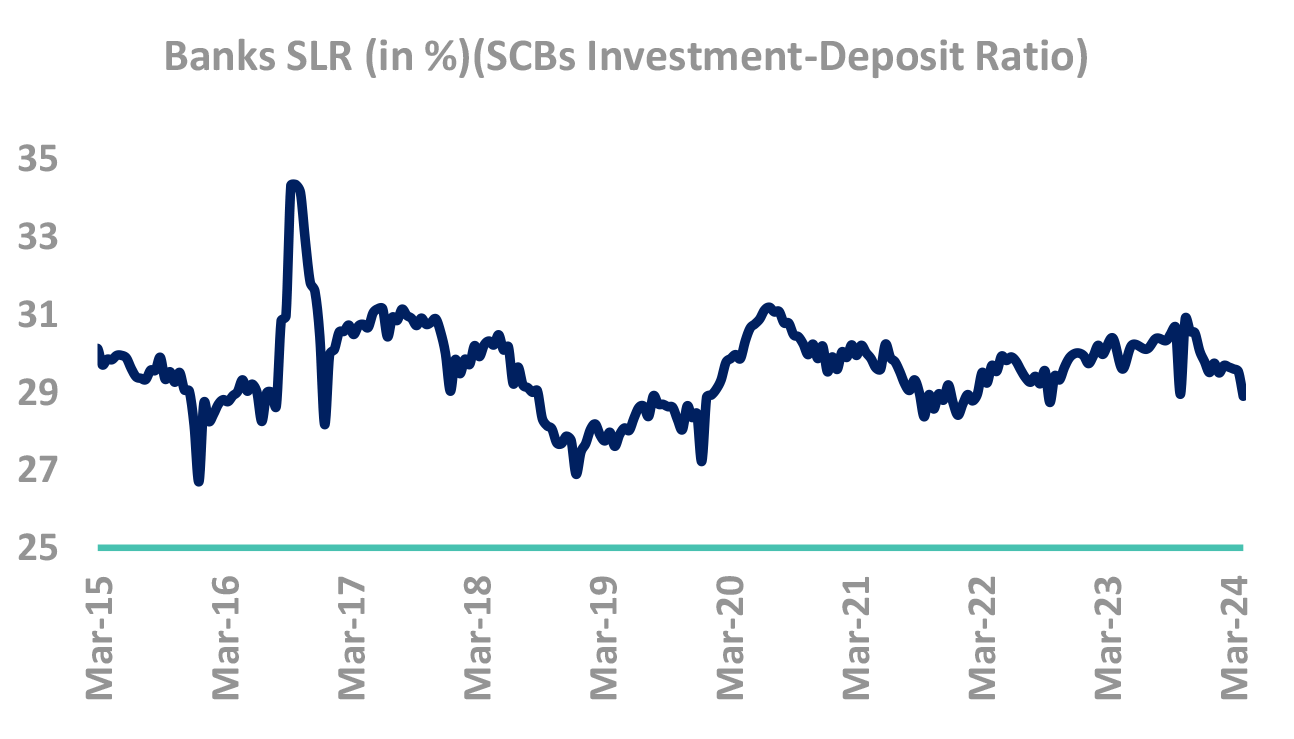
Banks have reduced holding
-
Yields usually track RBI OMO purchases
- Yields have strong correlation with RBI OMO
- Demand/Supply mismatch is filled in by RBI
-
RBI softened its liquidity management stance. However,
- Liquidity continues to remain tight despite VRR operation by RBI
- Further intervention necessary to bring liquidity to neutral
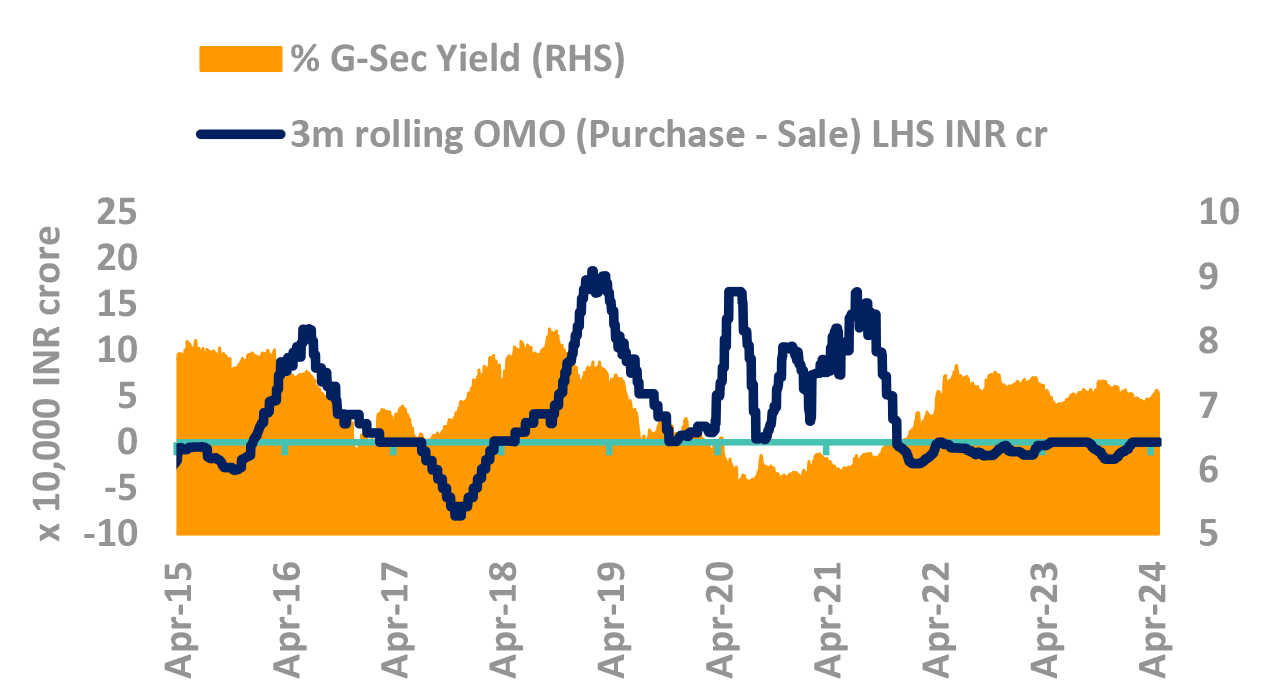
Takeaway:
Bank’s demand could shift to carry assets like SDLs and Corporate Bonds with the change in HTM regulations
Source – Bloomberg, DBIE, Internal OMO – Open Market Operations, SLR – Statutory Liquidity Ratio; G-Sec – Government Securities; RBI: Reserve Bank of India; SCB: Scheduled Commercial Bank; CIC: Currency in Circulation
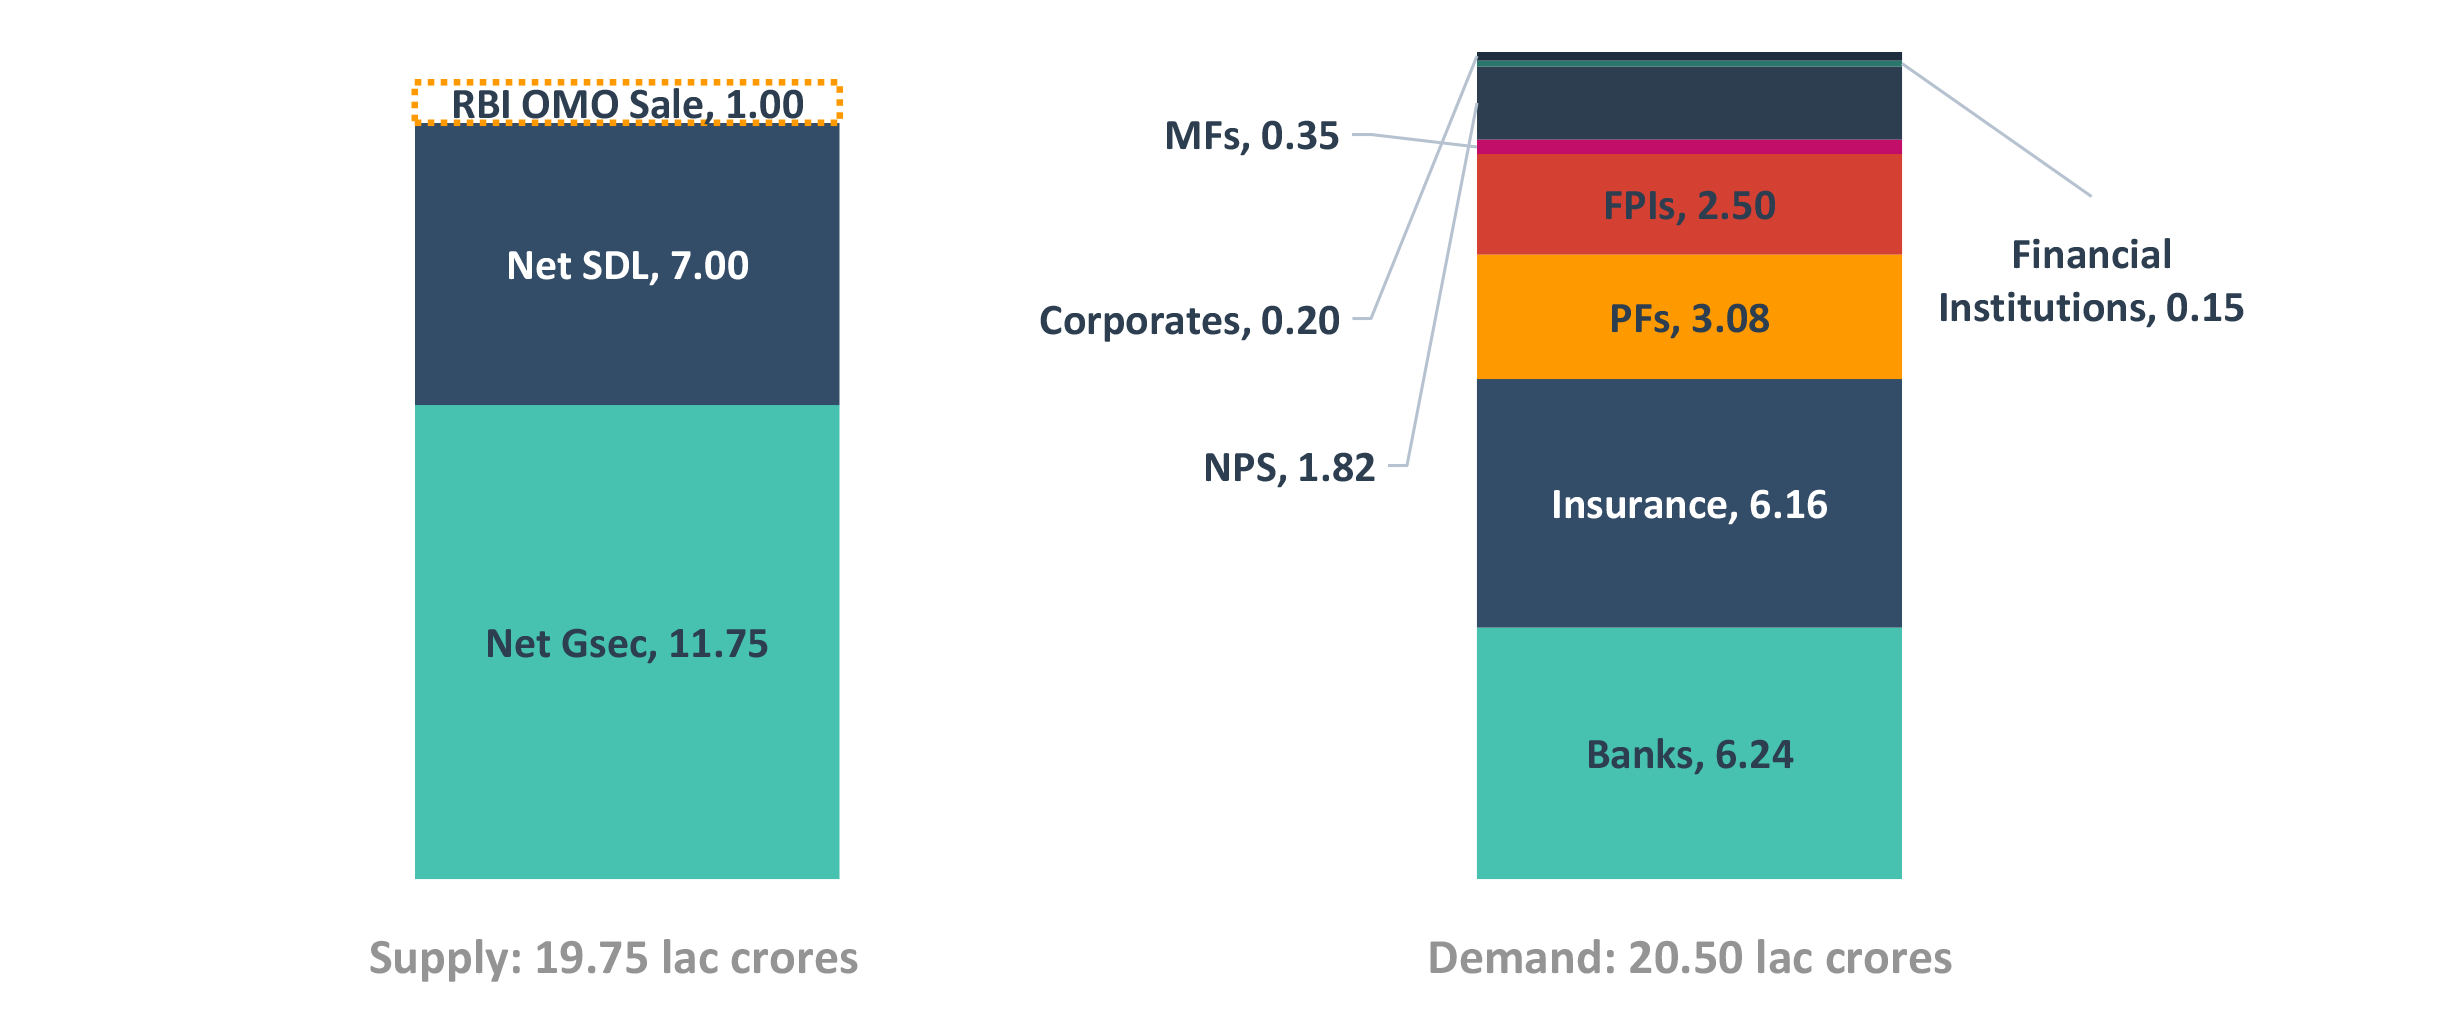
FPI buying to drive excess demand in FY25
Takeaway:
Estimated excess demand of ₹ 0.75 lac crores.
Source – Internal, CGA G-Sec: Government Securities; OMO: Open Market Operation; RBI: Reserve Bank of India; FPI: Foreign Portfolio Investment; NPS: National Pension System; MF: Mutual Fund; SDL: State Development Loans; SLR: Statutory Liquidity Ratio; PF: Provident Fund; EPFO: Employees’ Provident Fund Organisation; NSSF: National Small Savings Fund
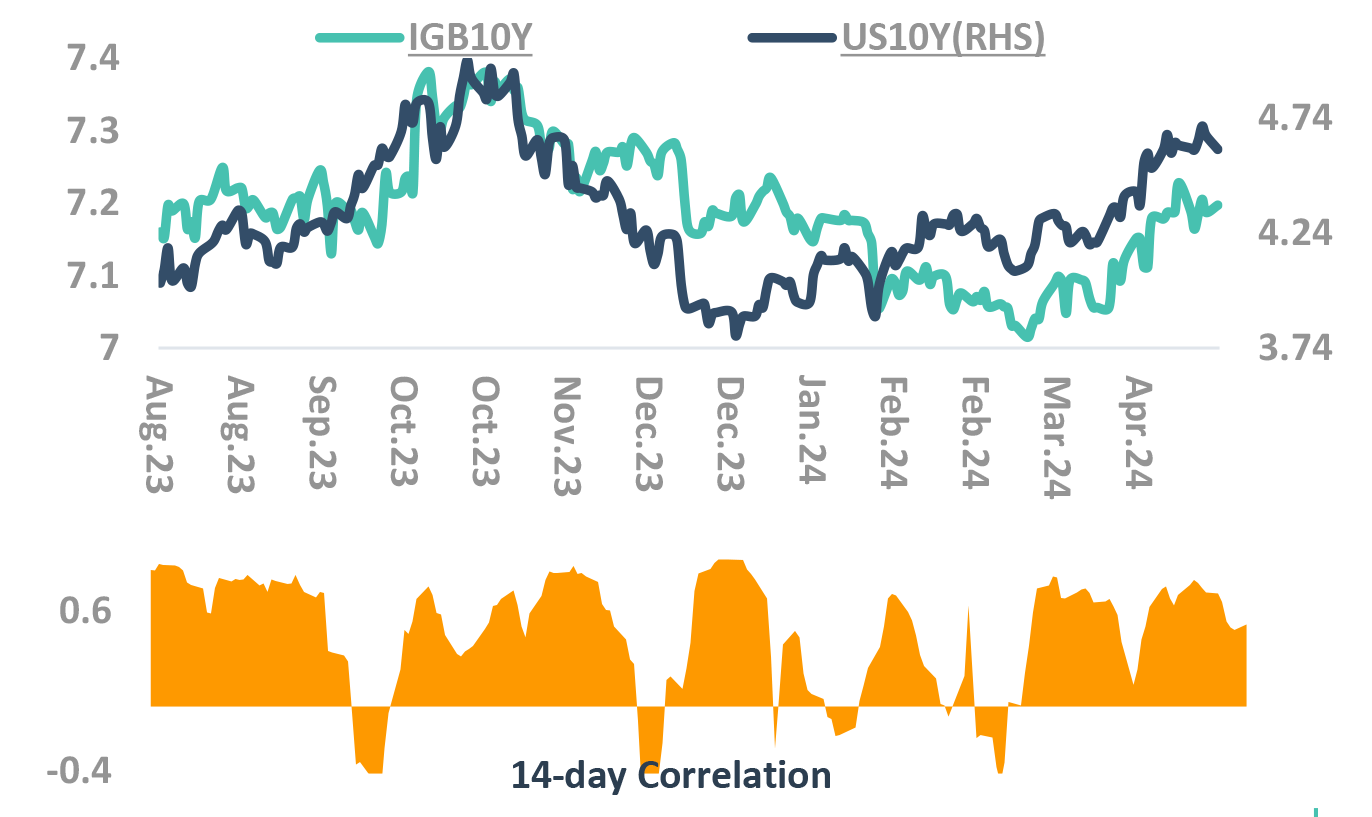
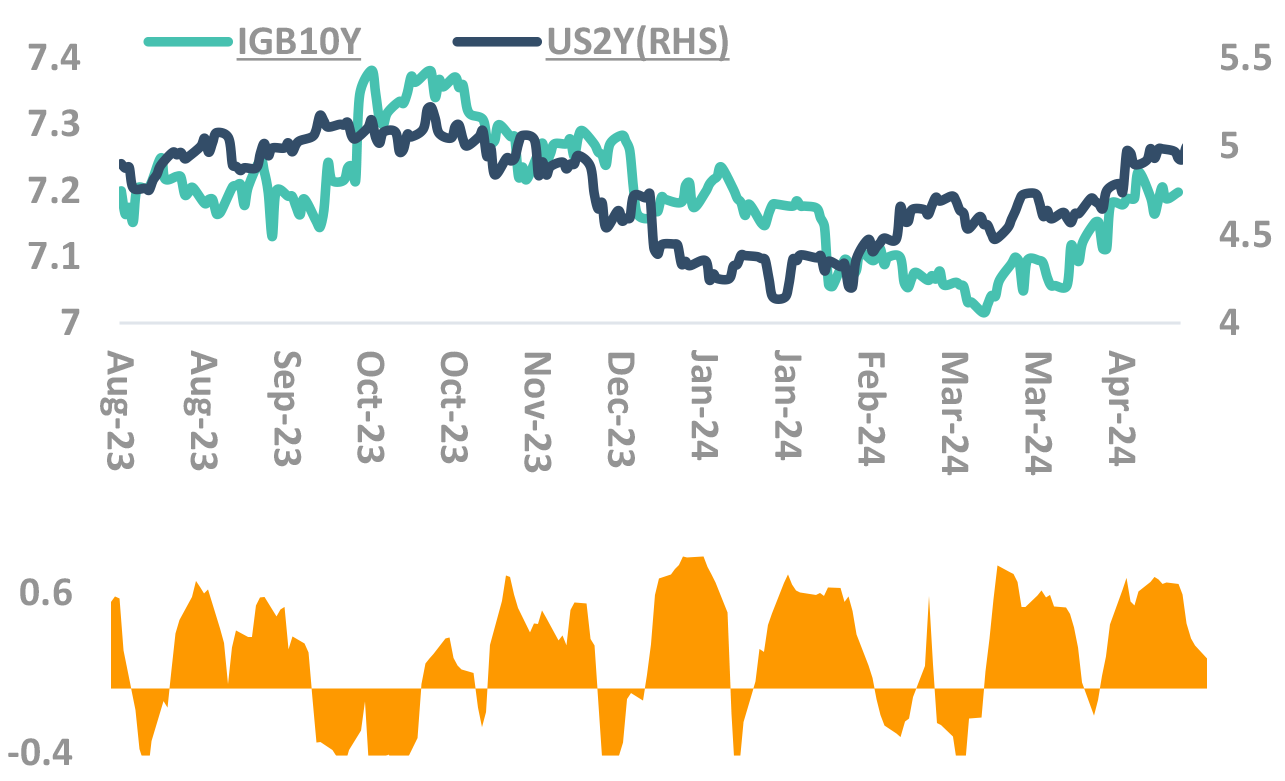
Indian yields tracking Global yields
But with lopsided beta
Impact of US yields on Indian yields
Takeaway:
Expect correlation, but with lopsided beta
Source – Bloomberg, Internal Fed: Federal Reserve; CPI: Consumer Price Inflation; RBI: Reserve Bank of India; IGB: India Government Bond; FOMC: Federal Open Market Committee; UST: US Treasury
Money Market Assessment Framework
Takeaway:
Money market yields have rallied since the peak post the end of the quarter as anticipated, driven by positive banking system liquidity. However, absence of significant govt. spending until the end of elections to keep liquidity tight and rates elevated.
CIC: Currency in Circulation; CD: Certificate of Deposits; OMO: Open Market Operations; VRR: Variable Rate Repo; VRRR: Variable Rate Reverse Repo; RBI: Reserve Bank of India: GOI: Govt of India
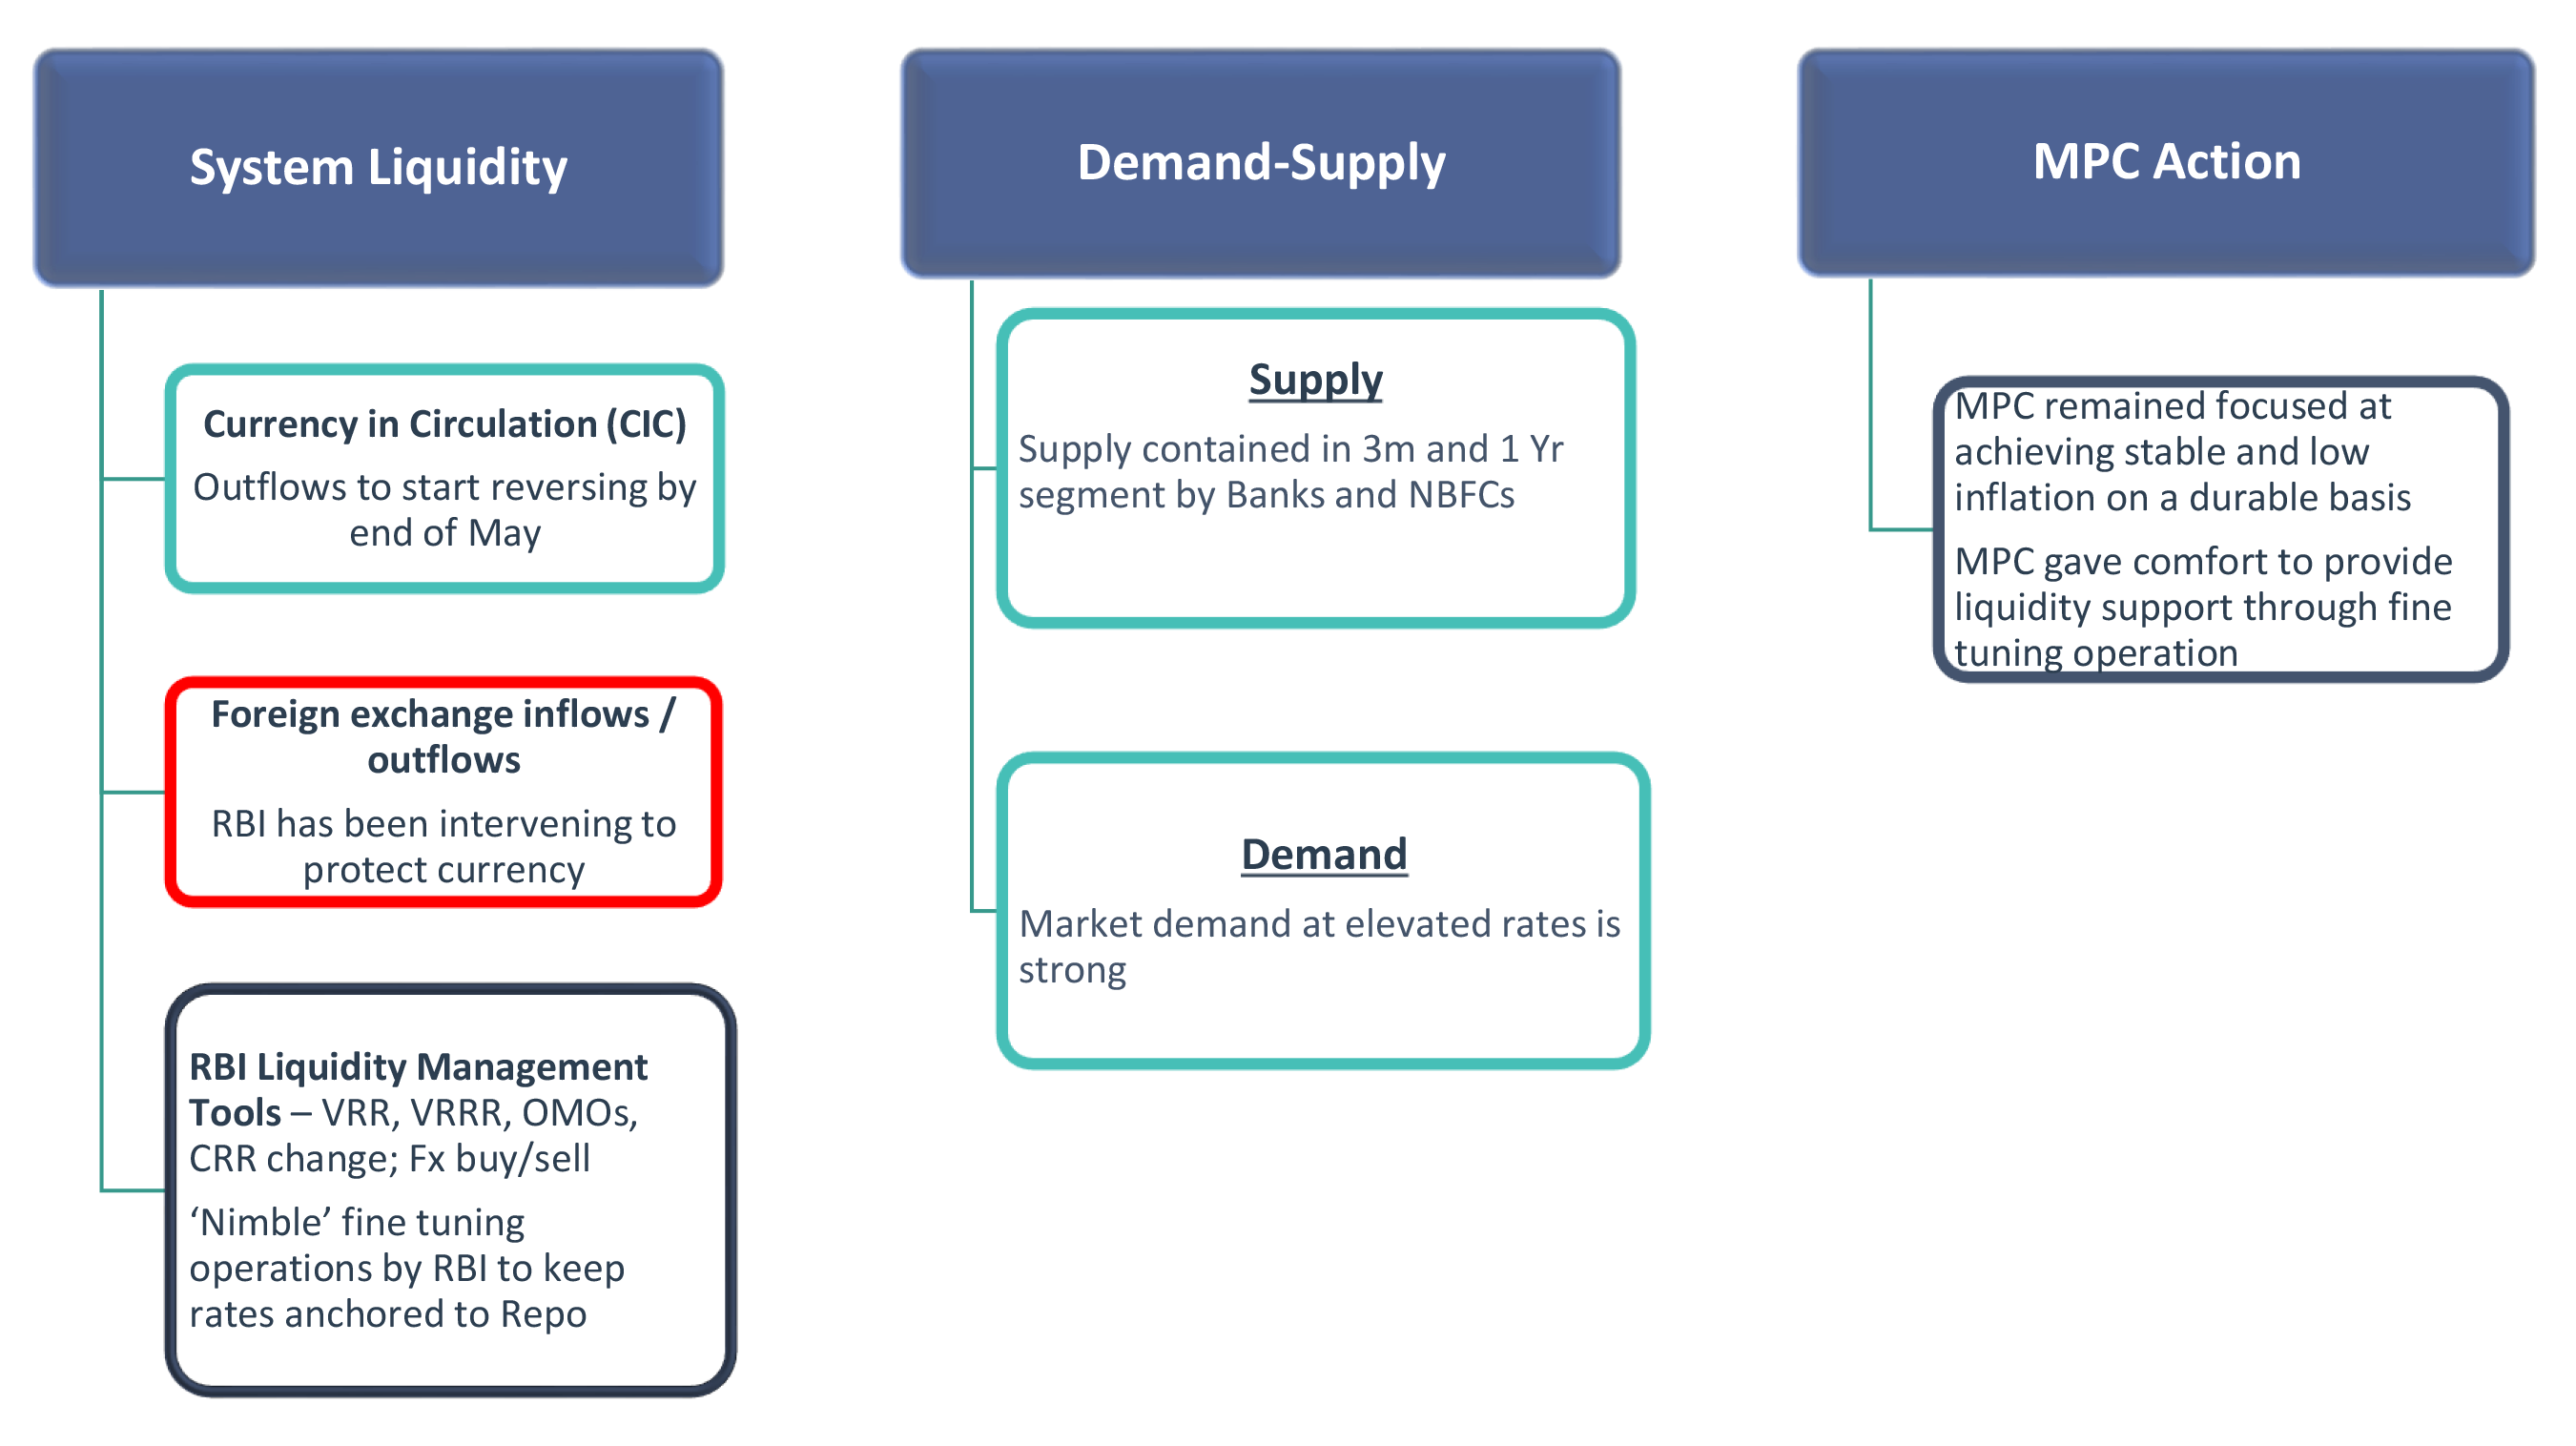
Banking system liquidity tightens with low govt. spending
Banking system liquidity has tightened
- After a brief spell of positive liquidity period in the first fortnight of April
- This had led to significant compression of money market rates; which have been inching up again
-
RBI is very actively managing banking liquidity
- Continuous VRR and VRRRs to maintain call rates closer to policy rate
- This is a reaffirmation of MPCs existing stance
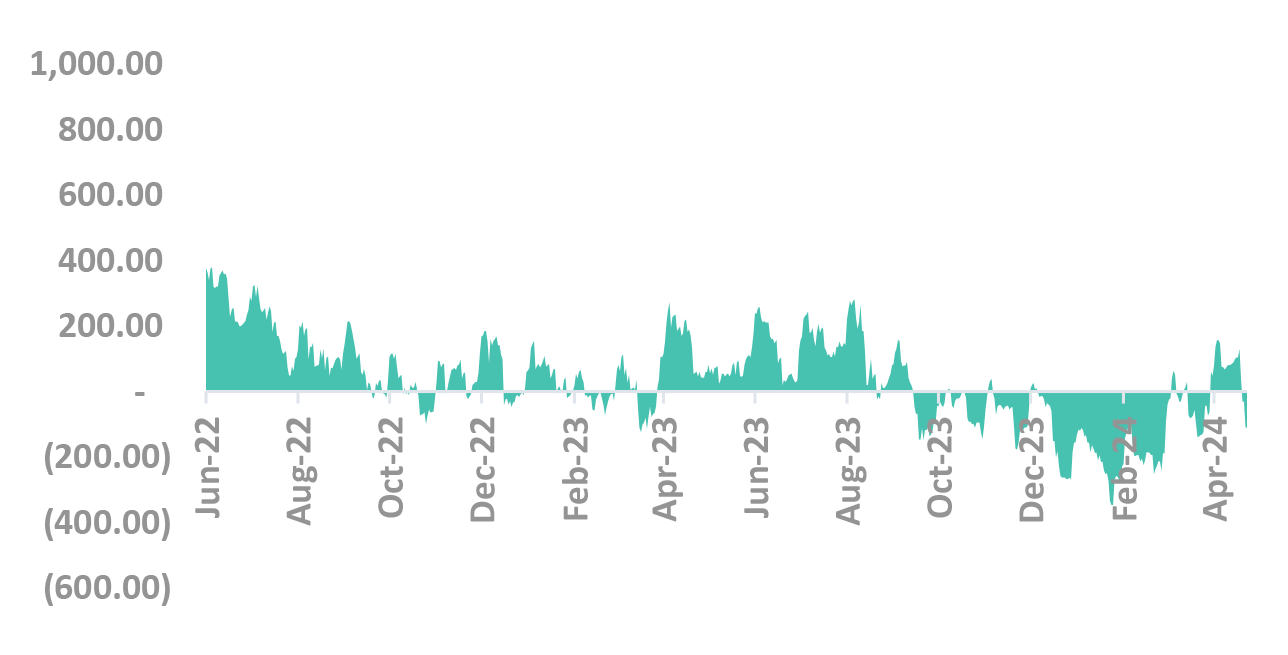
-
Expect banking system liquidity to remain tight
- Absence of significant govt. spending has led to tight liquidity
- Until the end of elections we do not anticipate significant spending to come in
- Intervention by RBI in the forex market to protect INR has also caused liquidity to tighten
- However, we are almost at the beginning of CIC reversal season which will aid liquidity
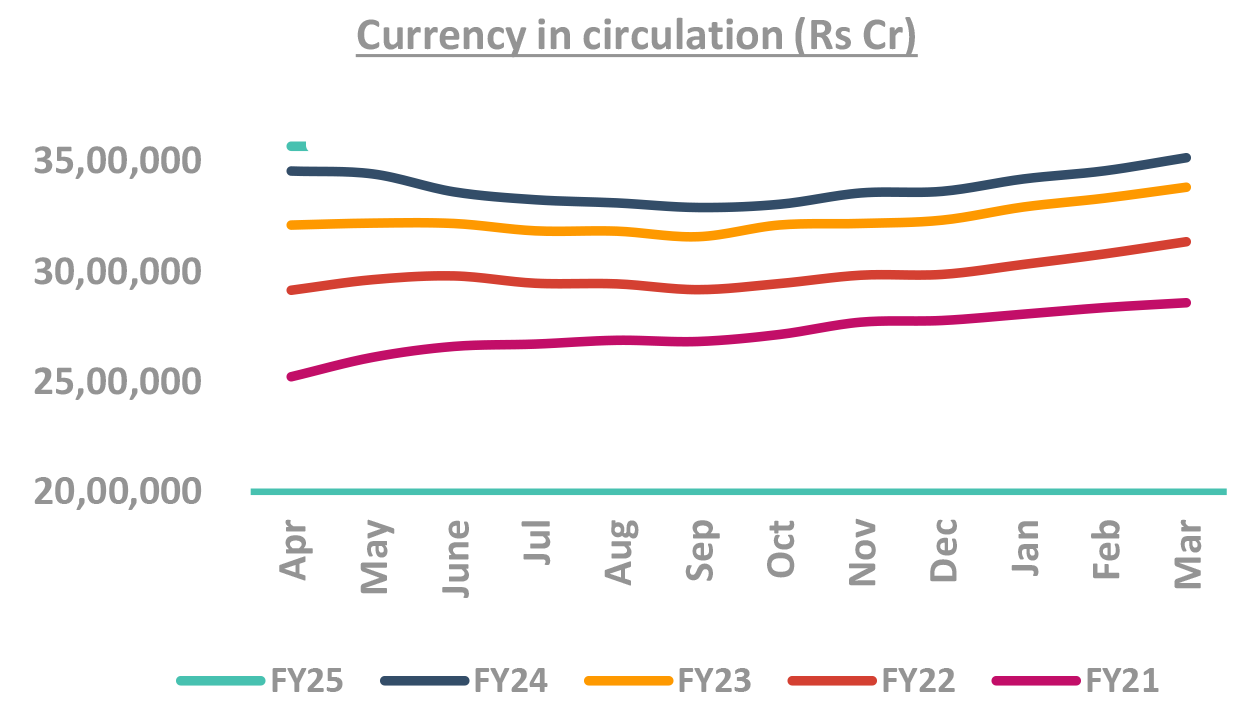
Takeaway:
We expect tight liquidity to continue until the end of elections, to keep money market rates elevated
G-Sec – Government Securities; CIC: Currency in Circulation Source – Bloomberg, RBI, *Internal Estimates
No significant supply pressure, yet tight liquidity to keep rates elevated
-
Money market rates rallied with improved liquidity conditions. 1YCD-Repo spreads have shrunk from highs of 140bps as on March 2024 end to about 115bps now.
-
With CIC outflow and high tax outflows liquidity position has tightened. 1YCD-Repo spreads reversed from lows of 105bps to 115bps currently.
With lesser maturities this quarter CD supply to remain contained. Outstanding CDs currently at INR 3.6 lakh cr vs INR 3.5 lakh cr on January 24

Takeaway:
While supply remains contained, tight liquidity to keep money market rates elevated.
CD: Certificate of Deposits *Internal Estimates
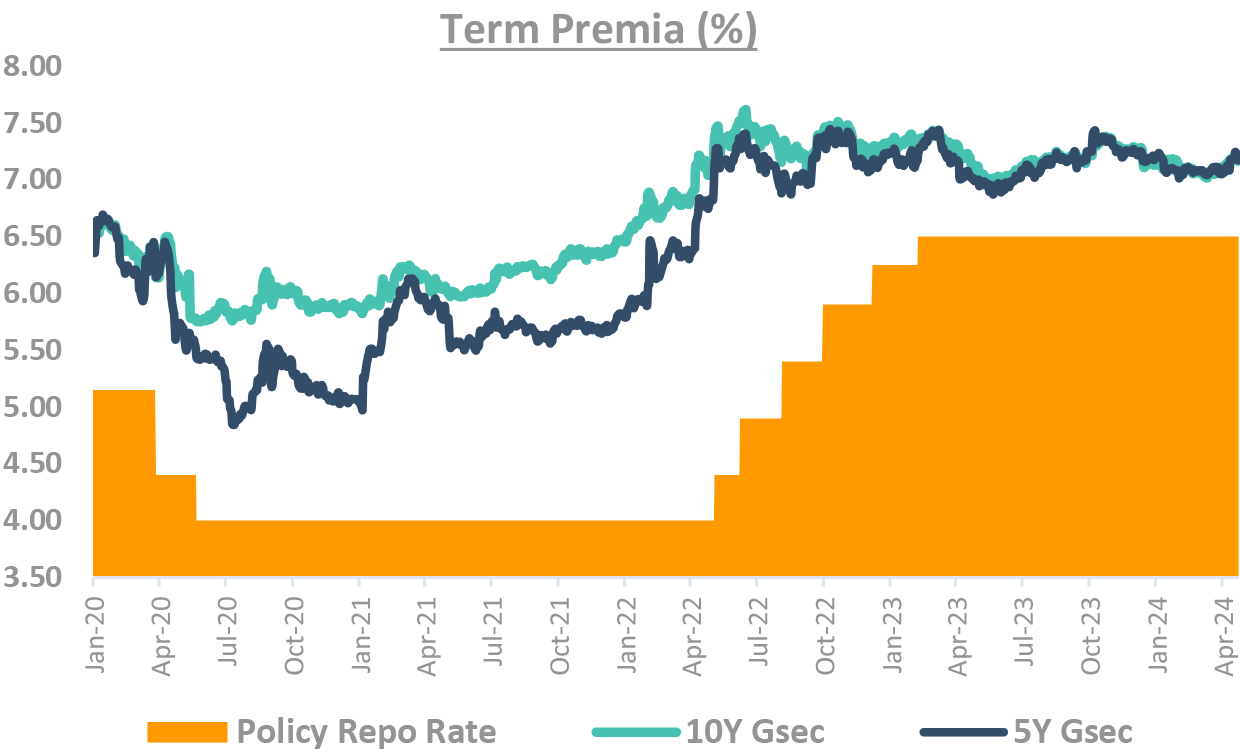
Term premia is still not low
-
Term premium falls sharply before rate cuts
- This time, the slope of the fall is much less
- If rate cuts get priced, the spread of 70bp will be high
-
Why do we prefer slope, not absolute levels?
- The slope removes the underlying demand/supply dynamics and thus can be compared across time
-
Even absolute levels are attractive
- Even absolute levels are attractive from prior regimes preceding rate cuts
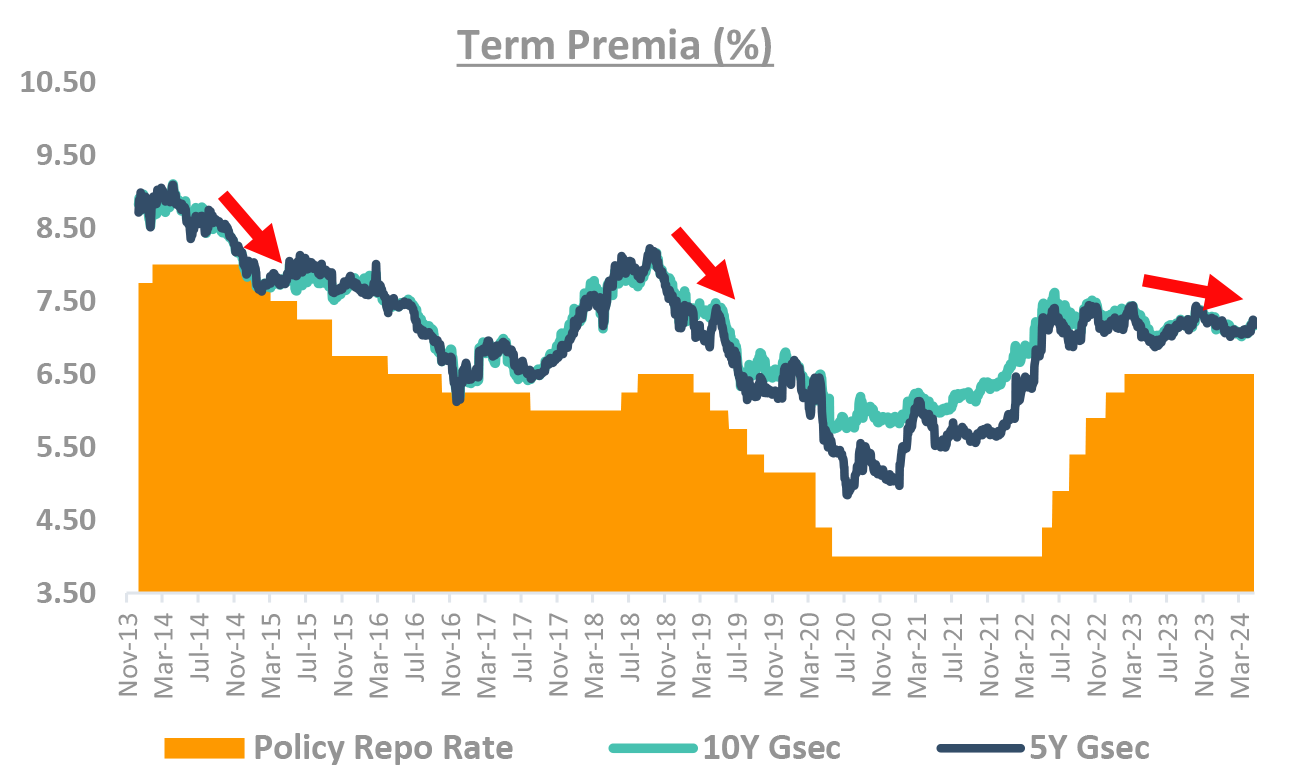
-
Term premia: function of demand/supply and rate expectation
- During covid term premia high
- Supply high: Govt increased fiscal deficit
- Repo rates were expected to rise
- Post covid term premia fall is natural
- Supply low: reduced FY25 supply, FPI flows
- Rates are expected to fall
- During covid term premia high
-
The trend of high demand, low supply strong
- Unlikely that govt will leave fiscal consolidation
Takeaway:
Term premia is still attractive given favorable demand supply dynamics
Source – Bloomberg
DSP FI Framework checklist
DSP Duration decision:
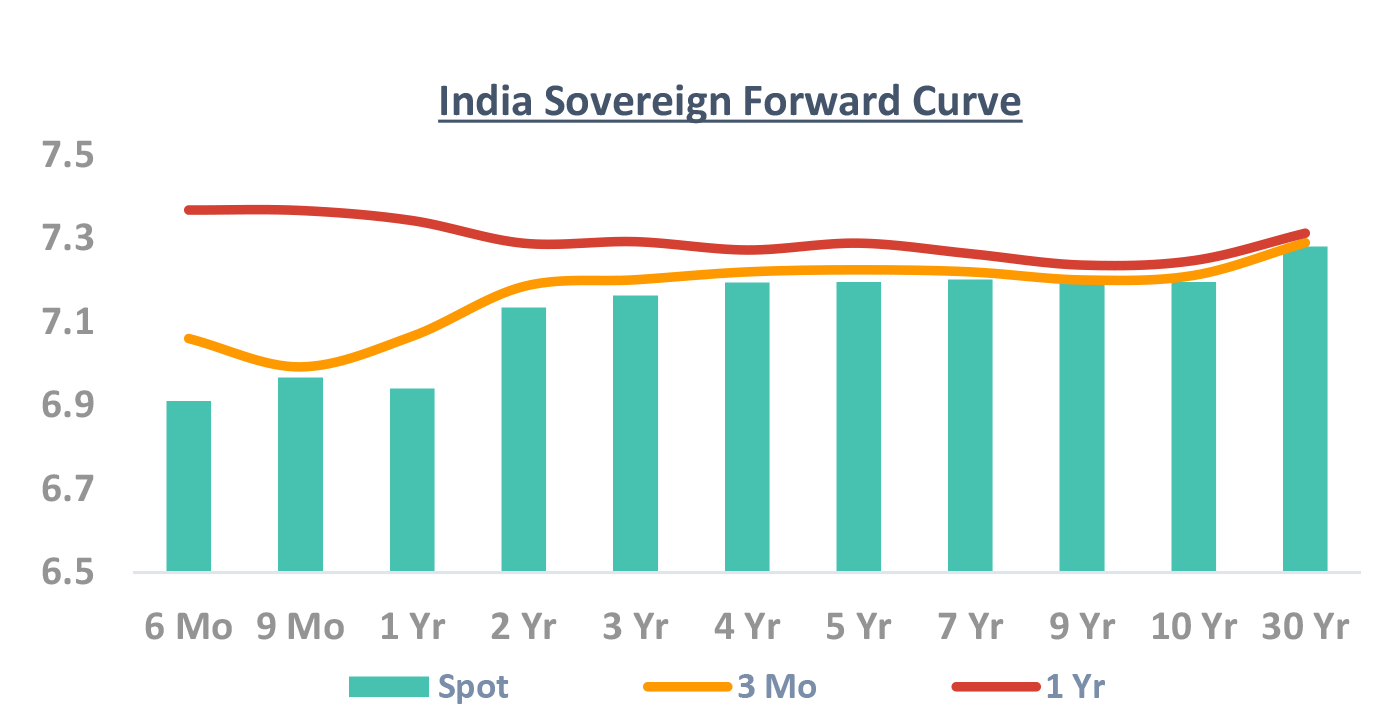
The chart shows how much expected yield fall/rise is already
priced in the current curve.
Large gap between the current yield and forward yield shows
that yield change is priced in – and thus yield change will not
give capital gain/loss.
Similarly small gap means that the market is not pricing change
in yields.
Short-term yields (2Y-5Y) may rally more than long term (7Y+)
- The forward curve is inverted, we think that it is unlikely to realize
Yet, long term yields may end up making more money
- The duration of 30Y is 4x the duration of 4Y bond
- i.e. for every 40bp fall of 4Y, the 30Y bond needs to fall only 10bp
- Even if curve bull steepens by 30bp, long bonds give similar value

Source – Bloomberg; as on 30/Apr/24
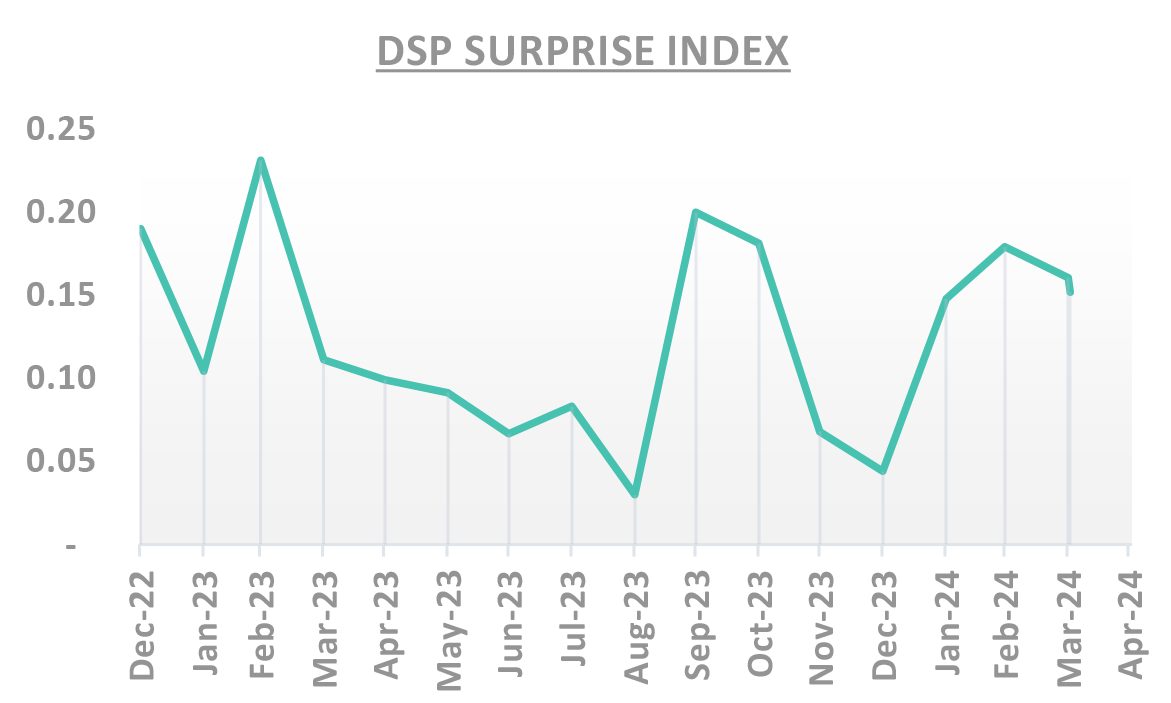
Introducing DSP “SURPRISE” Index
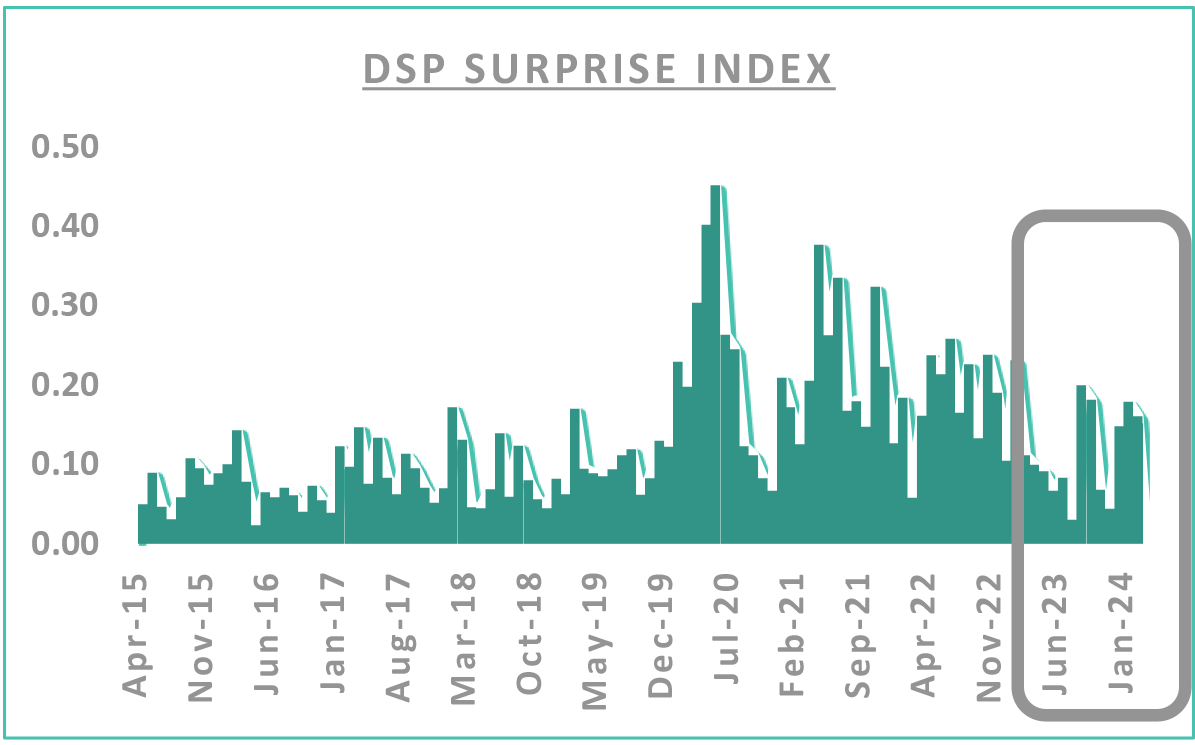
DSP Surprise Index: An alert to manage the risks!
-
In last 1-Year
- The index spiked in Feb 23, Oct 23 and Apr 24
- During these times, the markets were most volatile
- We found our funds had reasonable underperformance
-
Interpretation
- During high DSP Surprise Index times, we would prefer to rationalize our risks.
- During low DSP Surprise Index times, we would prefer to run conviction trades
Takeaway:
When Index high -> cut risks. When Index low-> execute view optimally
We have discussed duration and yield movement.
How do we choose corporates and credit?
DSP Asset Allocation:
-
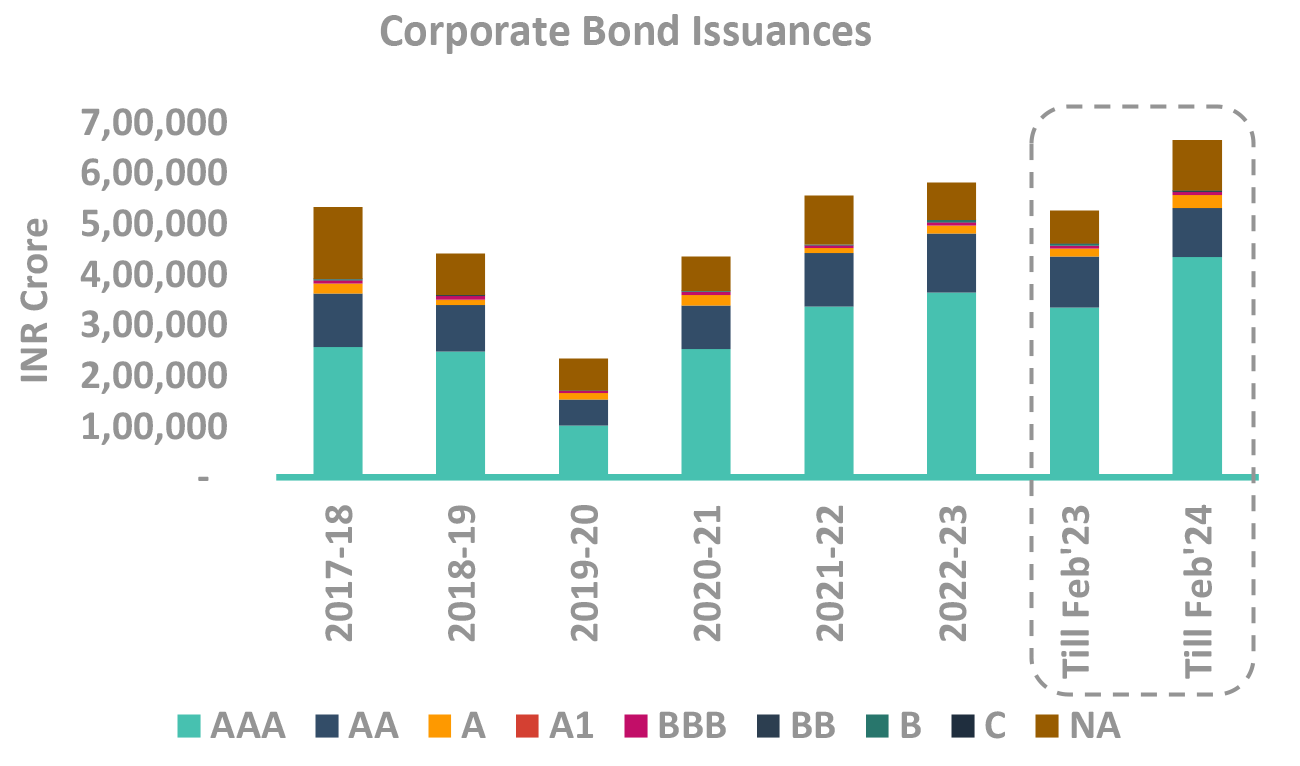
Supply has remained manageable so far
- Issuance in FY24 has increased by 14% compare to previous FY. Total Issuances has touched INR 8.15Lakh crore.
- Supply in AAA PSU and NBFC has grown moderately by 6-8%, whereby Corporate Issuances has sharply moved up by 70%.
- Supply in March lower (sequentially) at ~79k crores
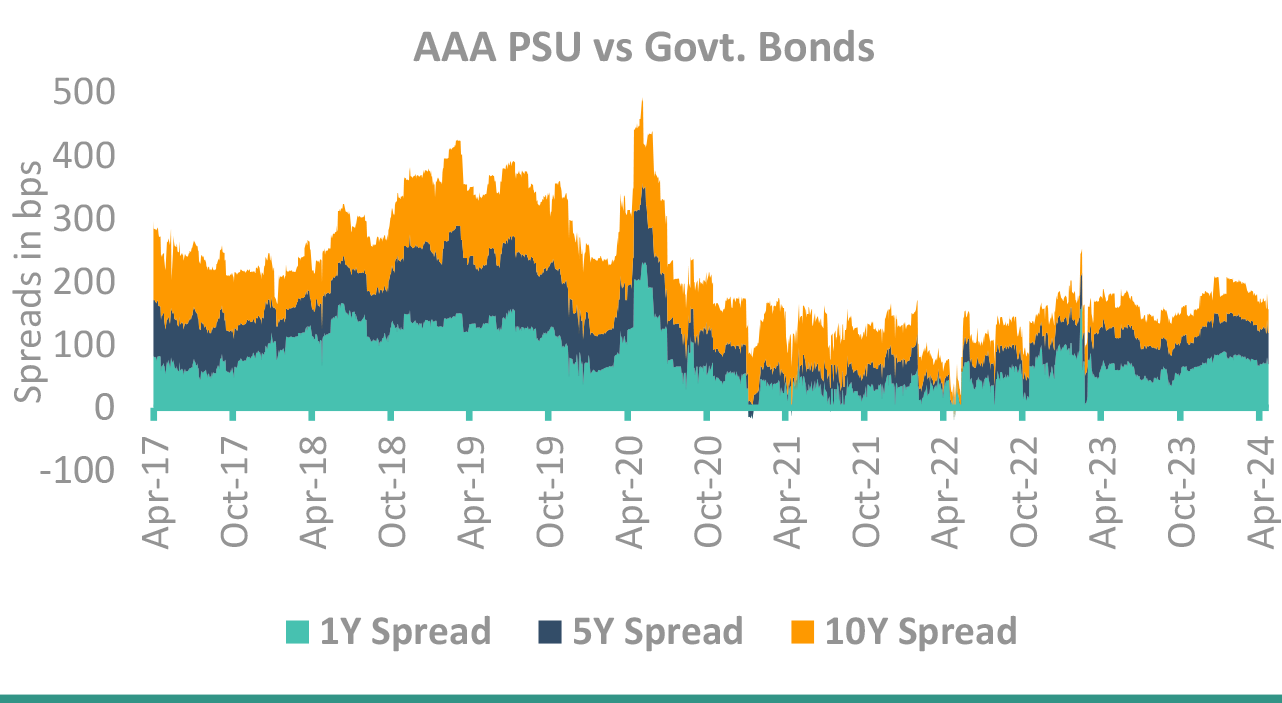
- 2-3Y NBFC Spreads are at high of 100-110 bps, whereby AAA PSU spreads are currently at 50bps.
-
Corporate bond spreads steady
- In FY24 Corporate spreads moved in 45-65bps and NBFC Spreads remained steady at around 100bps.
- Long Term Issuances will continue to be well bided by real money investors.
- Issuances concentrated by large issuers like NABARD, SIDBI, PFC and some bank bonds
- Primary supply will pick up from Mid May especially from AAA PSU Segment.
Takeaway:
Corporate bond spreads expected to widen slowly and gradually in coming months(From 50bps to 60bps).
Comfortable liquidity and high carry is the only added advantage to remain invested in 1-3Y segment.
Source – Bloomberg, CCIL, Internal, PSU: Public Sector Undertaking, NBFC: Non-Bank Financial Companies
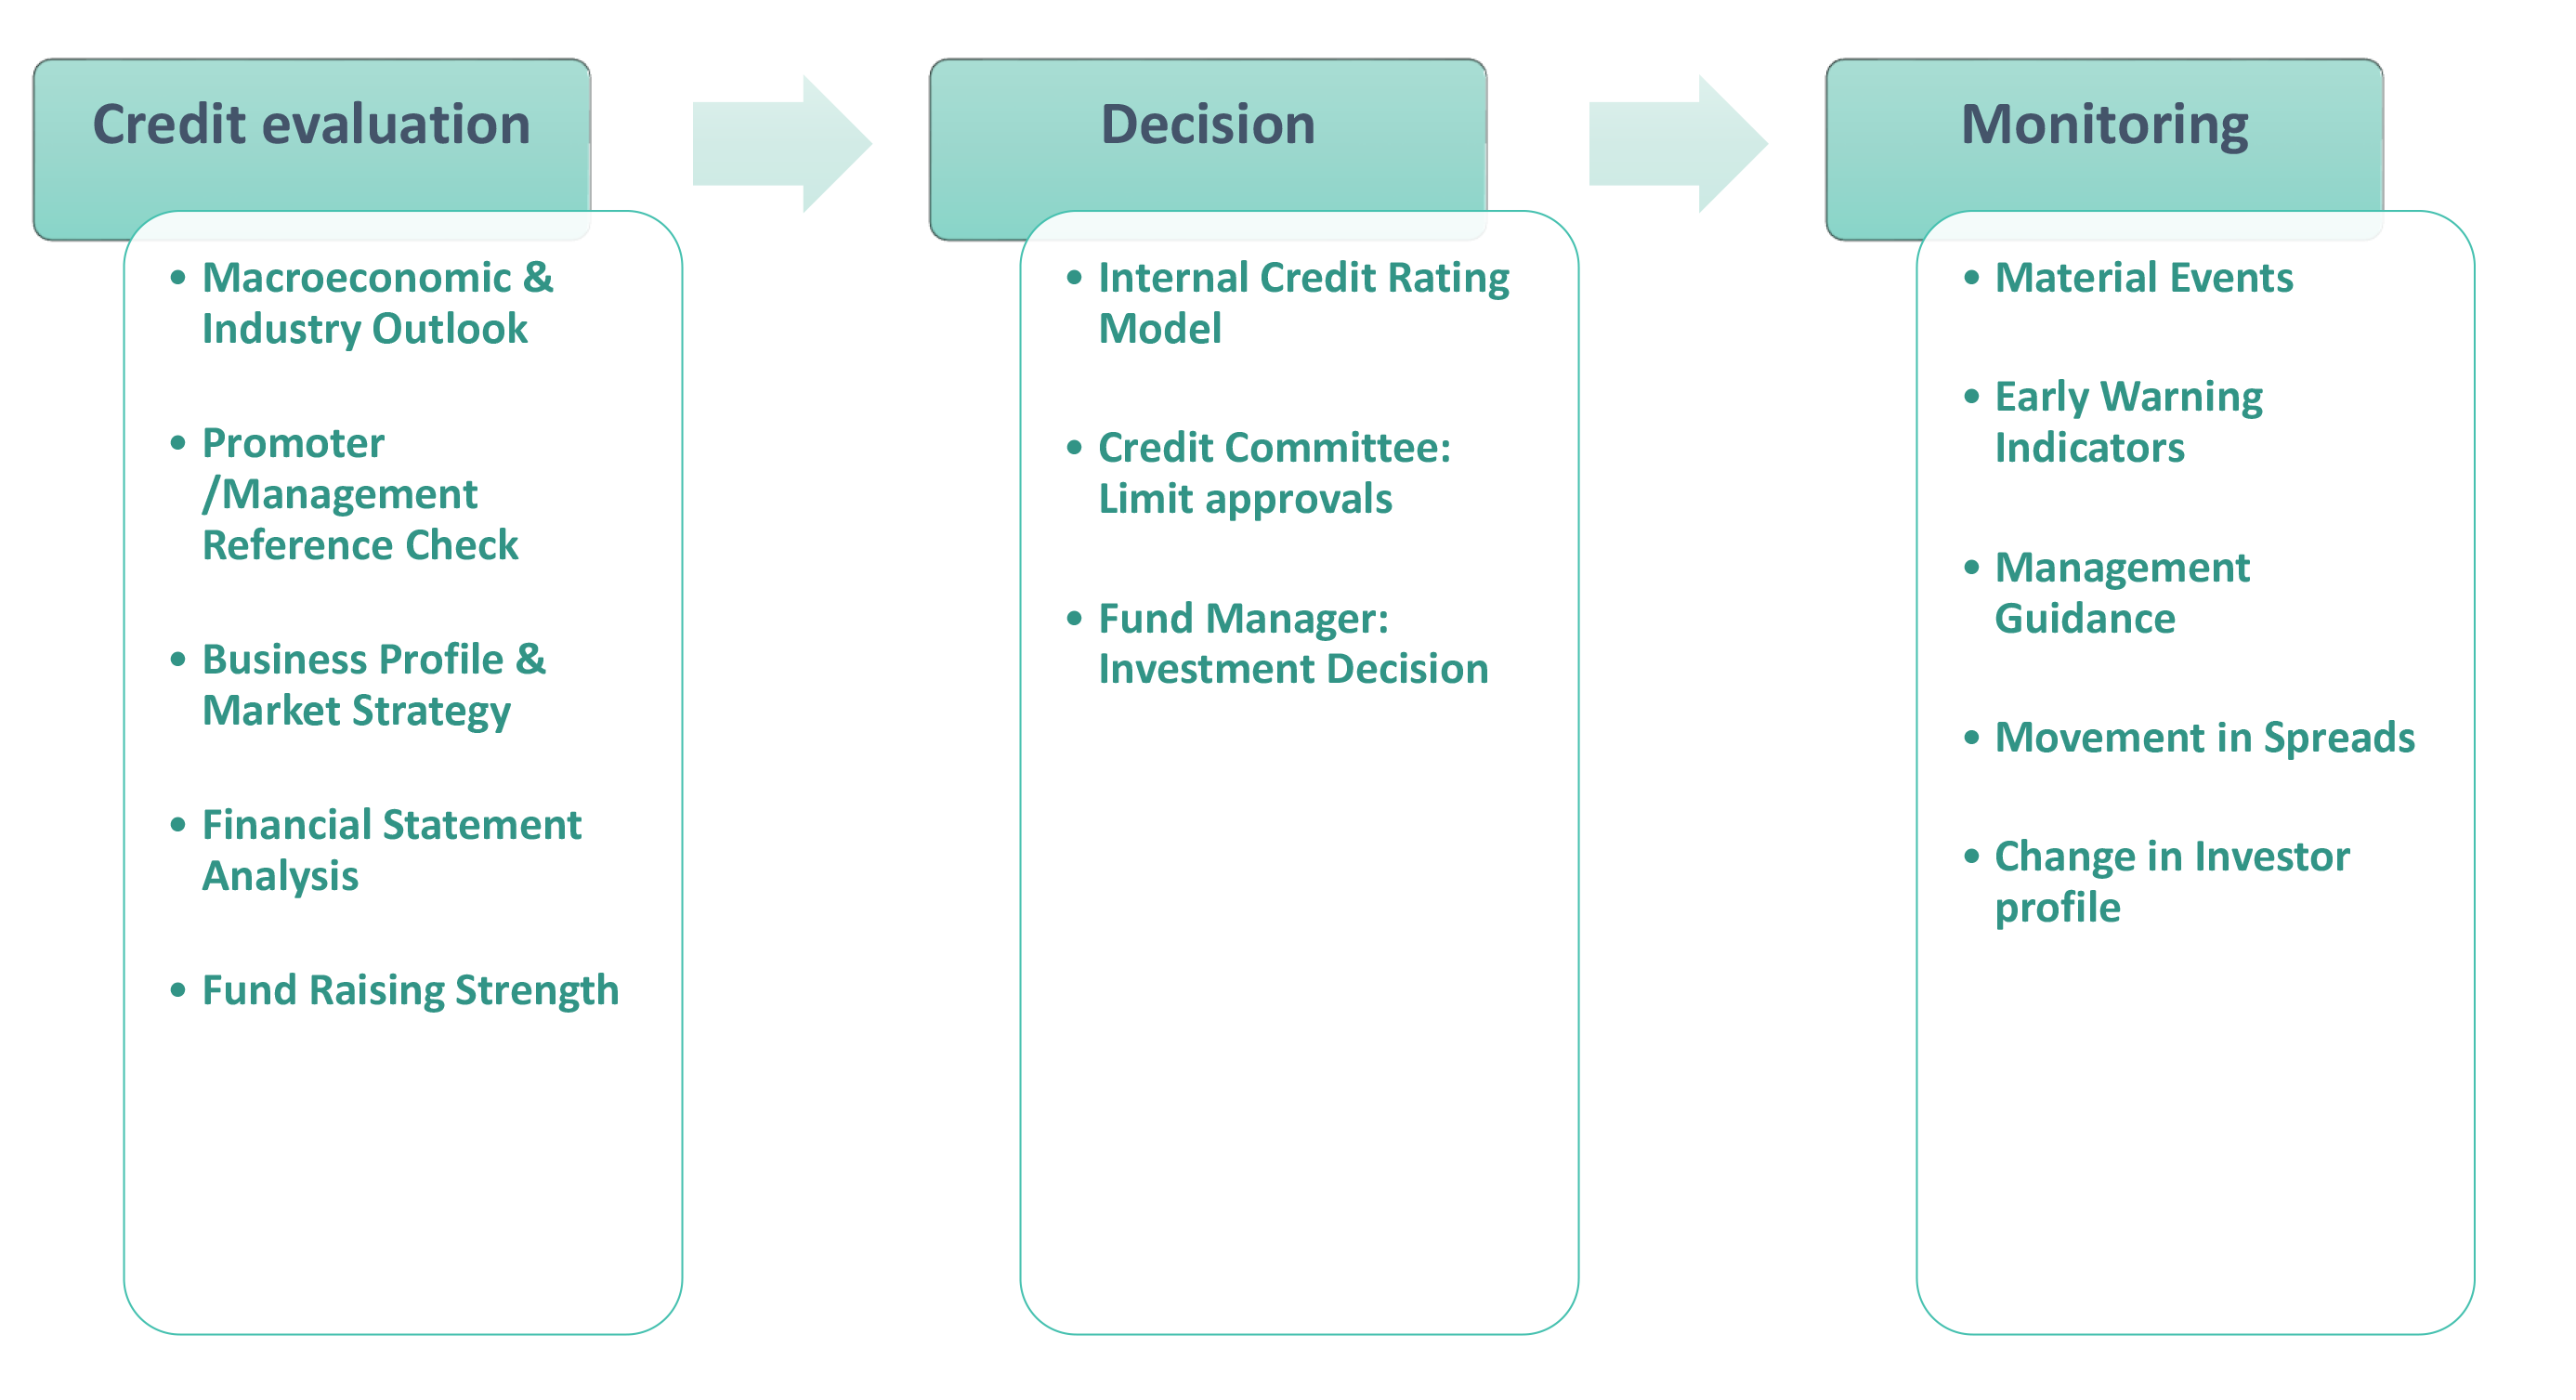
DSP Credit Investment Process – Focus on Governance
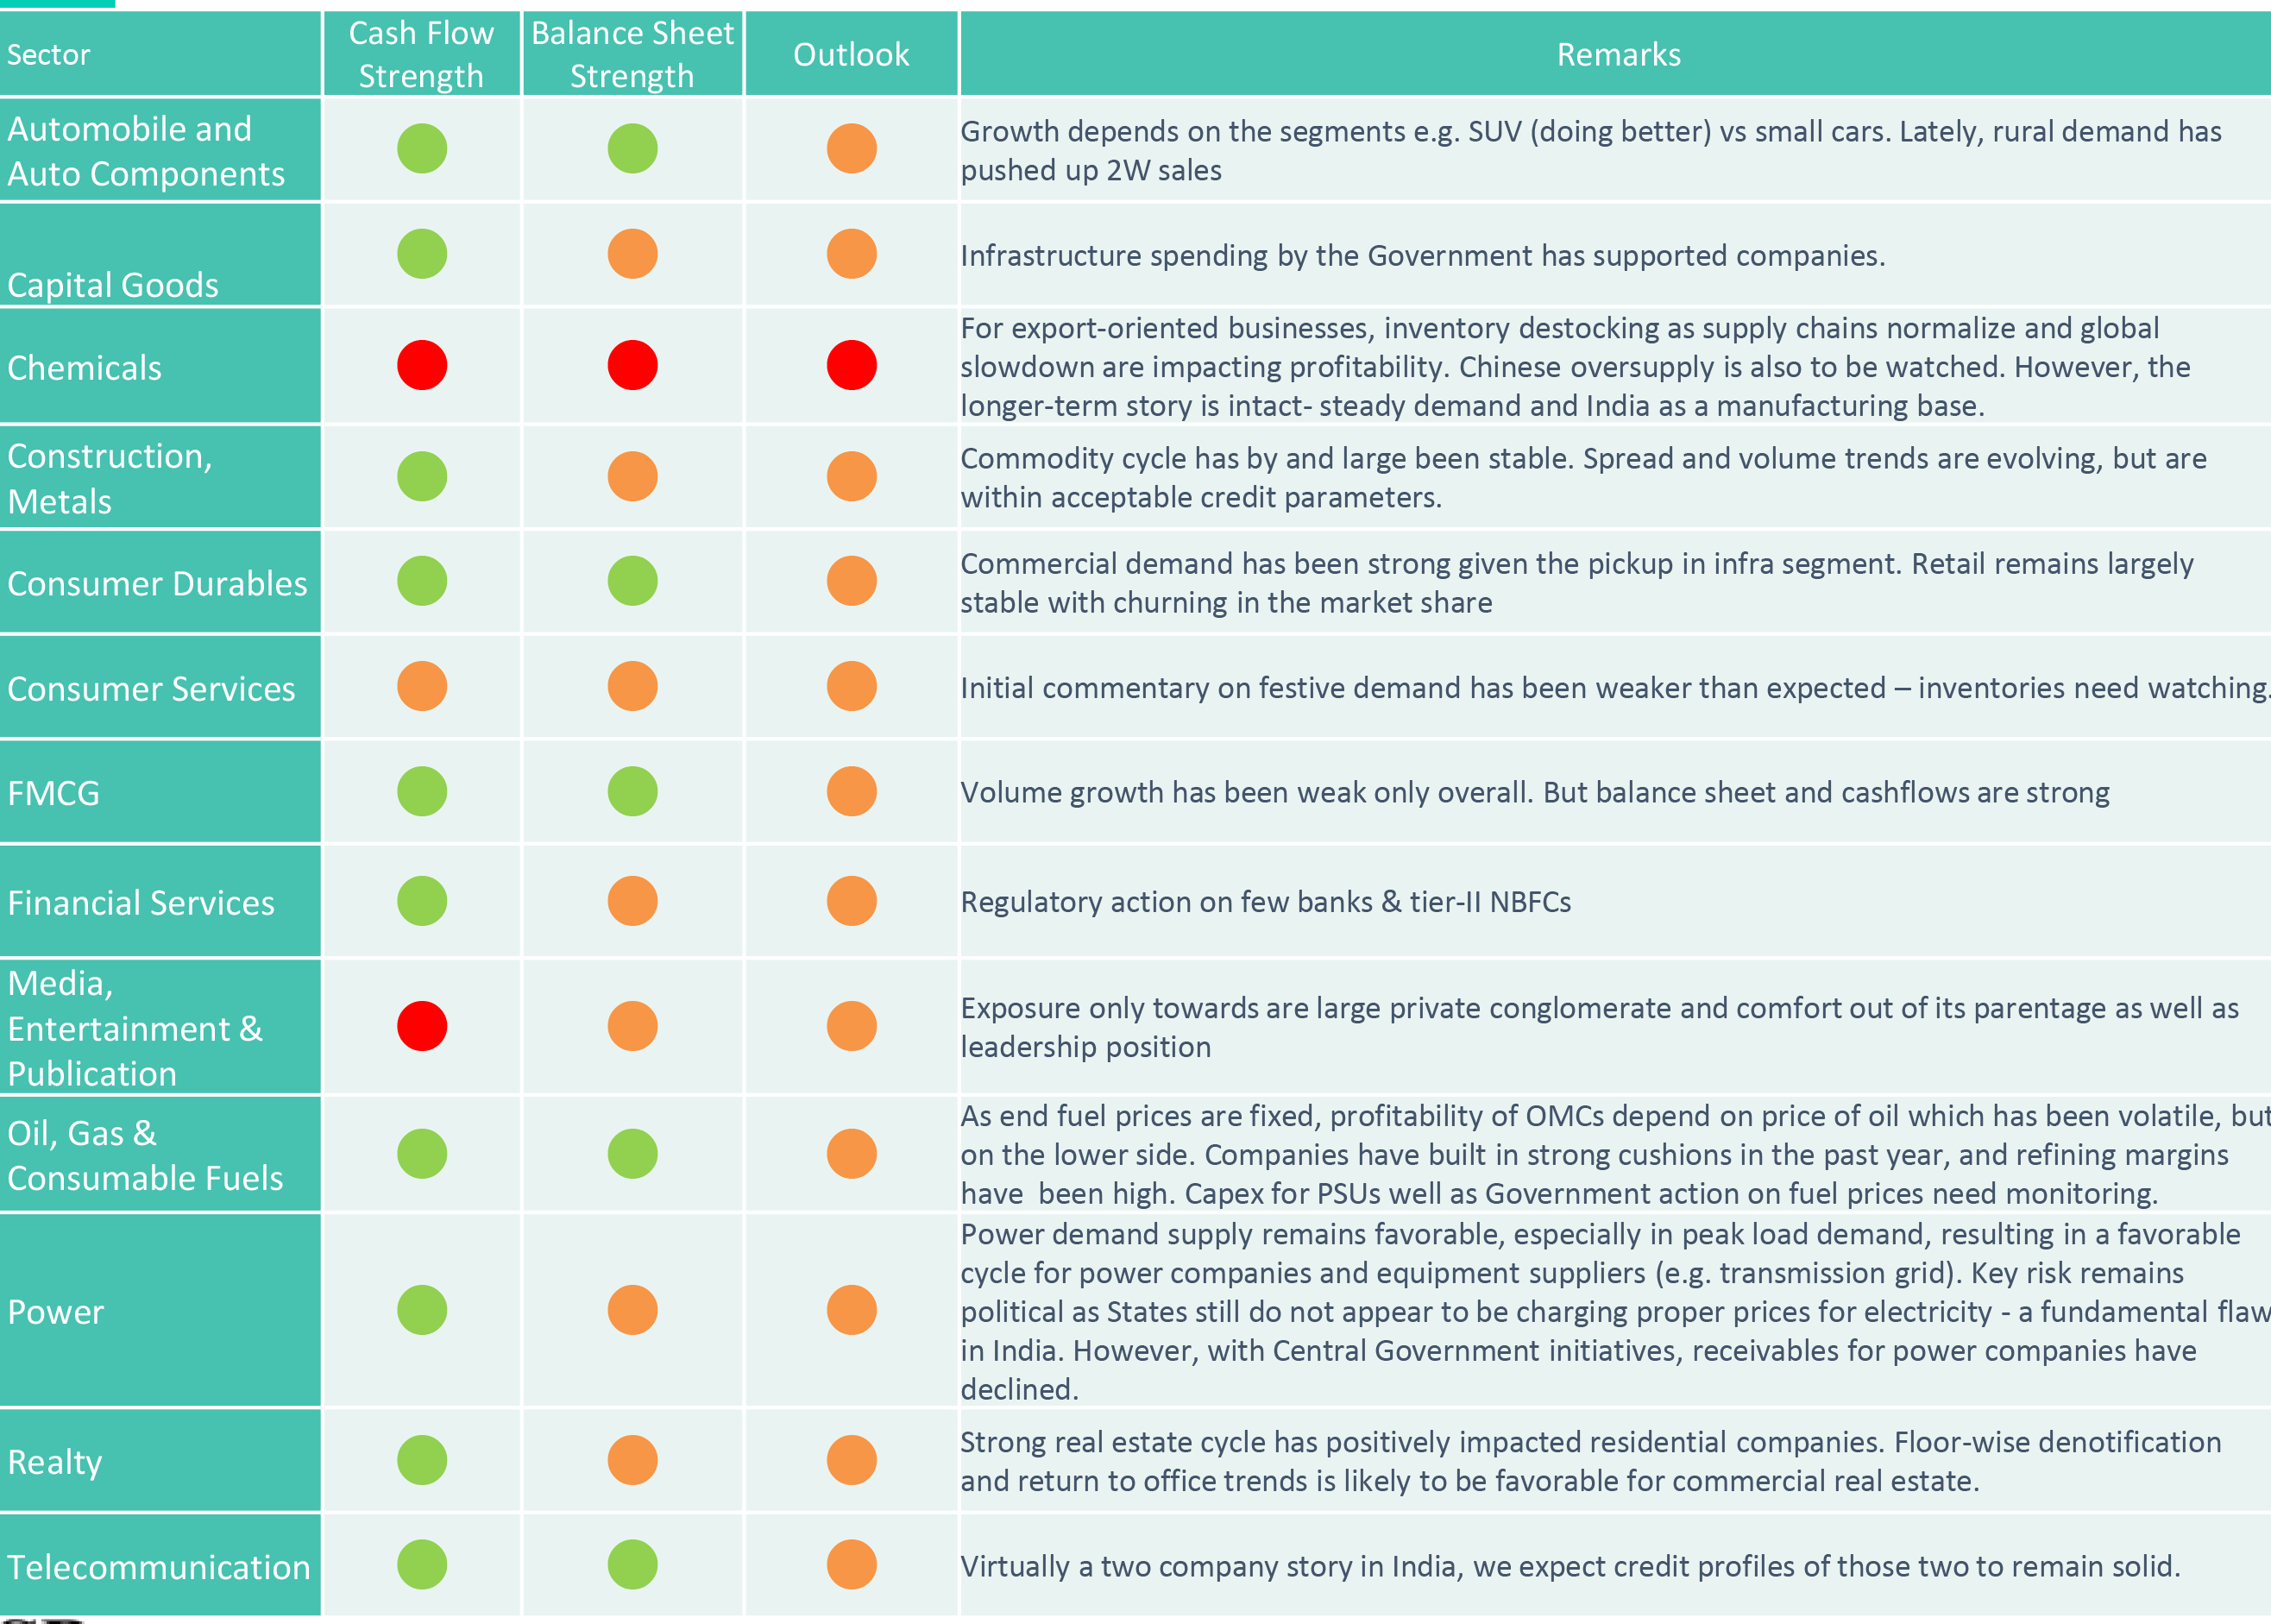
DSP Credit view on sectors
Done with our market view framework?
Now
Our Portfolio creation framework
DSP Portfolio Creation: Multi-step process
DSP Fixed Income Funds follow a defined methodology for fund portfolio construction
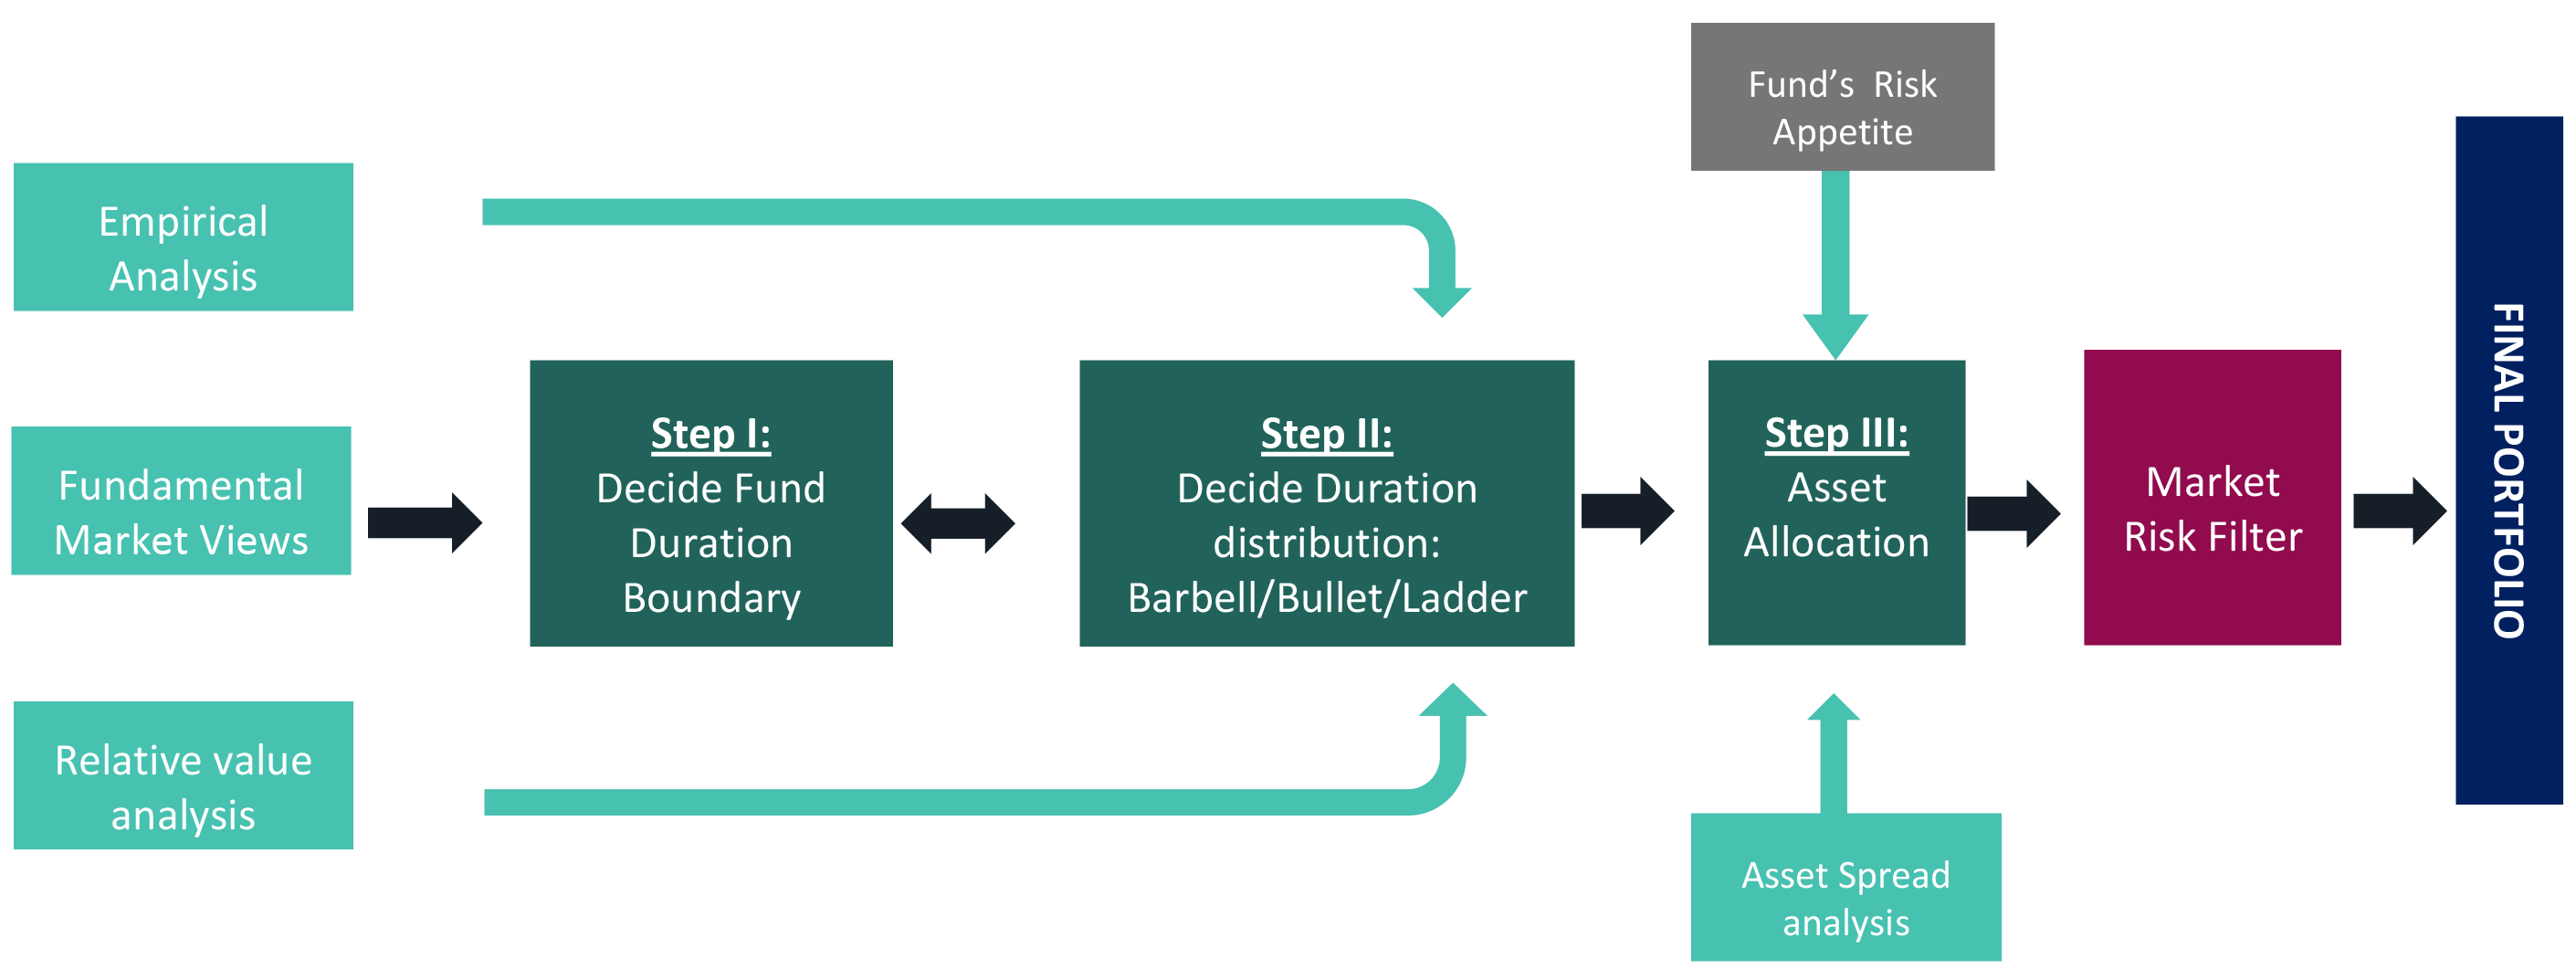
- We apply market risk filter which can help the Fund Managers not to take extreme risks. Thus, Value at Risk is limited by ensuring the positions are balanced.
Investment approach / framework/ strategy mentioned herein is currently followed & same may change in future depending on market conditions & other factors.
Key Risks associated with investing in Fixed Income Schemes
Interest Rate Risk - When interest rates rise, bond prices fall, meaning the bonds you hold lose value. Interest rate movements are the major cause of price volatility in bond markets.
Credit risk - If you invest in corporate bonds, you take on credit risk in addition to interest rate risk. Credit risk is the possibility that an issuer could default on its debt obligation. If this happens, the investor may not receive the full value of their principal investment.
Market Liquidity risk - - Liquidity risk is the chance that an investor might want to sell a fixed income asset, but they’re unable to find a buyer.
Re-investment Risk - If the bonds are callable, the bond issuer reserves the right to “call” the bond before maturity and pay off the debt. That can lead to reinvestment risk especially in a falling interest rate scenario.
Rating Migration Risk - - If the credit rating agencies lower their ratings on a bond, the price of those bonds will fall.
Other Risks
Risk associated with
- floating rate securities
- derivatives
- transaction in units through stock exchange Mechanism
- investments in Securitized Assets
- Overseas Investments
- Real Estate Investment Trust (REIT) and Infrastructure Investment Trust (InvIT)
- investments in repo of corporate debt securities
- Imperfect Hedging using Interest Rate Futures
- investments in Perpetual Debt Instrument (PDI)
 Account Statement
  Capital Gain Statement
  Key Information Memorandum
  PAN Updation
  Register / Modify KYC Online
  Nominee Registration
  Email / Phone Updation
  OTM / eNACH Registration
  Guidelines for Incapacitated Investors
  FAQs
FAQs Reach us


