Growth, Valuations & Opportunities
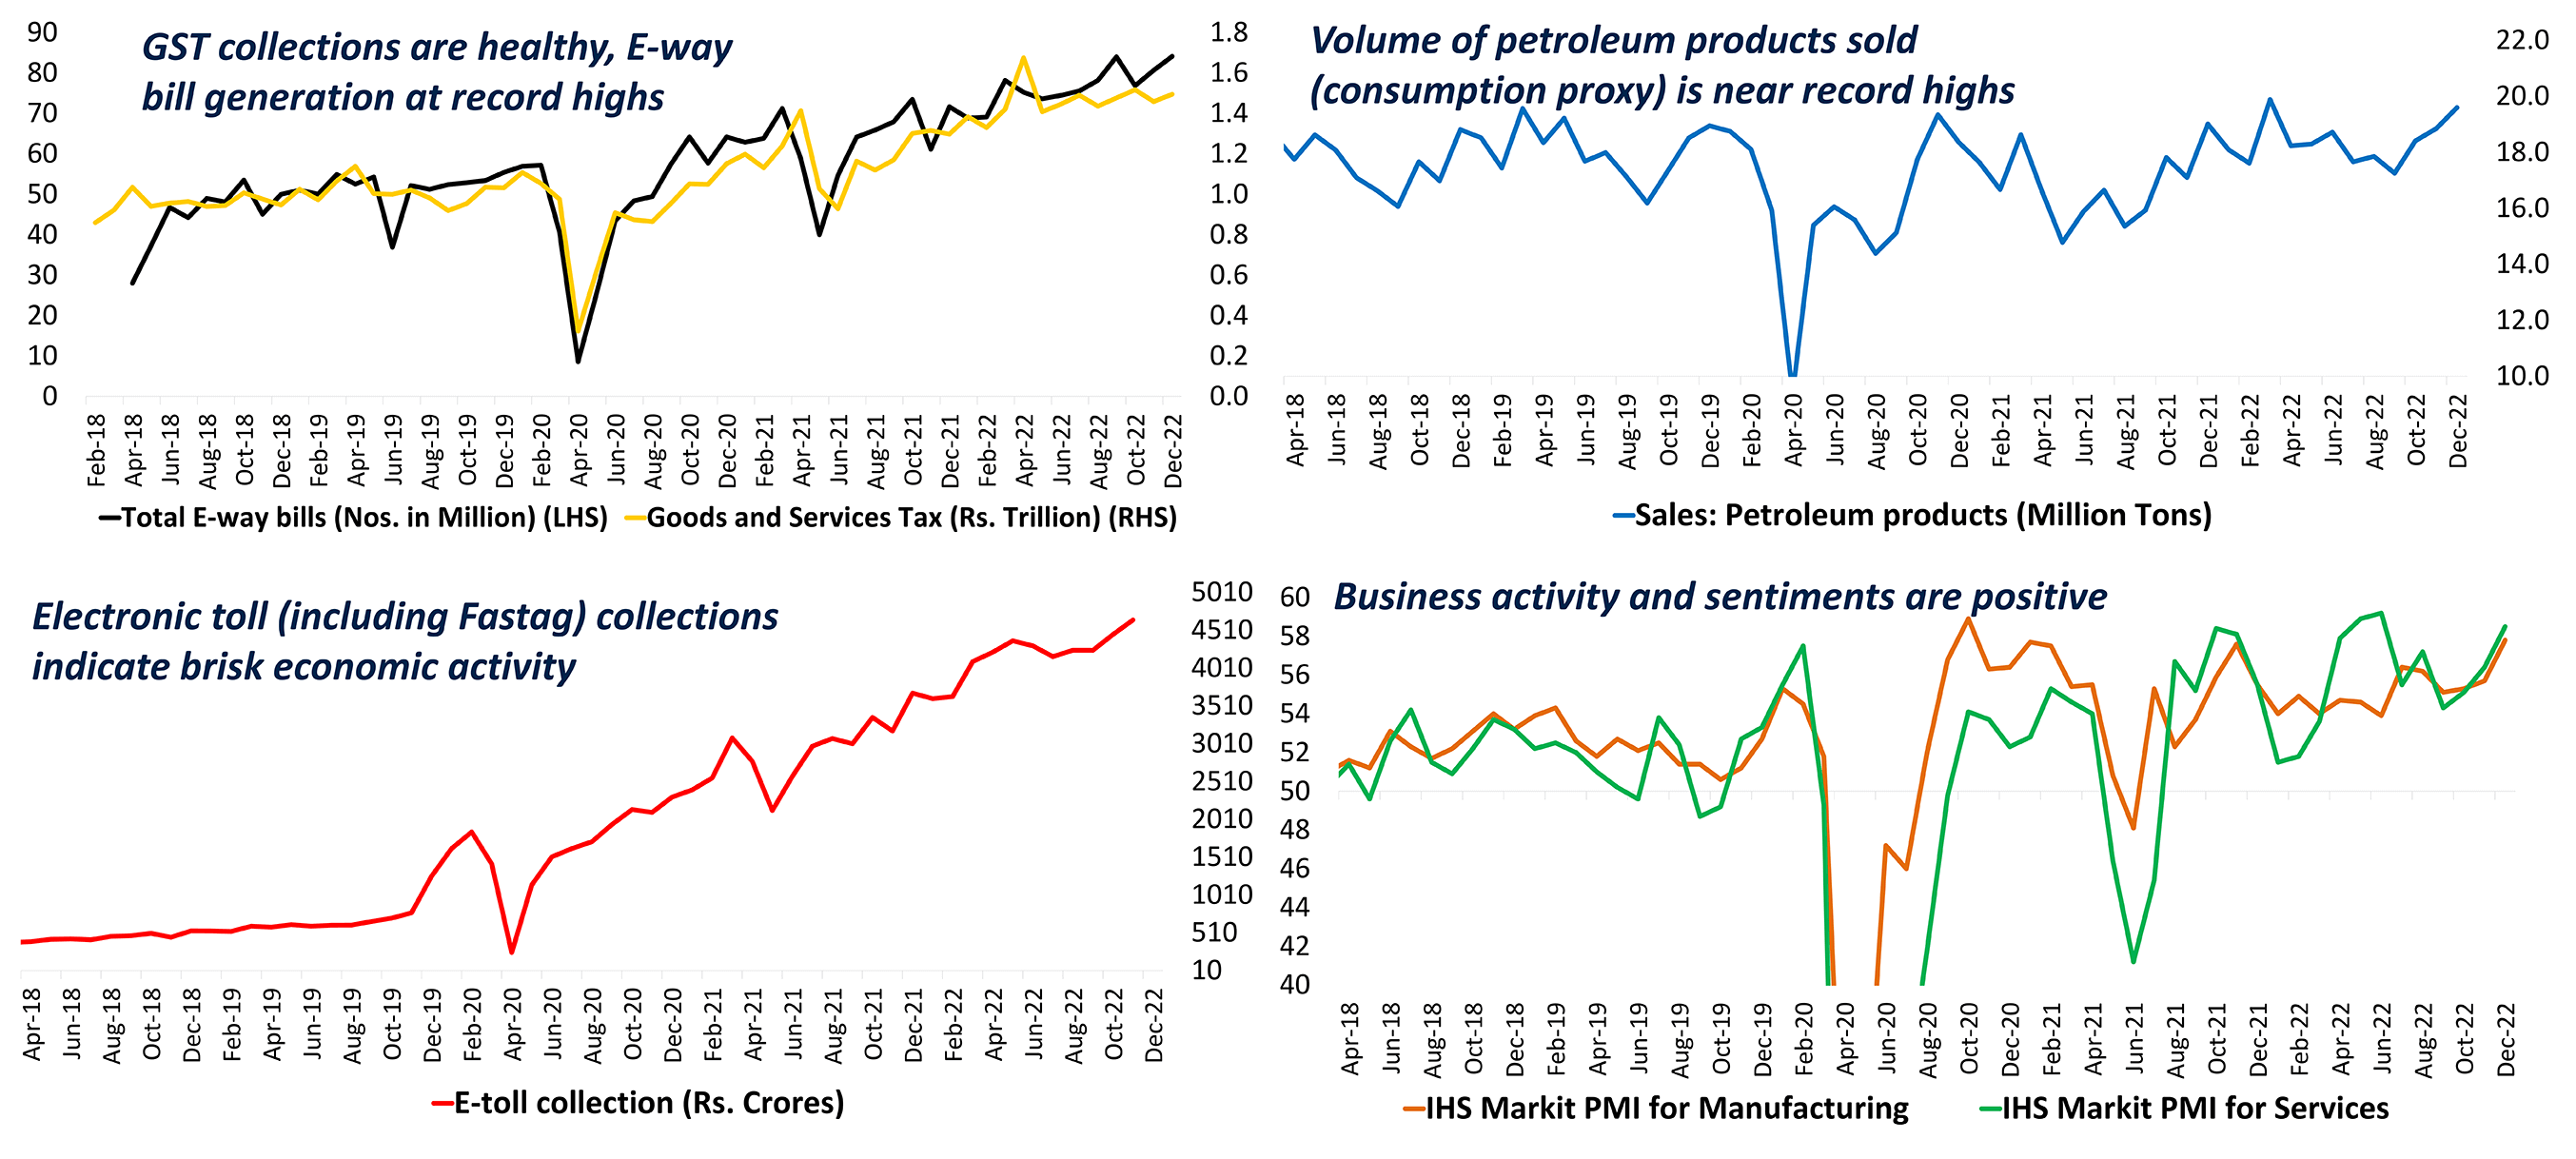
India High Frequency Indicators Are Robust
Source: CMIE, DSP As on Jan 2023
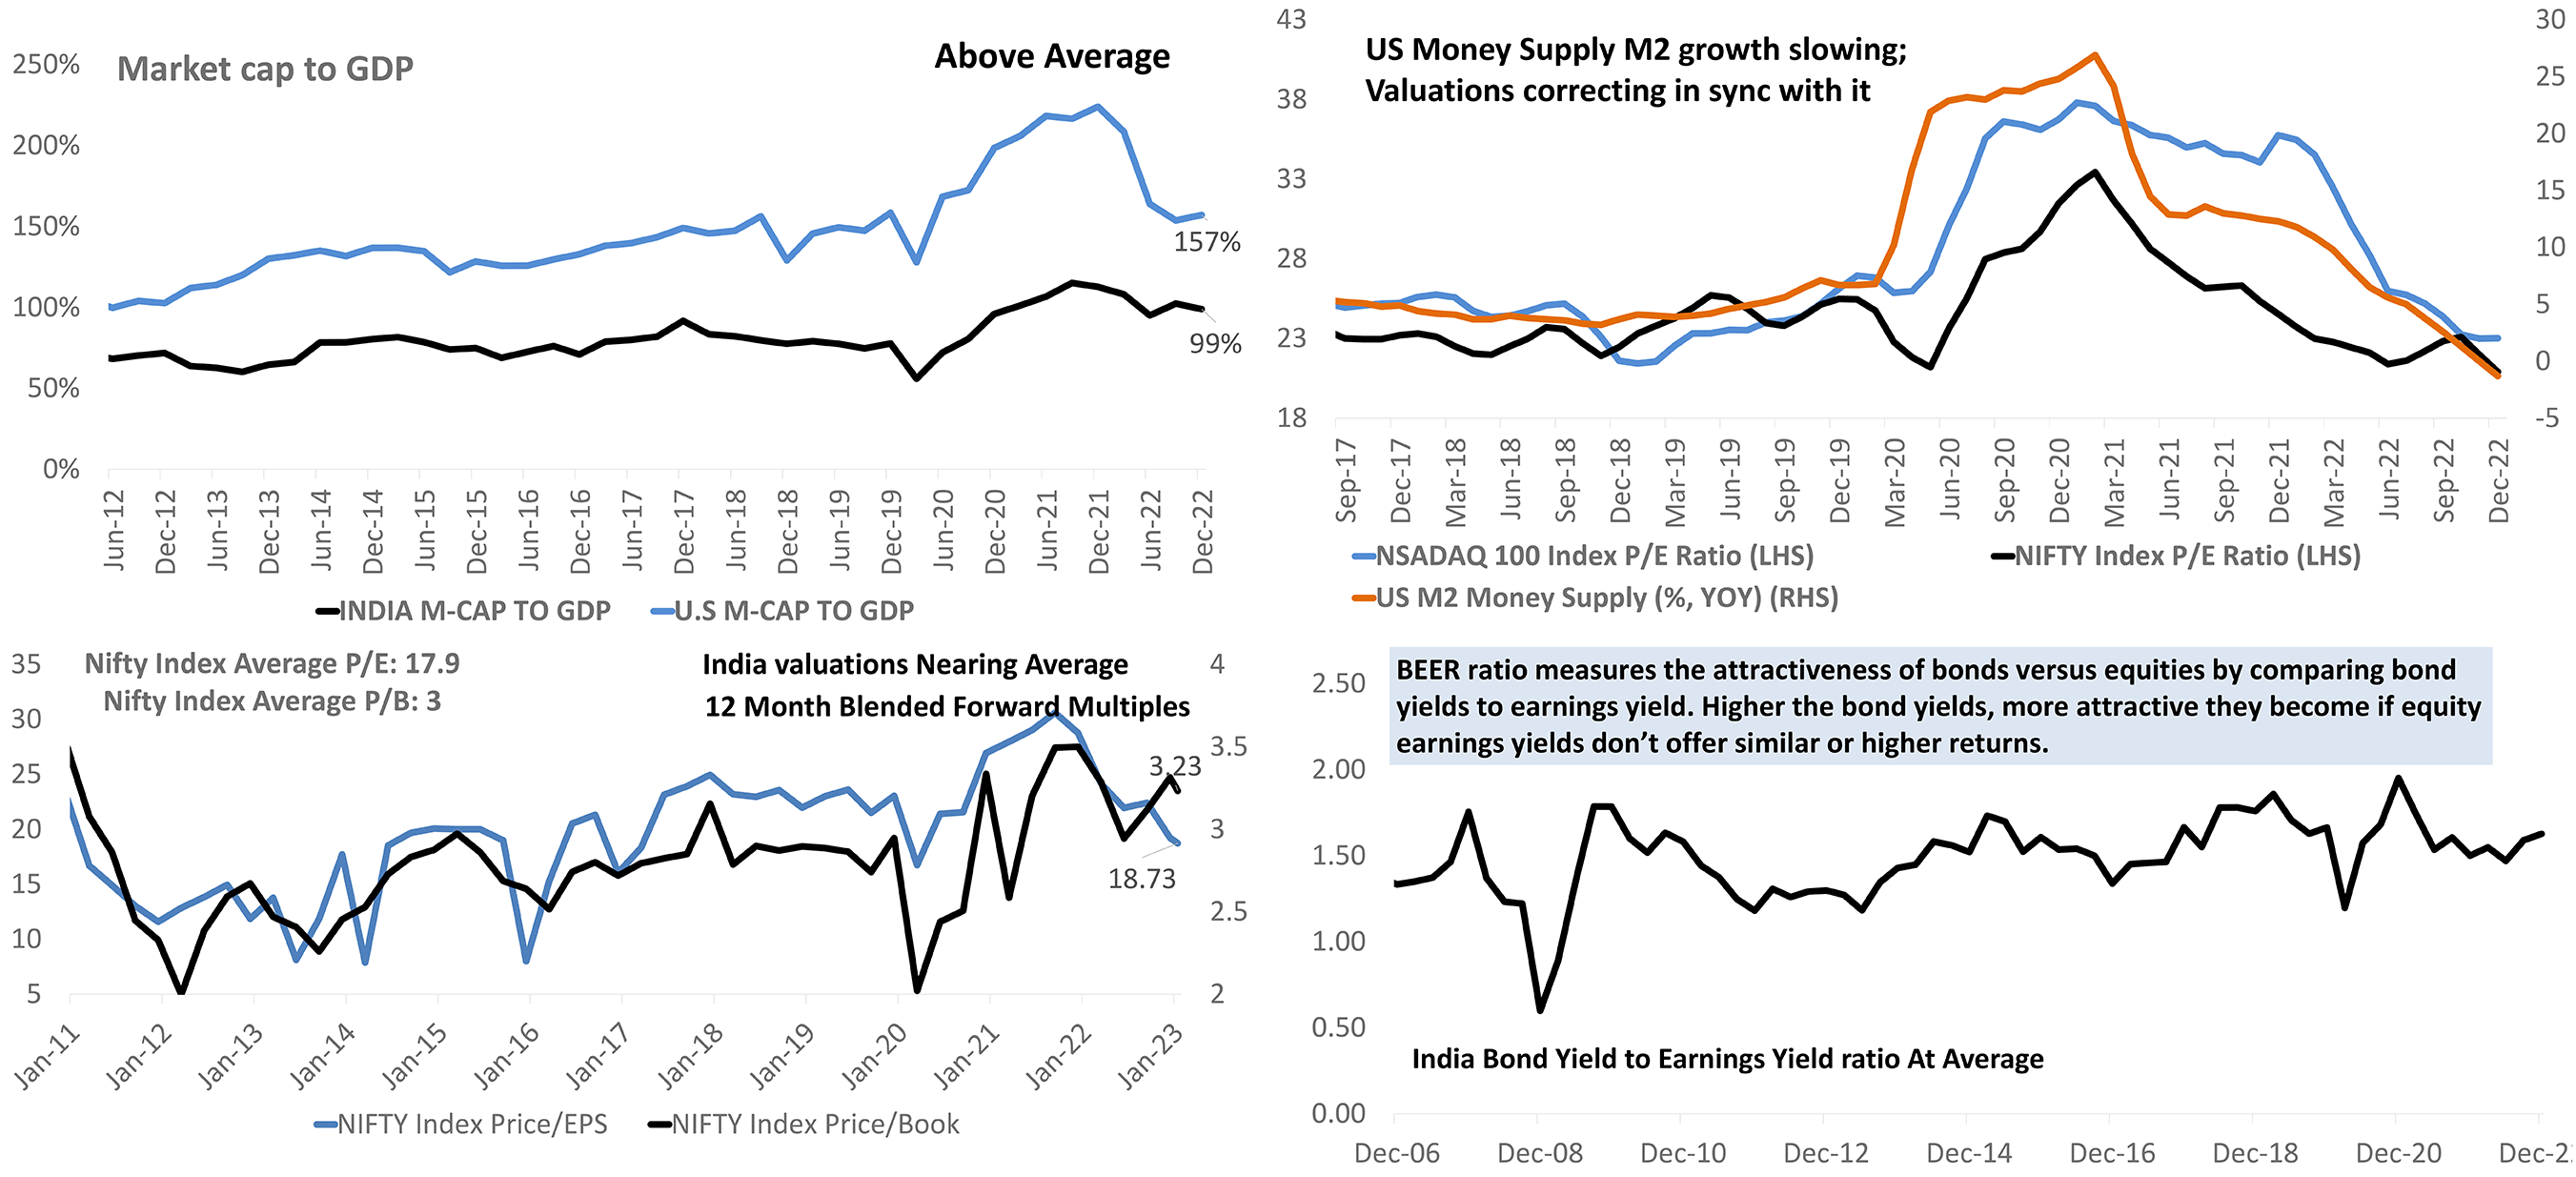
Valuations Indicators Are Mixed
Source: Bloomberg As On Jan 2023
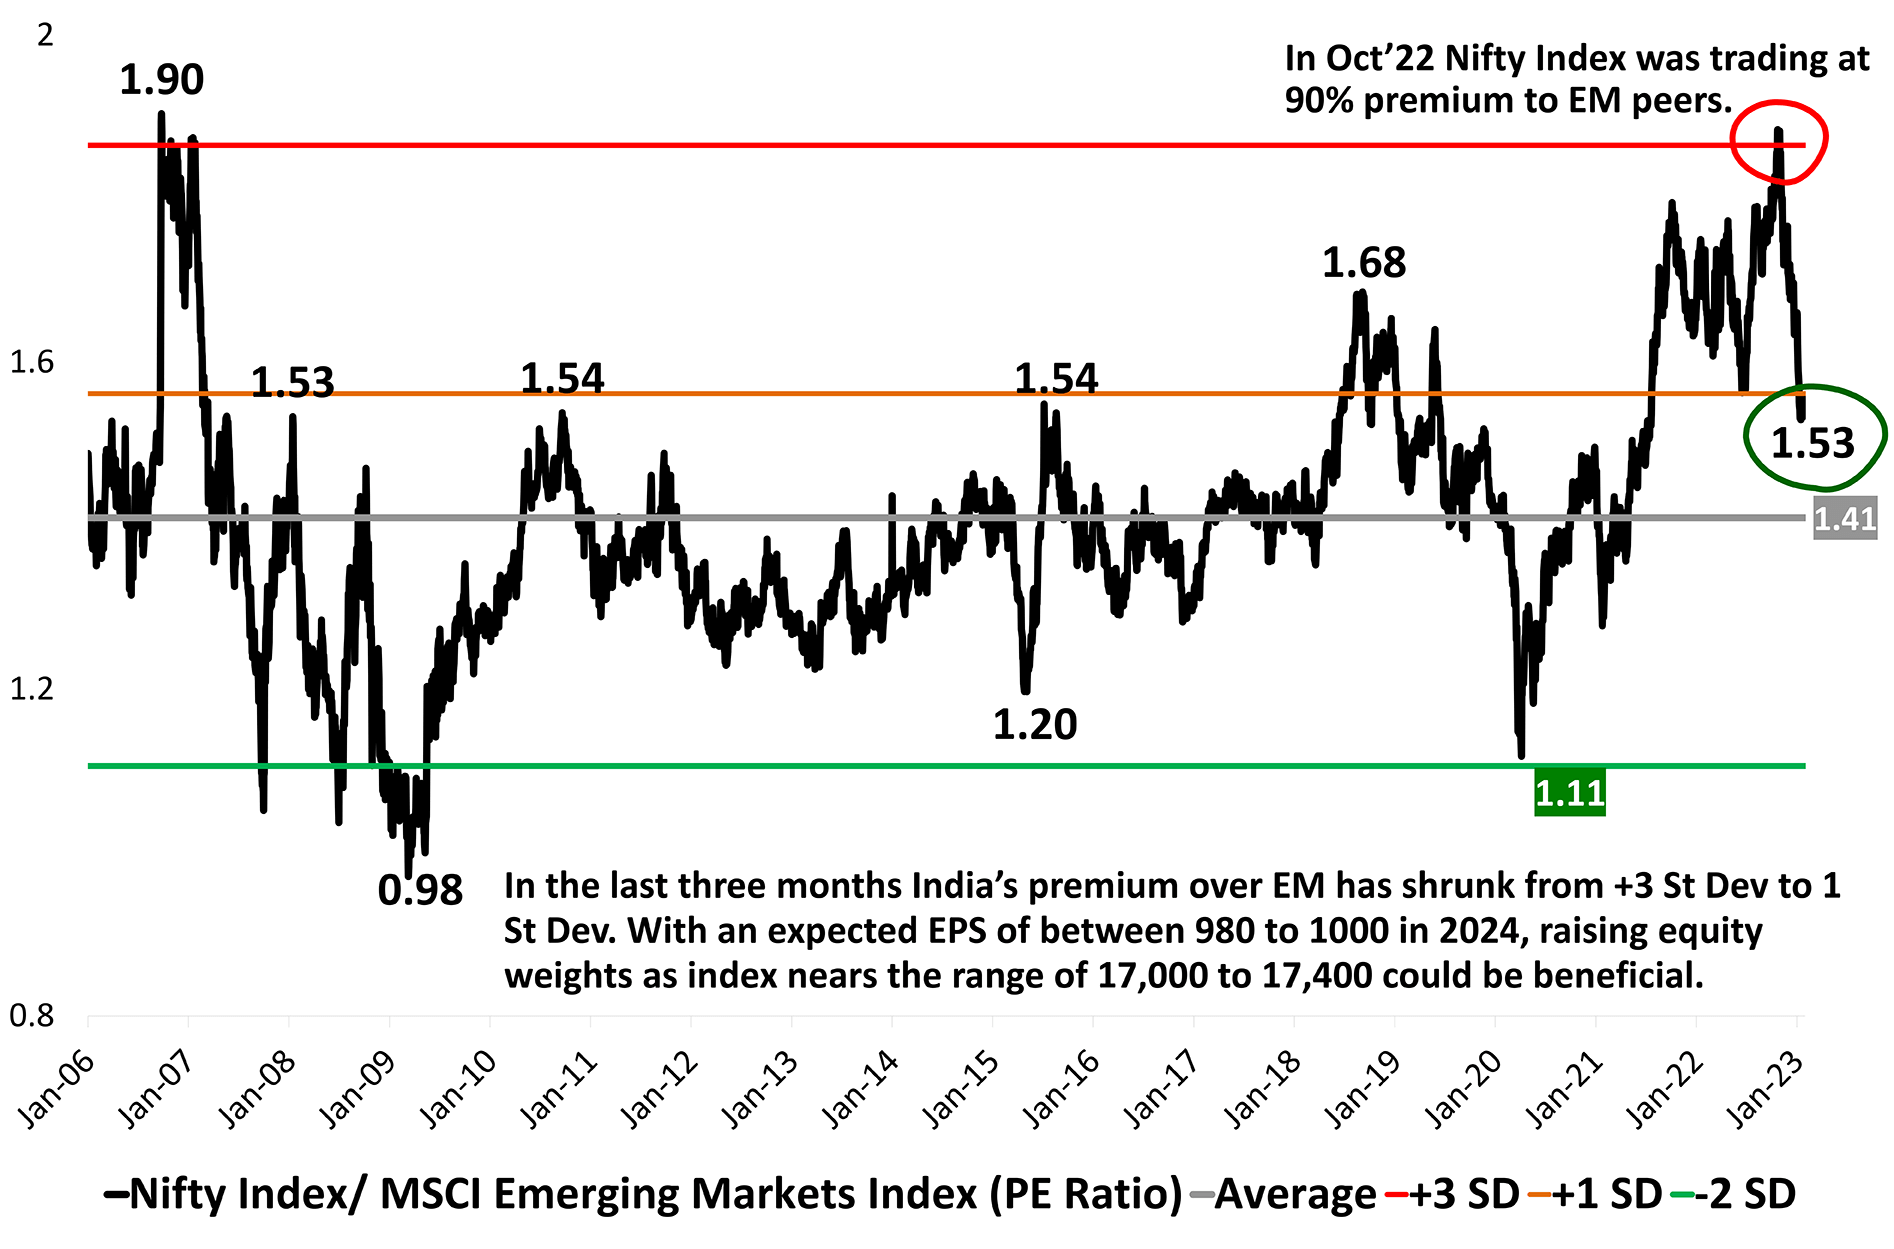
India’s Premium Over EMs Withering Away As EMs Rally & India Consolidates
India was the oasis and shining light of EM equity performance just a few months ago. As highlighted in past editions of this report, the India premium was not so much India’s outperformance but stark underperformance of other Emerging Market (EM) peers. In the last 3 months, the MSCI Emerging Market Index has rallied 26% while the Nifty Index has been flat
This has caused the premium that Indian equities enjoyed over EM peers to vanish. The correction of this aberration is a positive development for Indian equities, as FPI flows had become muted due to relatively higher valuations.
Further consolidation and steady earnings growth can cause India to become attractive once again as we progress into 2023. With an expected EPS of between 980 to 1000 in 2024, raising equity weights as index nears the range of 17,000 to 17,400 could be beneficial.
Source: Bloomberg Data as on Jan 2023
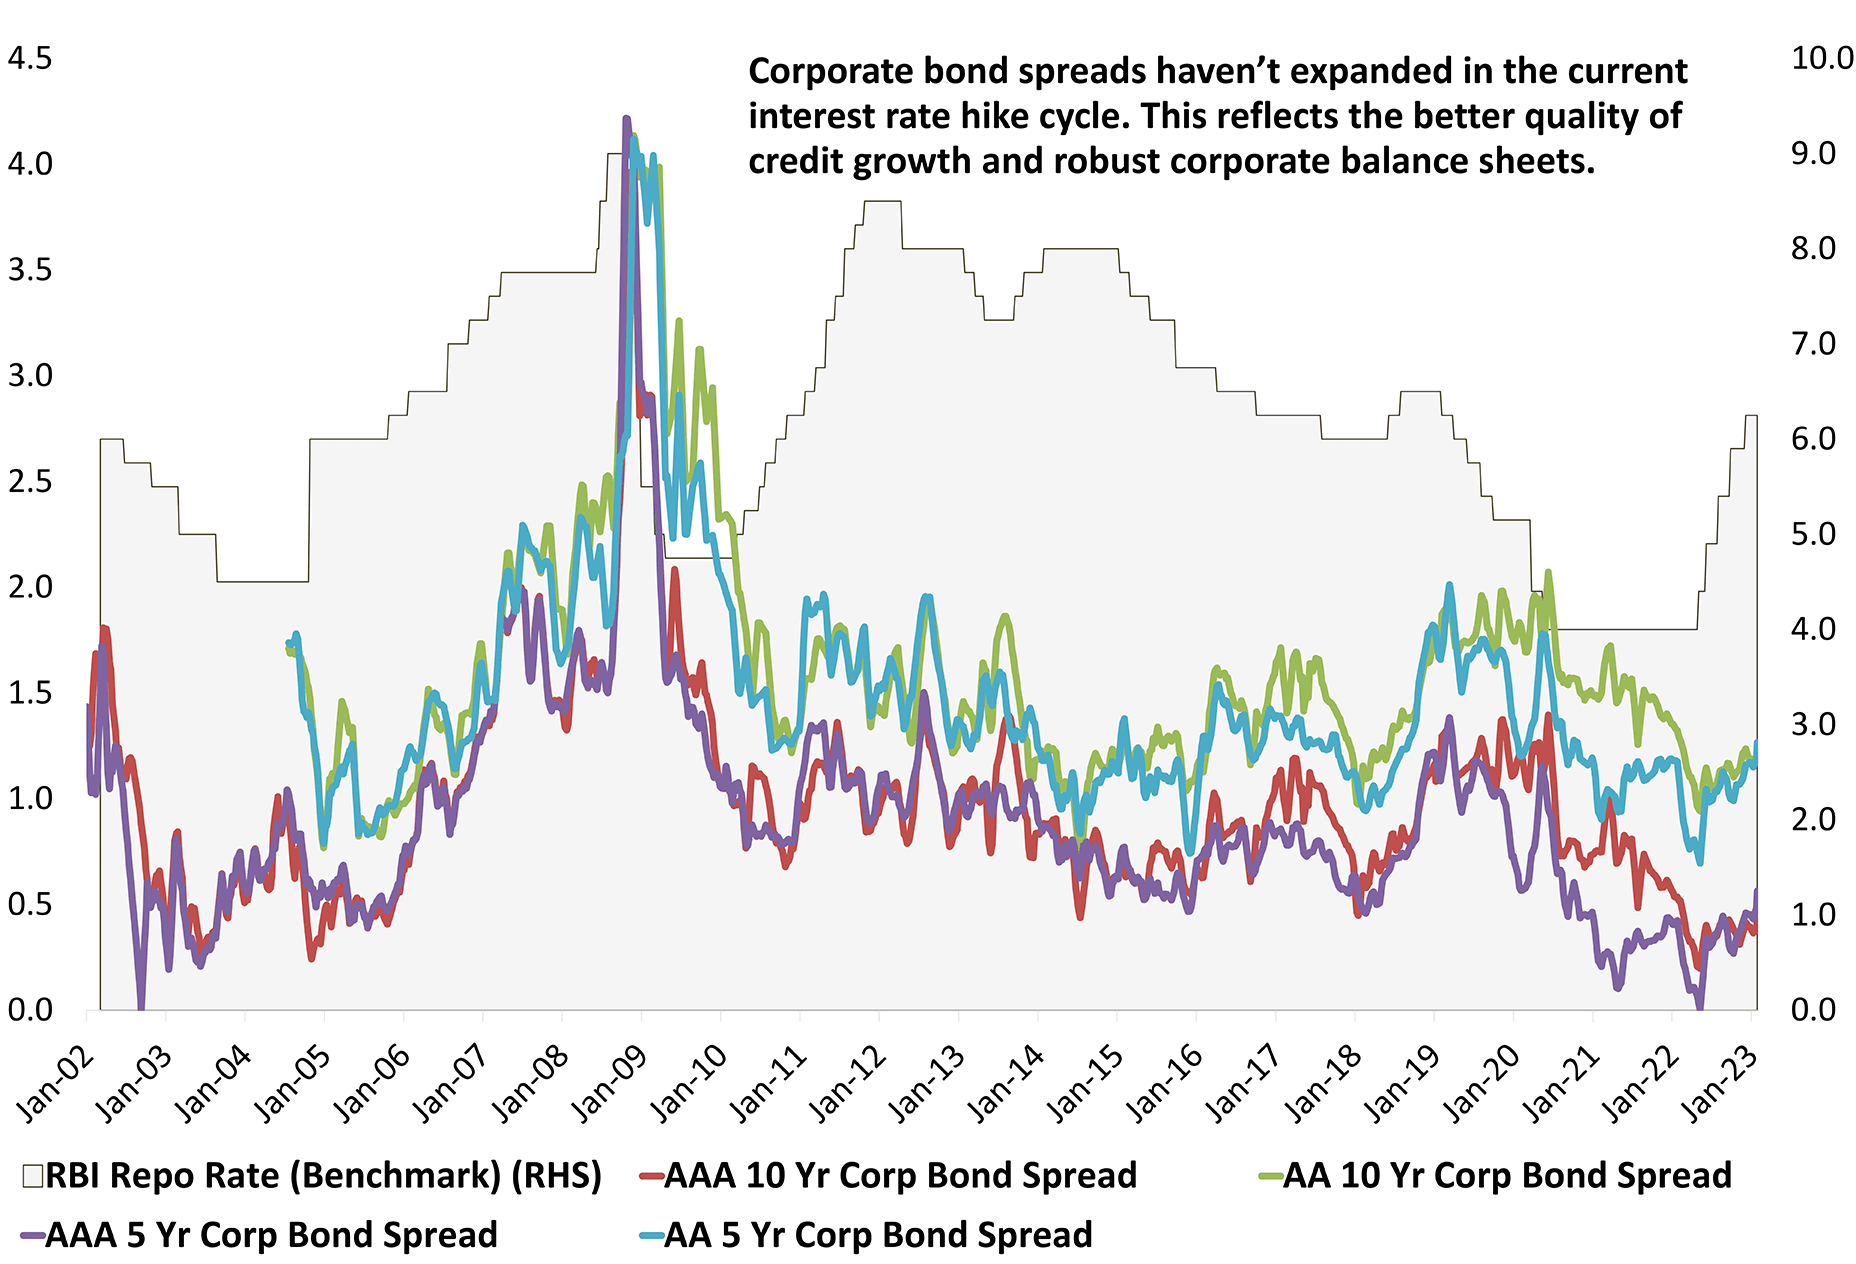
Corporate Bond Yield Spreads Defy Past Trends
Corporate India pays a premium over Government Securities. A bond yield spread is calculated by subtracting the ongoing 10-year Government Bond Yield from the Corporate bond of similar maturity.
In every past instance, interest rate hikes have been followed by a sharp rise in corporate bond spreads. This usually happens because of tight financial conditions coinciding with weak balance sheets.
RBI has raised the Repo rate by 225 bps in the last 9 months. However, corporate bond spreads are yet to show a meaningful increase. The AAA 5-year corporate bond yield spread is currently at 55 bps, which is nearly 40 bps lower than its long-term average.
This augurs well for corporate India. If we are at the tail end of interest rate hikes and financial conditions normalize, it will help corporate India borrow at rates that are lower than the peak rates of past cycles.
Source: Bloomberg Data as on Jan 2023
When interest rates peak out - What to prefer, Constant maturity or Roll-down Fund?
Roll-down funds have a higher duration at inception, which keeps reducing as the fund approaches maturity. On the other hand, Constant Maturity Funds (CMF) keep duration constant by periodically buying & selling bonds.
In a scenario of interest rates peaking out, CMFs can provide better return outcome over roll down funds as higher duration in CMFs helps to earn MTM gain/loss over & above higher accrual.
Rates appear to be in the process of peaking out or have already peaked. This means, it makes more sense to look at constant maturity debt funds at this point in the rates cycle.
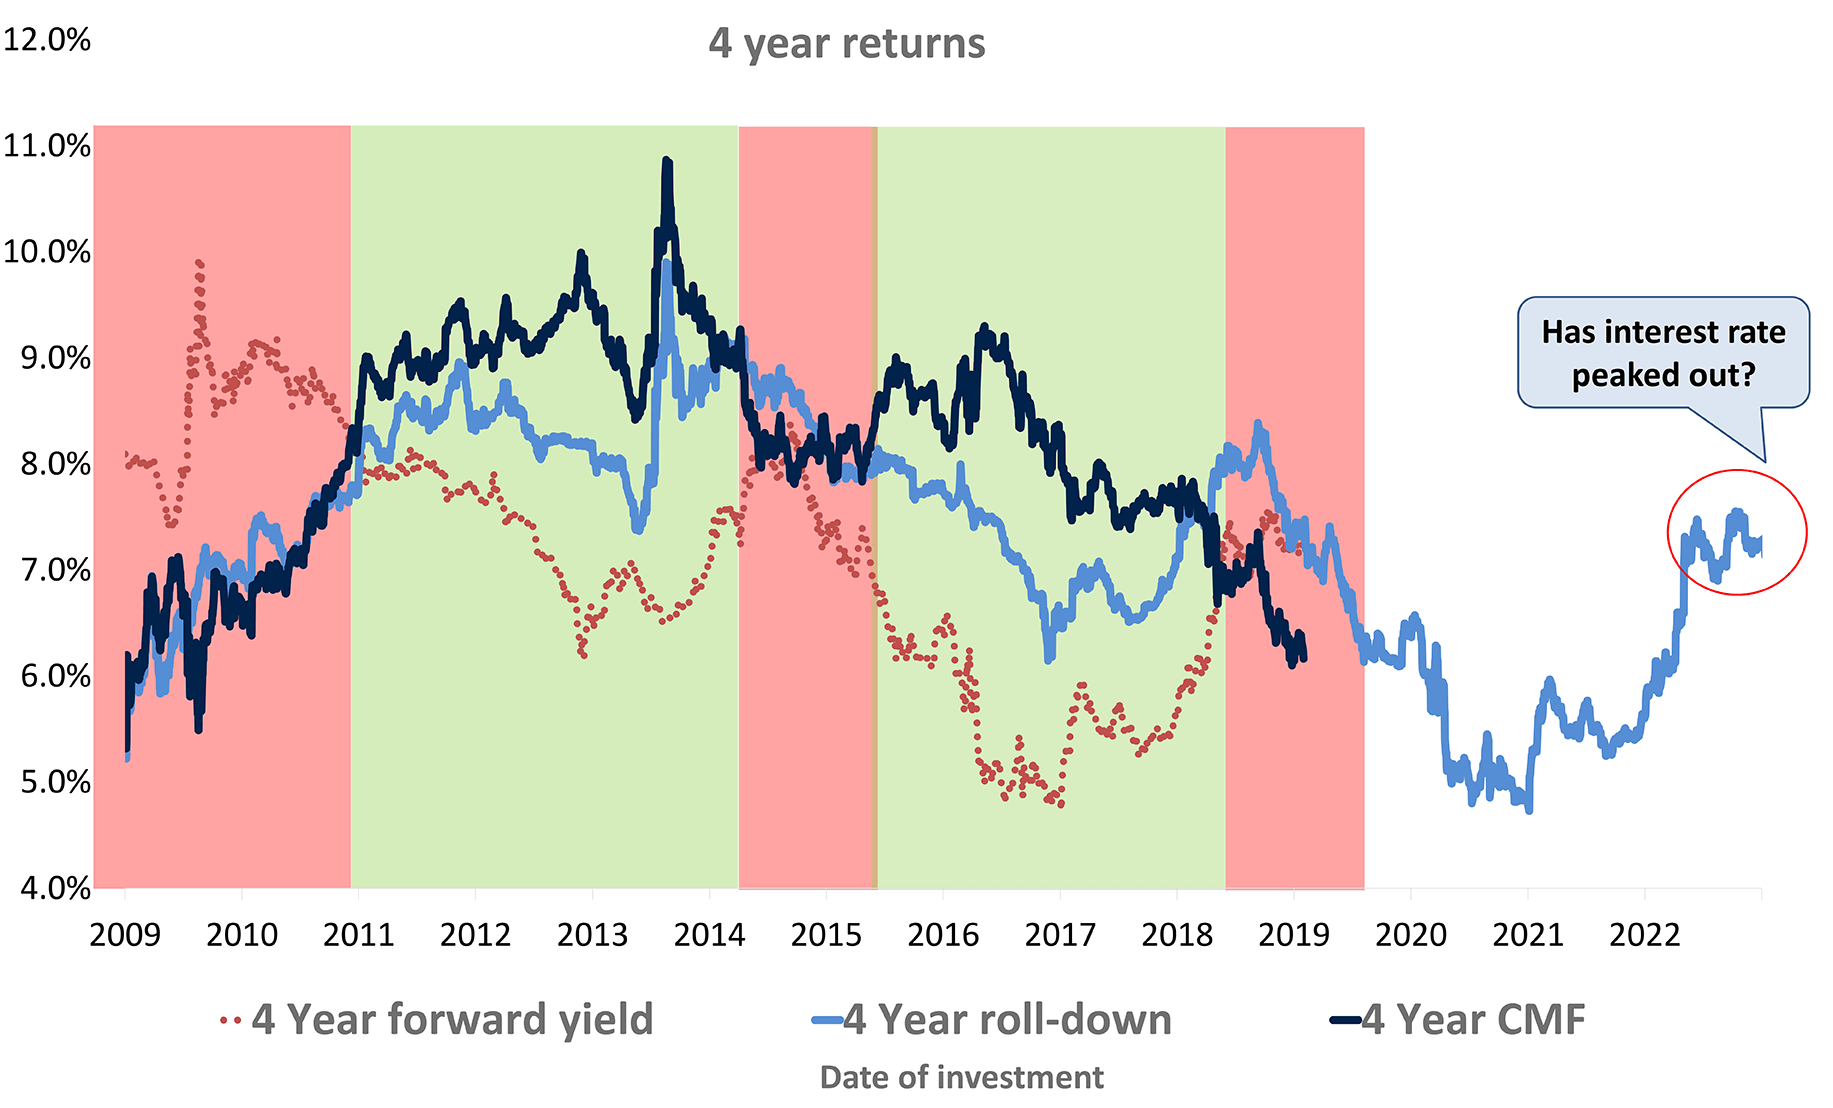
Source: Internal, Bloomberg, DSP As on Jan 2023. Returns of 4 year constant maturity fund is calculated assuming monthly rebalancing
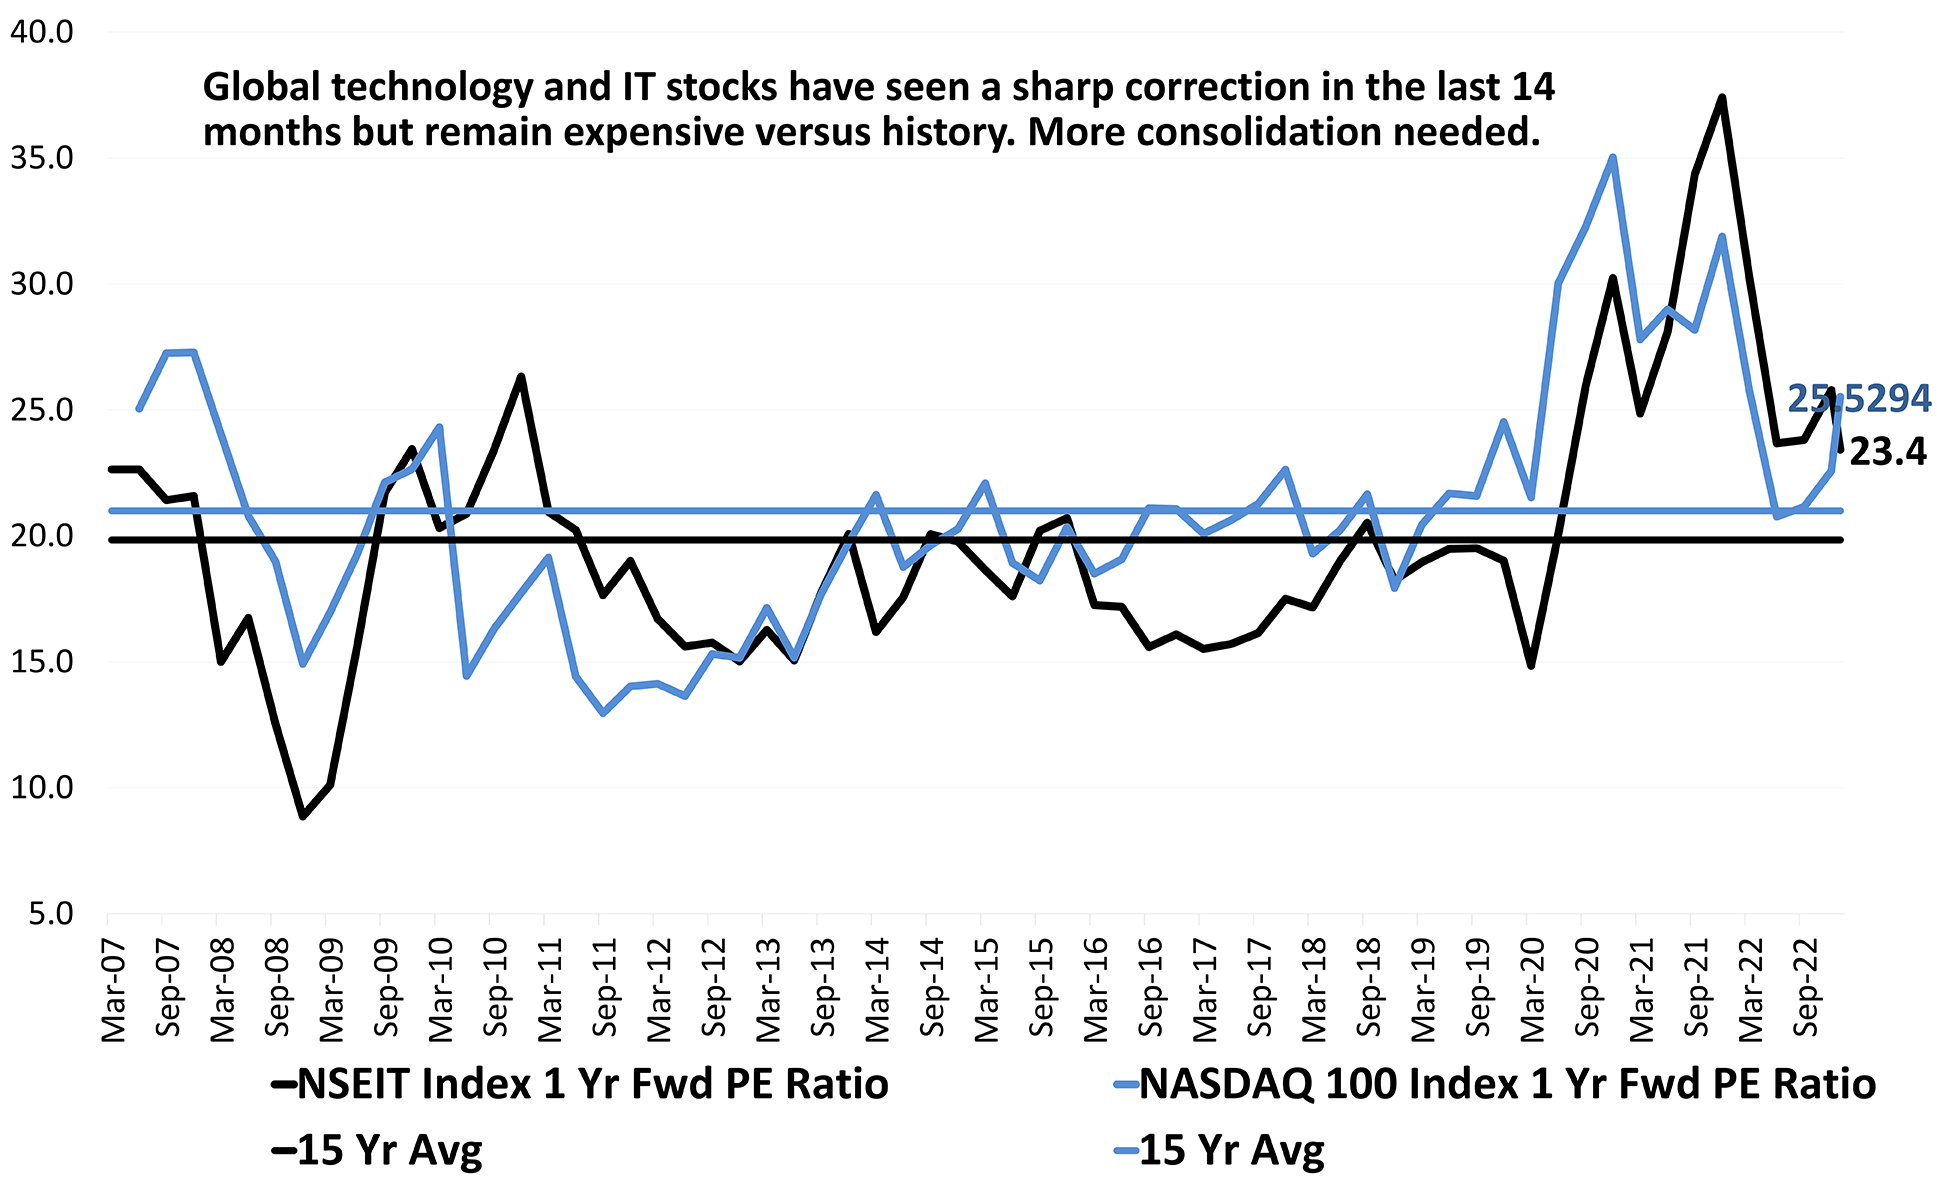
Indian IT Stocks Are Now Cheaper Than Nasdaq, But Above Historical Average
Nasdaq 100 Index is down 28% from its most recent peak, while Nifty IT Index is down 22%. The 1-year forward price-toearnings multiple for Nasdaq has shrunk from 35 at its peak to 25 now, while for Nifty IT the multiple is down from 37 to 23. Both indices were exceptional performers in the post-COVID global technology rally.
The impending slowdown in advanced economies & ultra-high valuations leave room for this sector to undergo further consolidation.
Investors who have been waiting on the sidelines are likely to get a good opportunity to buy into this valuation and price correction in the technology sector. The long-term earnings trajectory for this sector continues to remain attractive. Better starting valuations are needed.
Source: Bloomberg, DSP As on Jan 2023
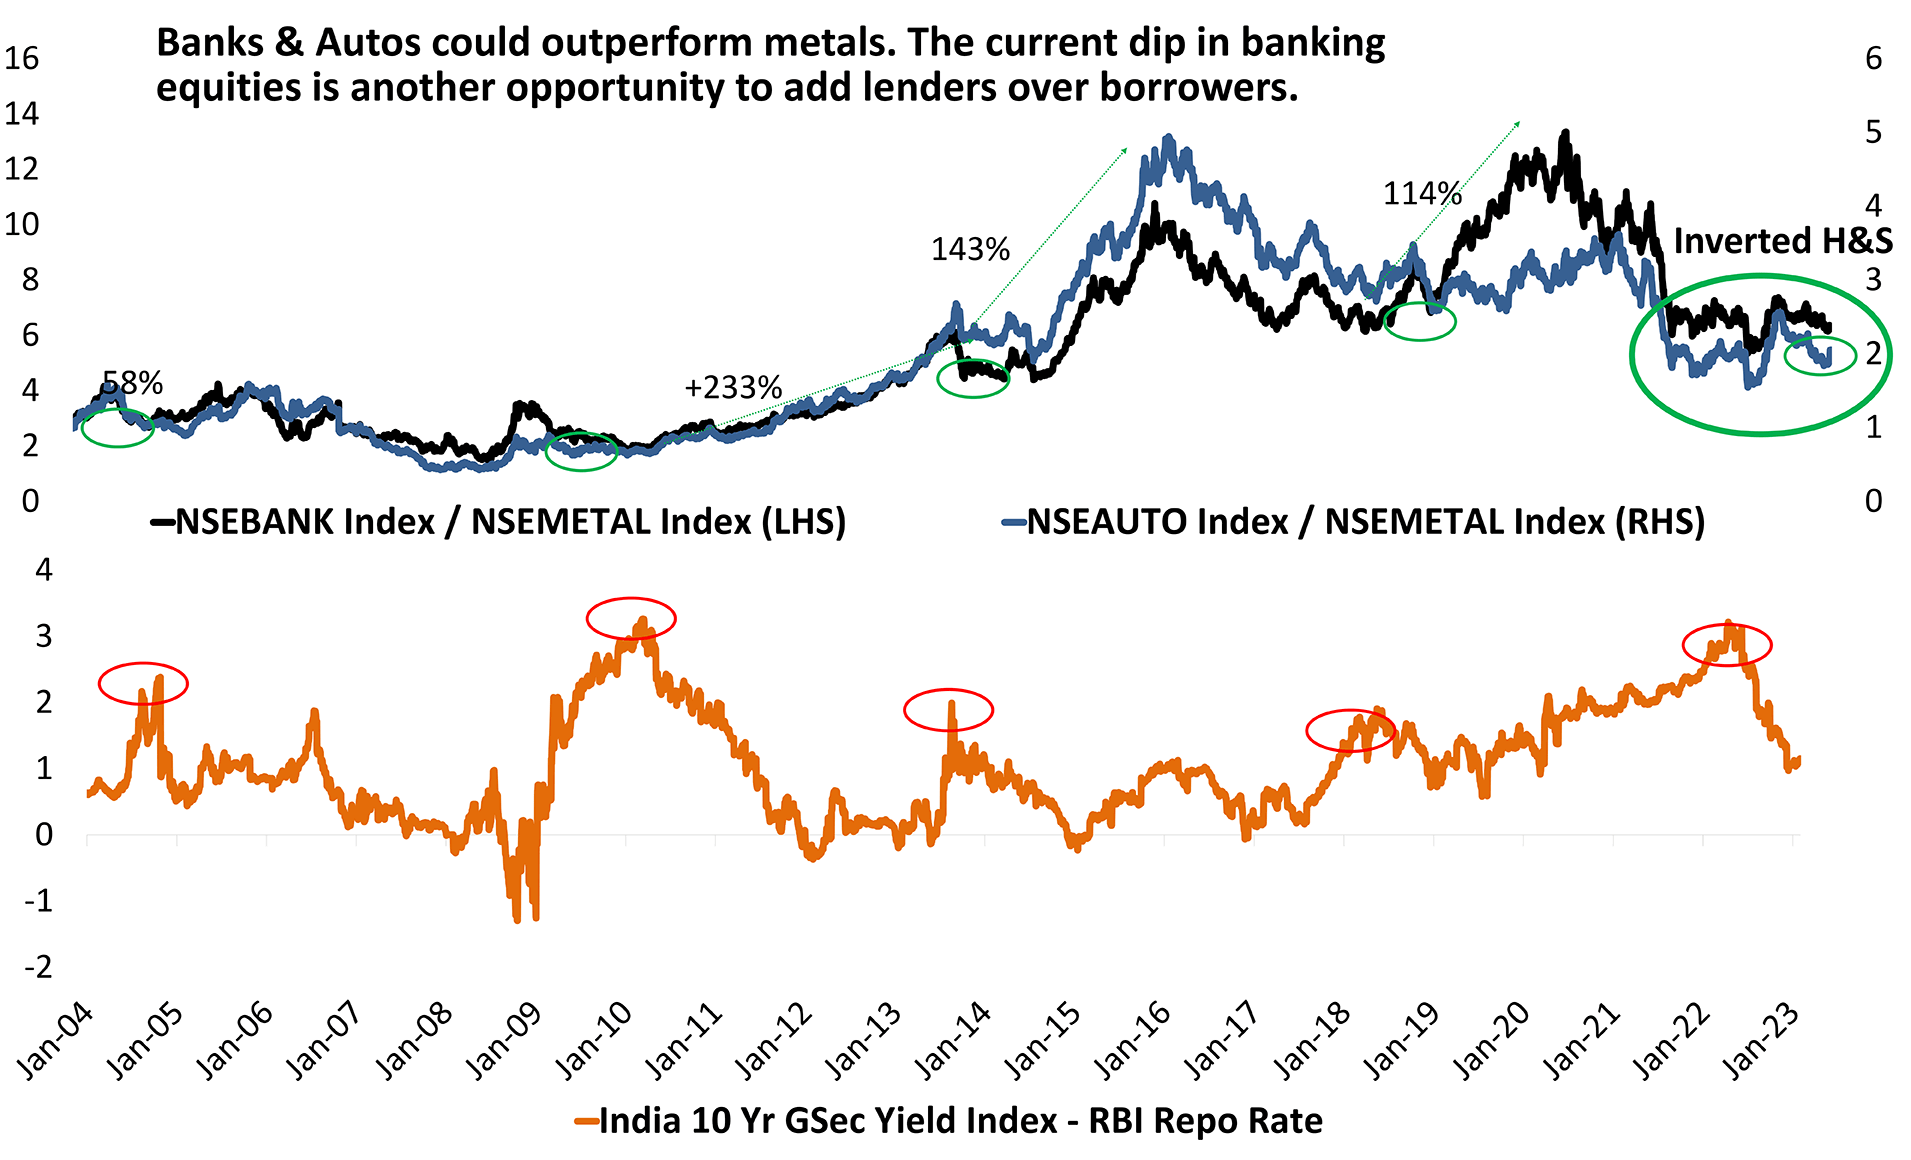
Another Opportunity To Own Banks & Autos?
The ratio of NSE Bank Index to NSE Metal Index, or the ratio of lenders to borrowers is now at multi year lows. When commodity prices normalize & economic growth is steady, borrowers & users of commodities do better than sellers of commodities. Hence this ratio.
Interestingly this ratio bottomed out at a time when the yield curve was very steep & RBI was about to embark on a rate hike journey.
Since then, metals have consolidated with a leg down and then had a rebound while Banks & Autos were top performers since. Recent correction in Banking stocks & a rally in Metals equities makes this an attractive proposition once again.
A technical price pattern, an inverted head and shoulder, is also visible on the Banks to Metals ratio chart. This confluence of factors supports the bullish banks over metals thesis.
Source: Bloomberg Data as on Jan 2023
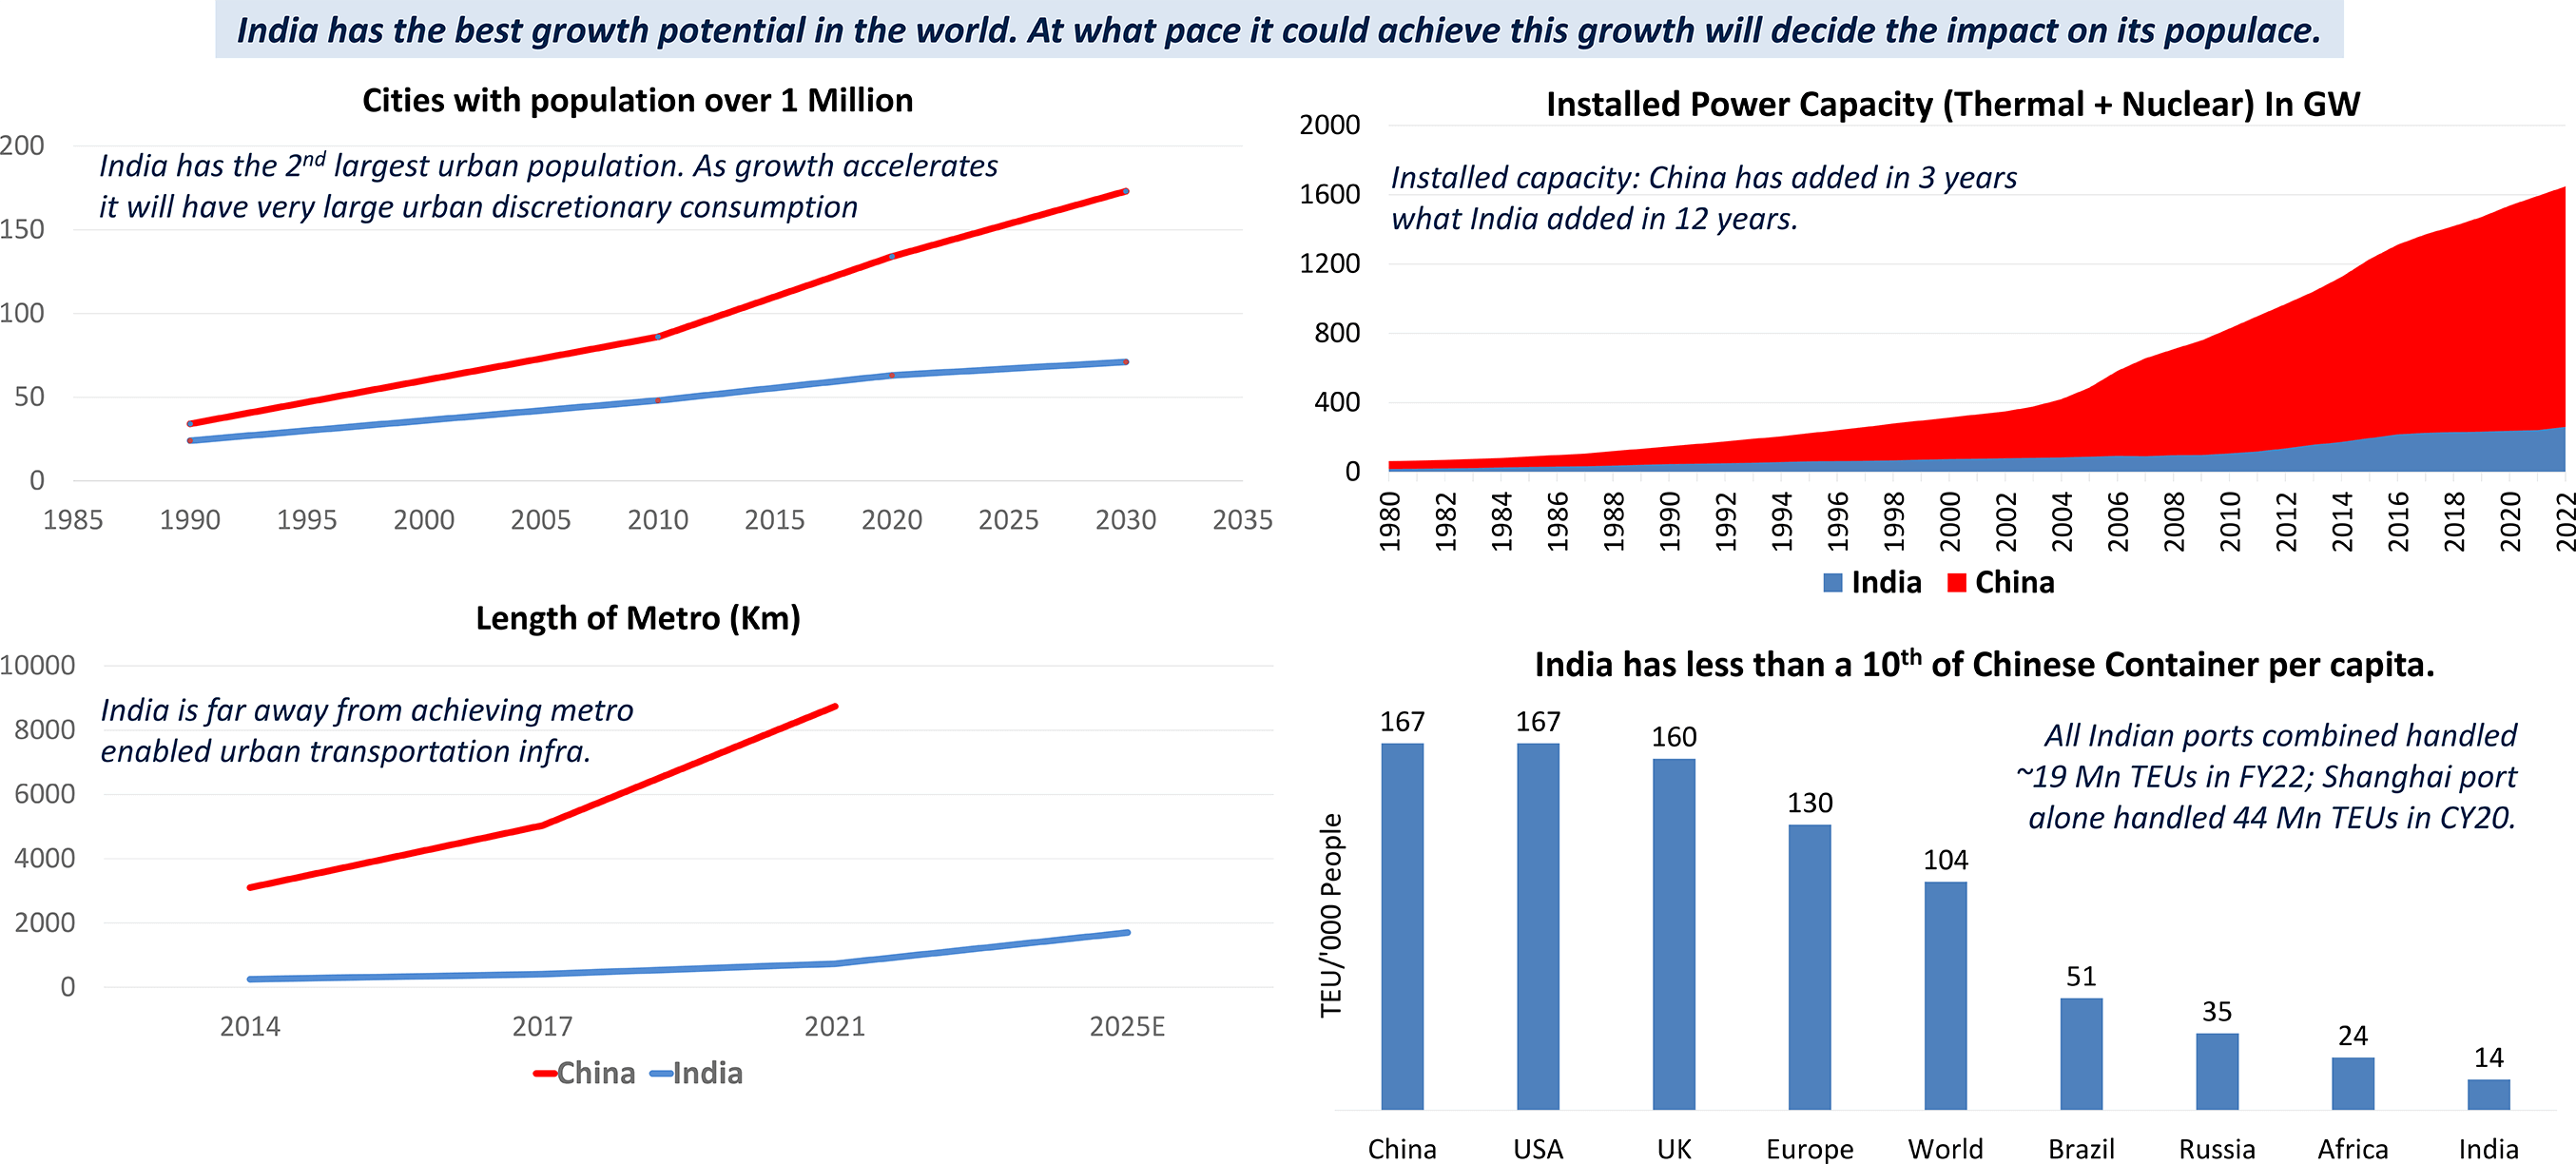
Can India Catch-up To China? The Direction Is Right, But The Pace?
Source: Bernstein, DSP As on Jan 2023
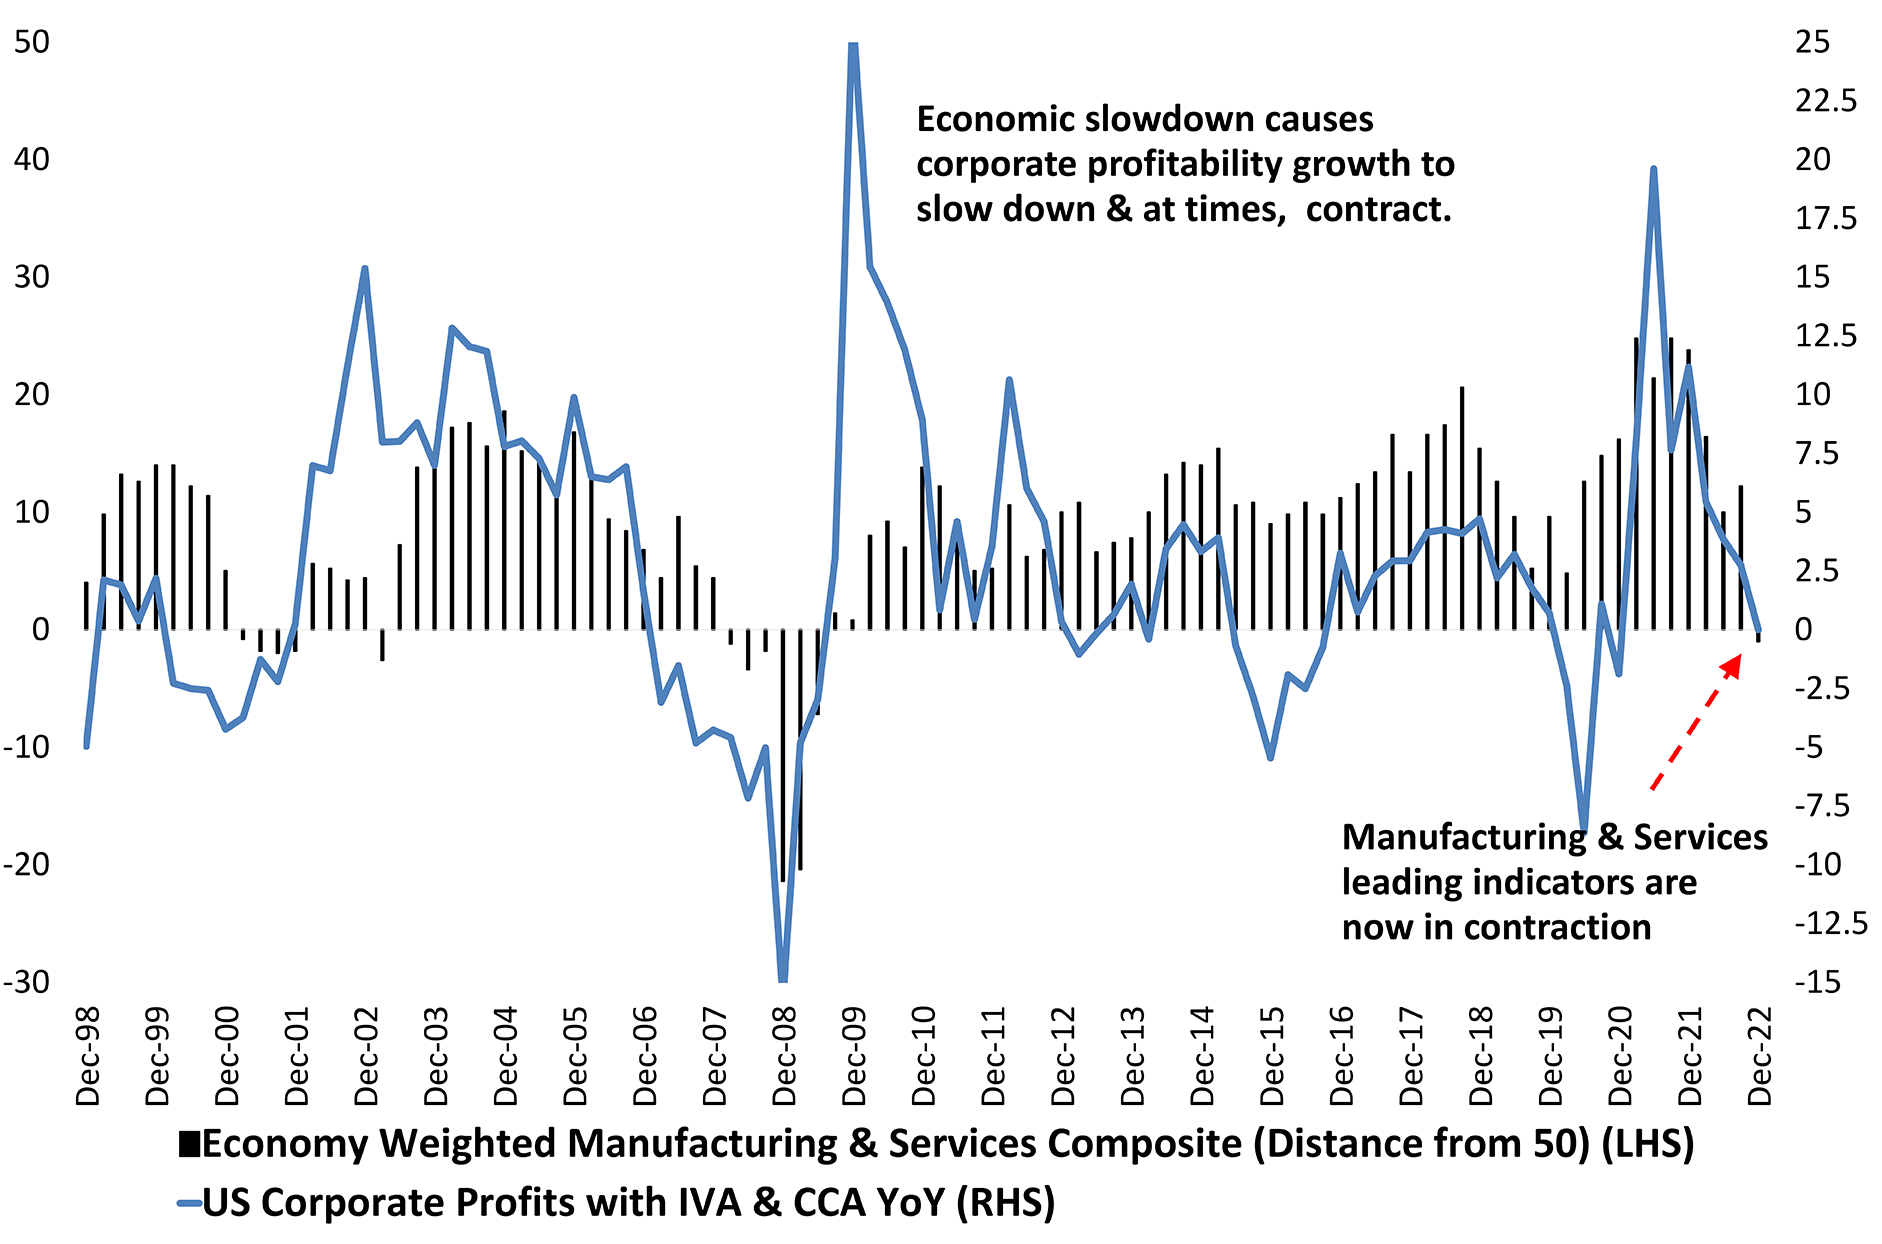
US Corporate Profitability Set To Shrink As Growth Slows
The US equity market has been in an extended phase of correction and consolidation. This is largely a result of corporate profitability being dragged lower by slowing growth.
The accelerated rate hikes over the last 9 months by the US Federal Reserve would cause growth to slow further in the coming months.
This means US equities are likely to remain in a grinding consolidation for some time as valuations keep correcting and growth slows further.
Deep cuts in 2022 and a 50% decline in margin debt could help markets avoid deep crashes in 2023. US equities could remain lackluster for some time. Sideways consolidations are the best phases to build equity positions through systematic investment plans (SIP).
Source: Bloomberg Data as on Jan 2023
Supply Chains Have Normalized
A composite indicator of world container freight rates, shipping freight, and the backlog of orders at major manufacturers has eased.
The index, which peaked in mid-2021 but remained excessively high for the whole of 2022, is now at levels like the pre-covid phase.
This means that the supply-side pressures have eased in most markets, especially those that were caused by disrupted supply chains.
This will translate to an accelerated decline in the pace of inflation and would give central banks more room to pause their rate hikes.

Source: Bloomberg, DSP As on Jan 2023
US Fed Set To Face Rapid Deceleration In Pace of Inflation
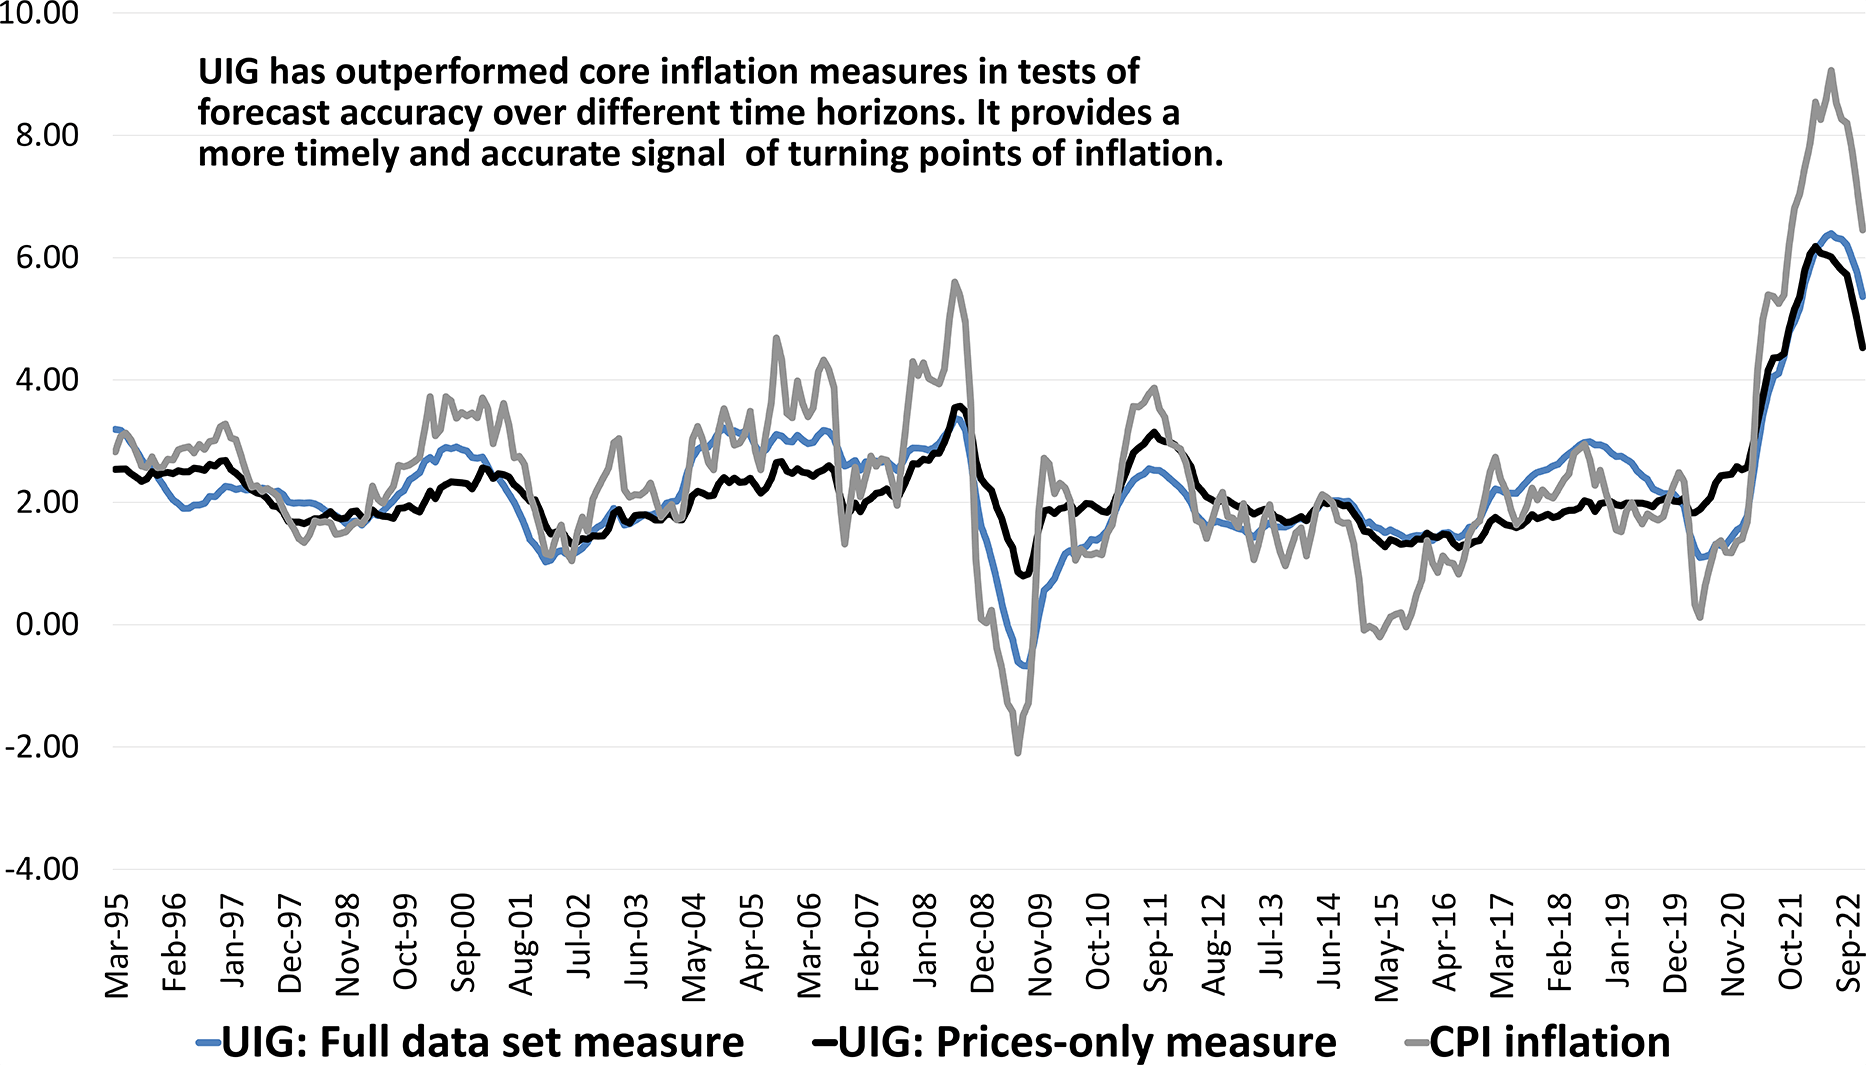
The UIG, or underlying inflation gauge, provides a measure of underlying inflation and is defined as the persistent part of the common component of monthly inflation. It is published by the New York Fed.
The most recent data indicates that UIG is set to decline rapidly. The CPI inflation follows the UIG closely, and it is quite possible that the US CPI will fall below the 5 percent reading in the next few months.
This will cause the US Fed to adopt a more neutral or in Fed Speak, a data dependent path for interest rate changes. After recent rate hikes, expect the Fed to abstain from more rate hikes from hereon.
Source: Bloomberg, DSP As on Dec 2022
Standardize, Follow The Process


 Account Statement
  Capital Gain Statement
  Key Information Memorandum
  PAN Updation
  Register / Modify KYC Online
  Nominee Registration
  Email / Phone Updation
  OTM / eNACH Registration
  Guidelines for Incapacitated Investors
  FAQs
FAQs Reach us

