DSP NETRA April 2024
Gold, Growth, India’s Valuation and Return Dynamics
A Precious Metals Bull Market?
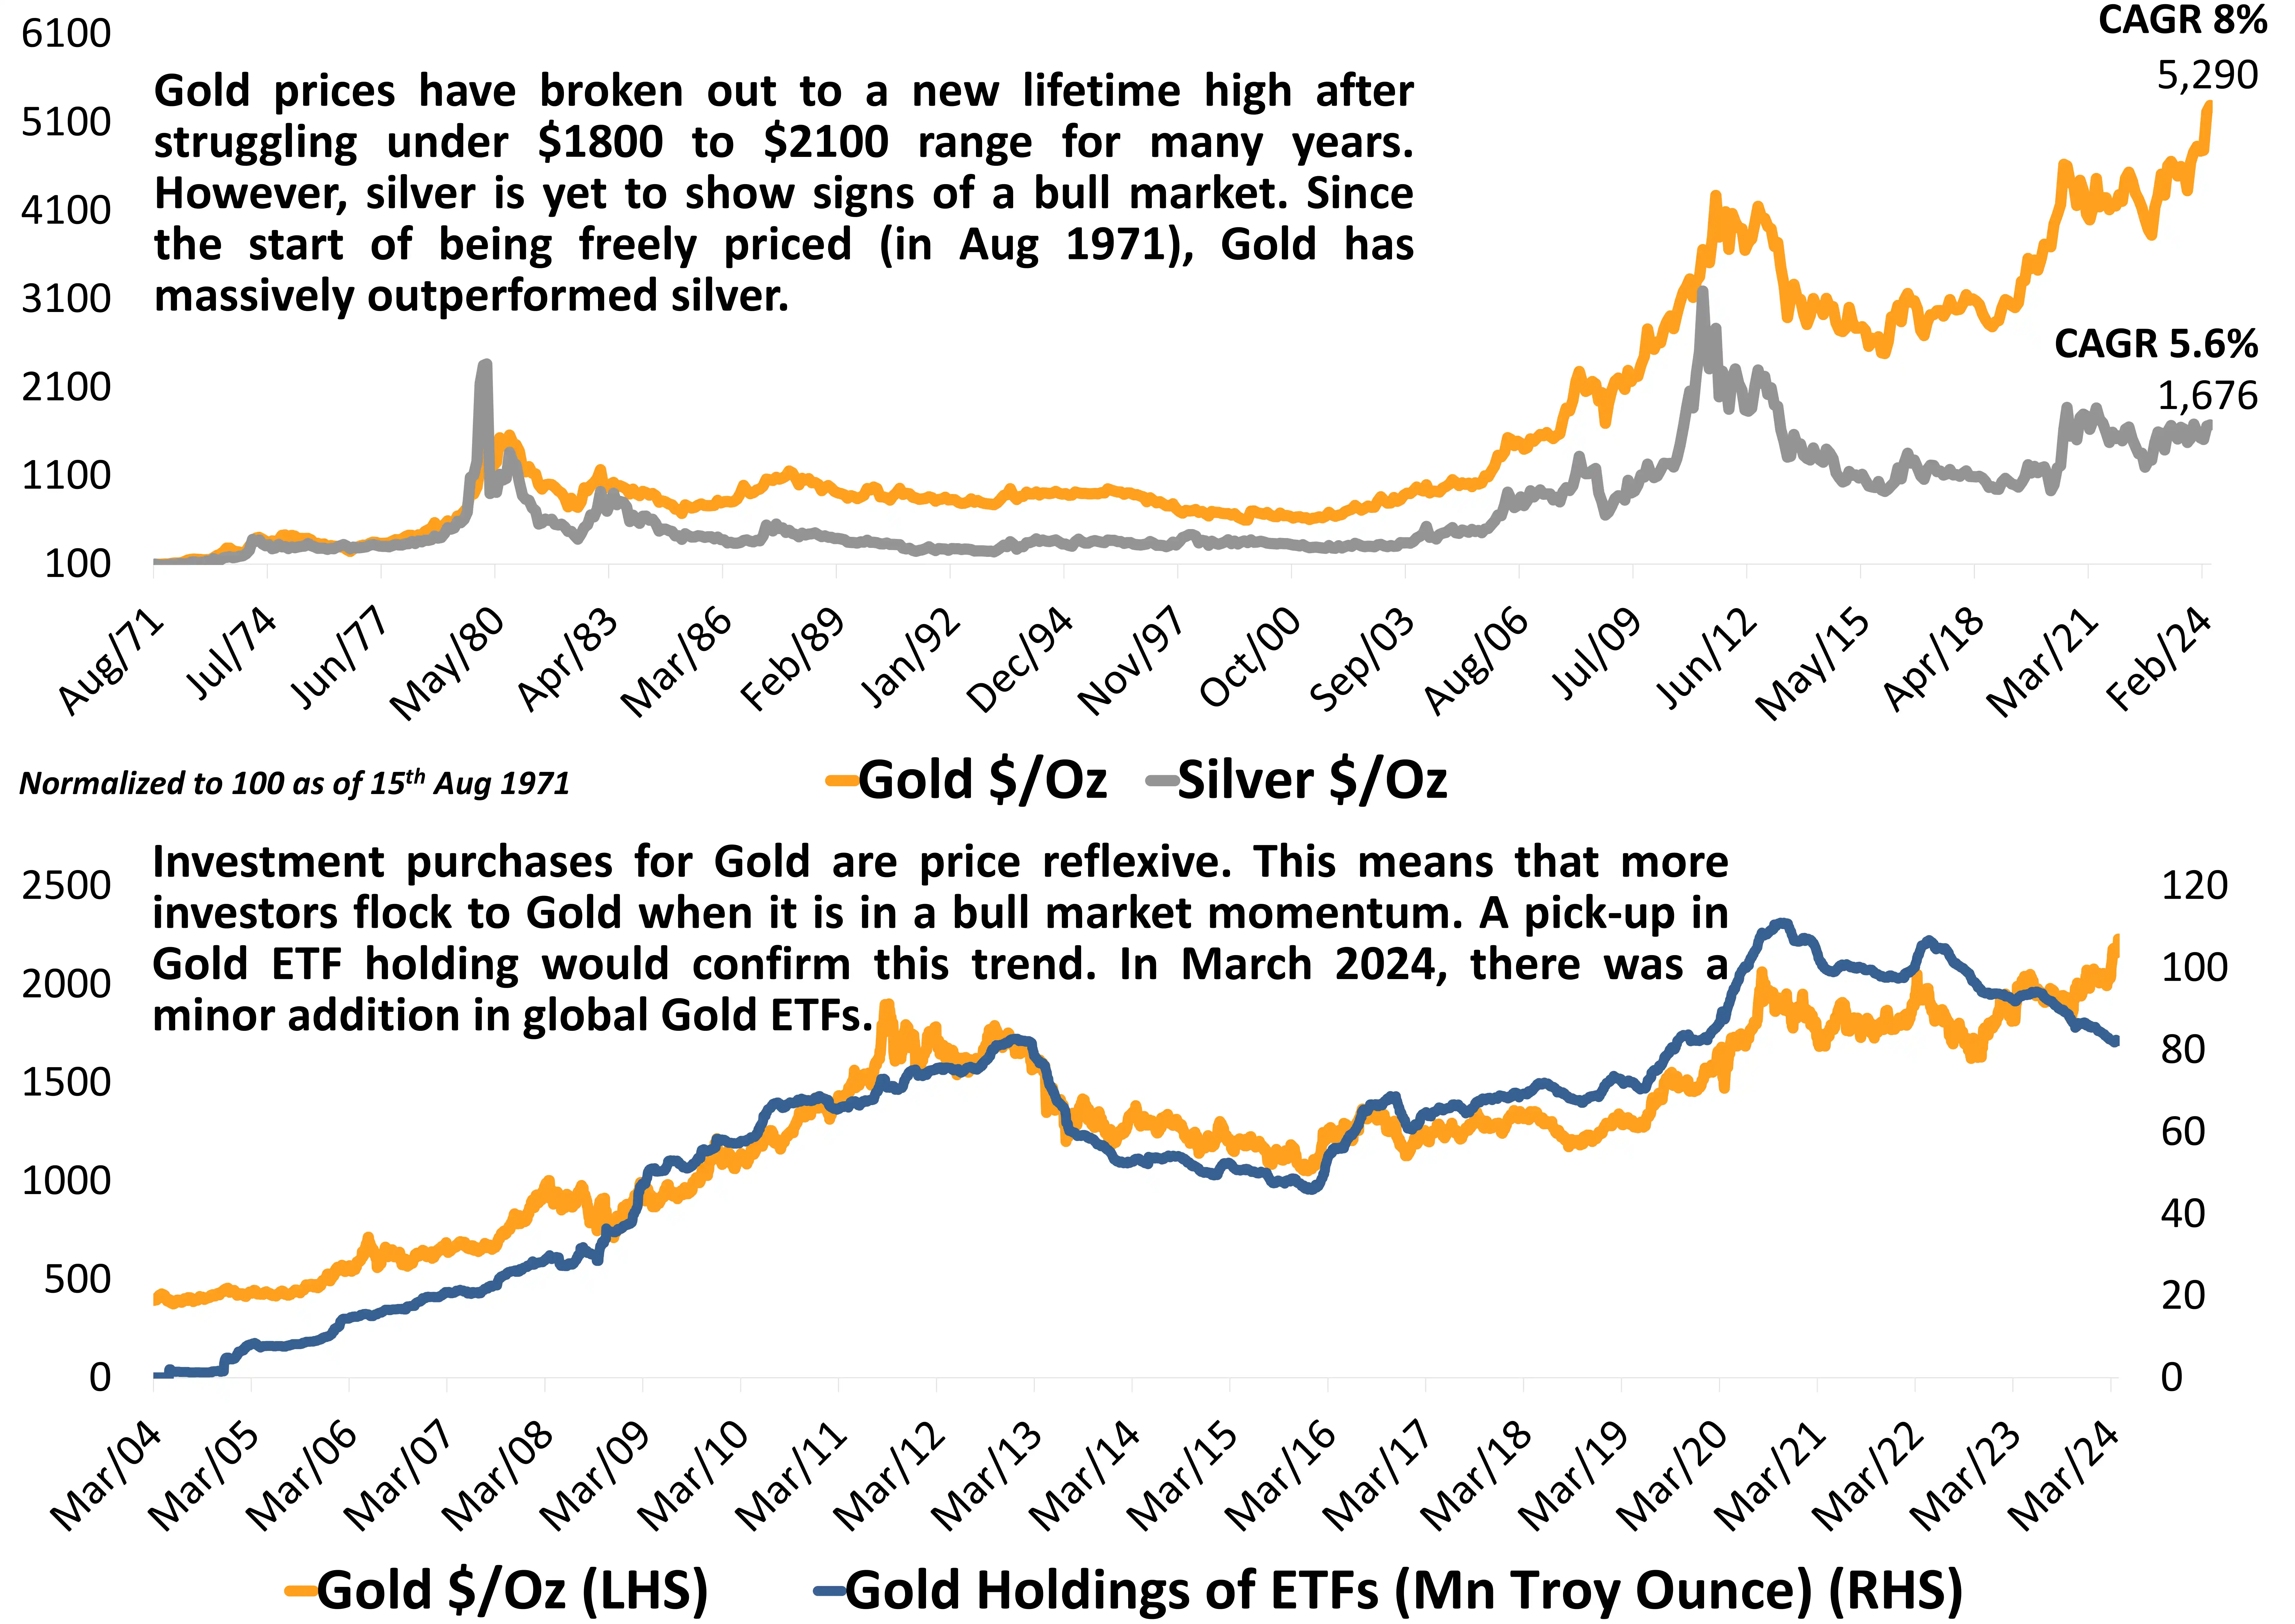
On August 15, 1971, President Richard Nixon announced the "temporary" suspension of the dollar's convertibility into gold. Known colloquially as the “Nixon shock,” the initiative marked the beginning of the end for the Bretton Woods system of fixed exchange rates established at the end of World War II. Since then, Gold prices have outperformed silver by a huge margin. What is noteworthy is that silver has a very high relative outperformance score relative to gold when a precious metals bull market is in place.
Gold, with a new life high in place and price able to sustain above the previous lifetime high indicates that it has entered a bull market. Silver, if it is able to cross $26, could likely indicate beginning of a broad precious metal bull market. Silver has been lagging due to a mute Industrial demand from China, but we are seeing signs of Chinese economy picking up and is expected to improve.
Another indication could come from a pick-up in Gold holdings of global Gold ETFs.
Source: Bloomberg, DSP; Data as of Mar 2024
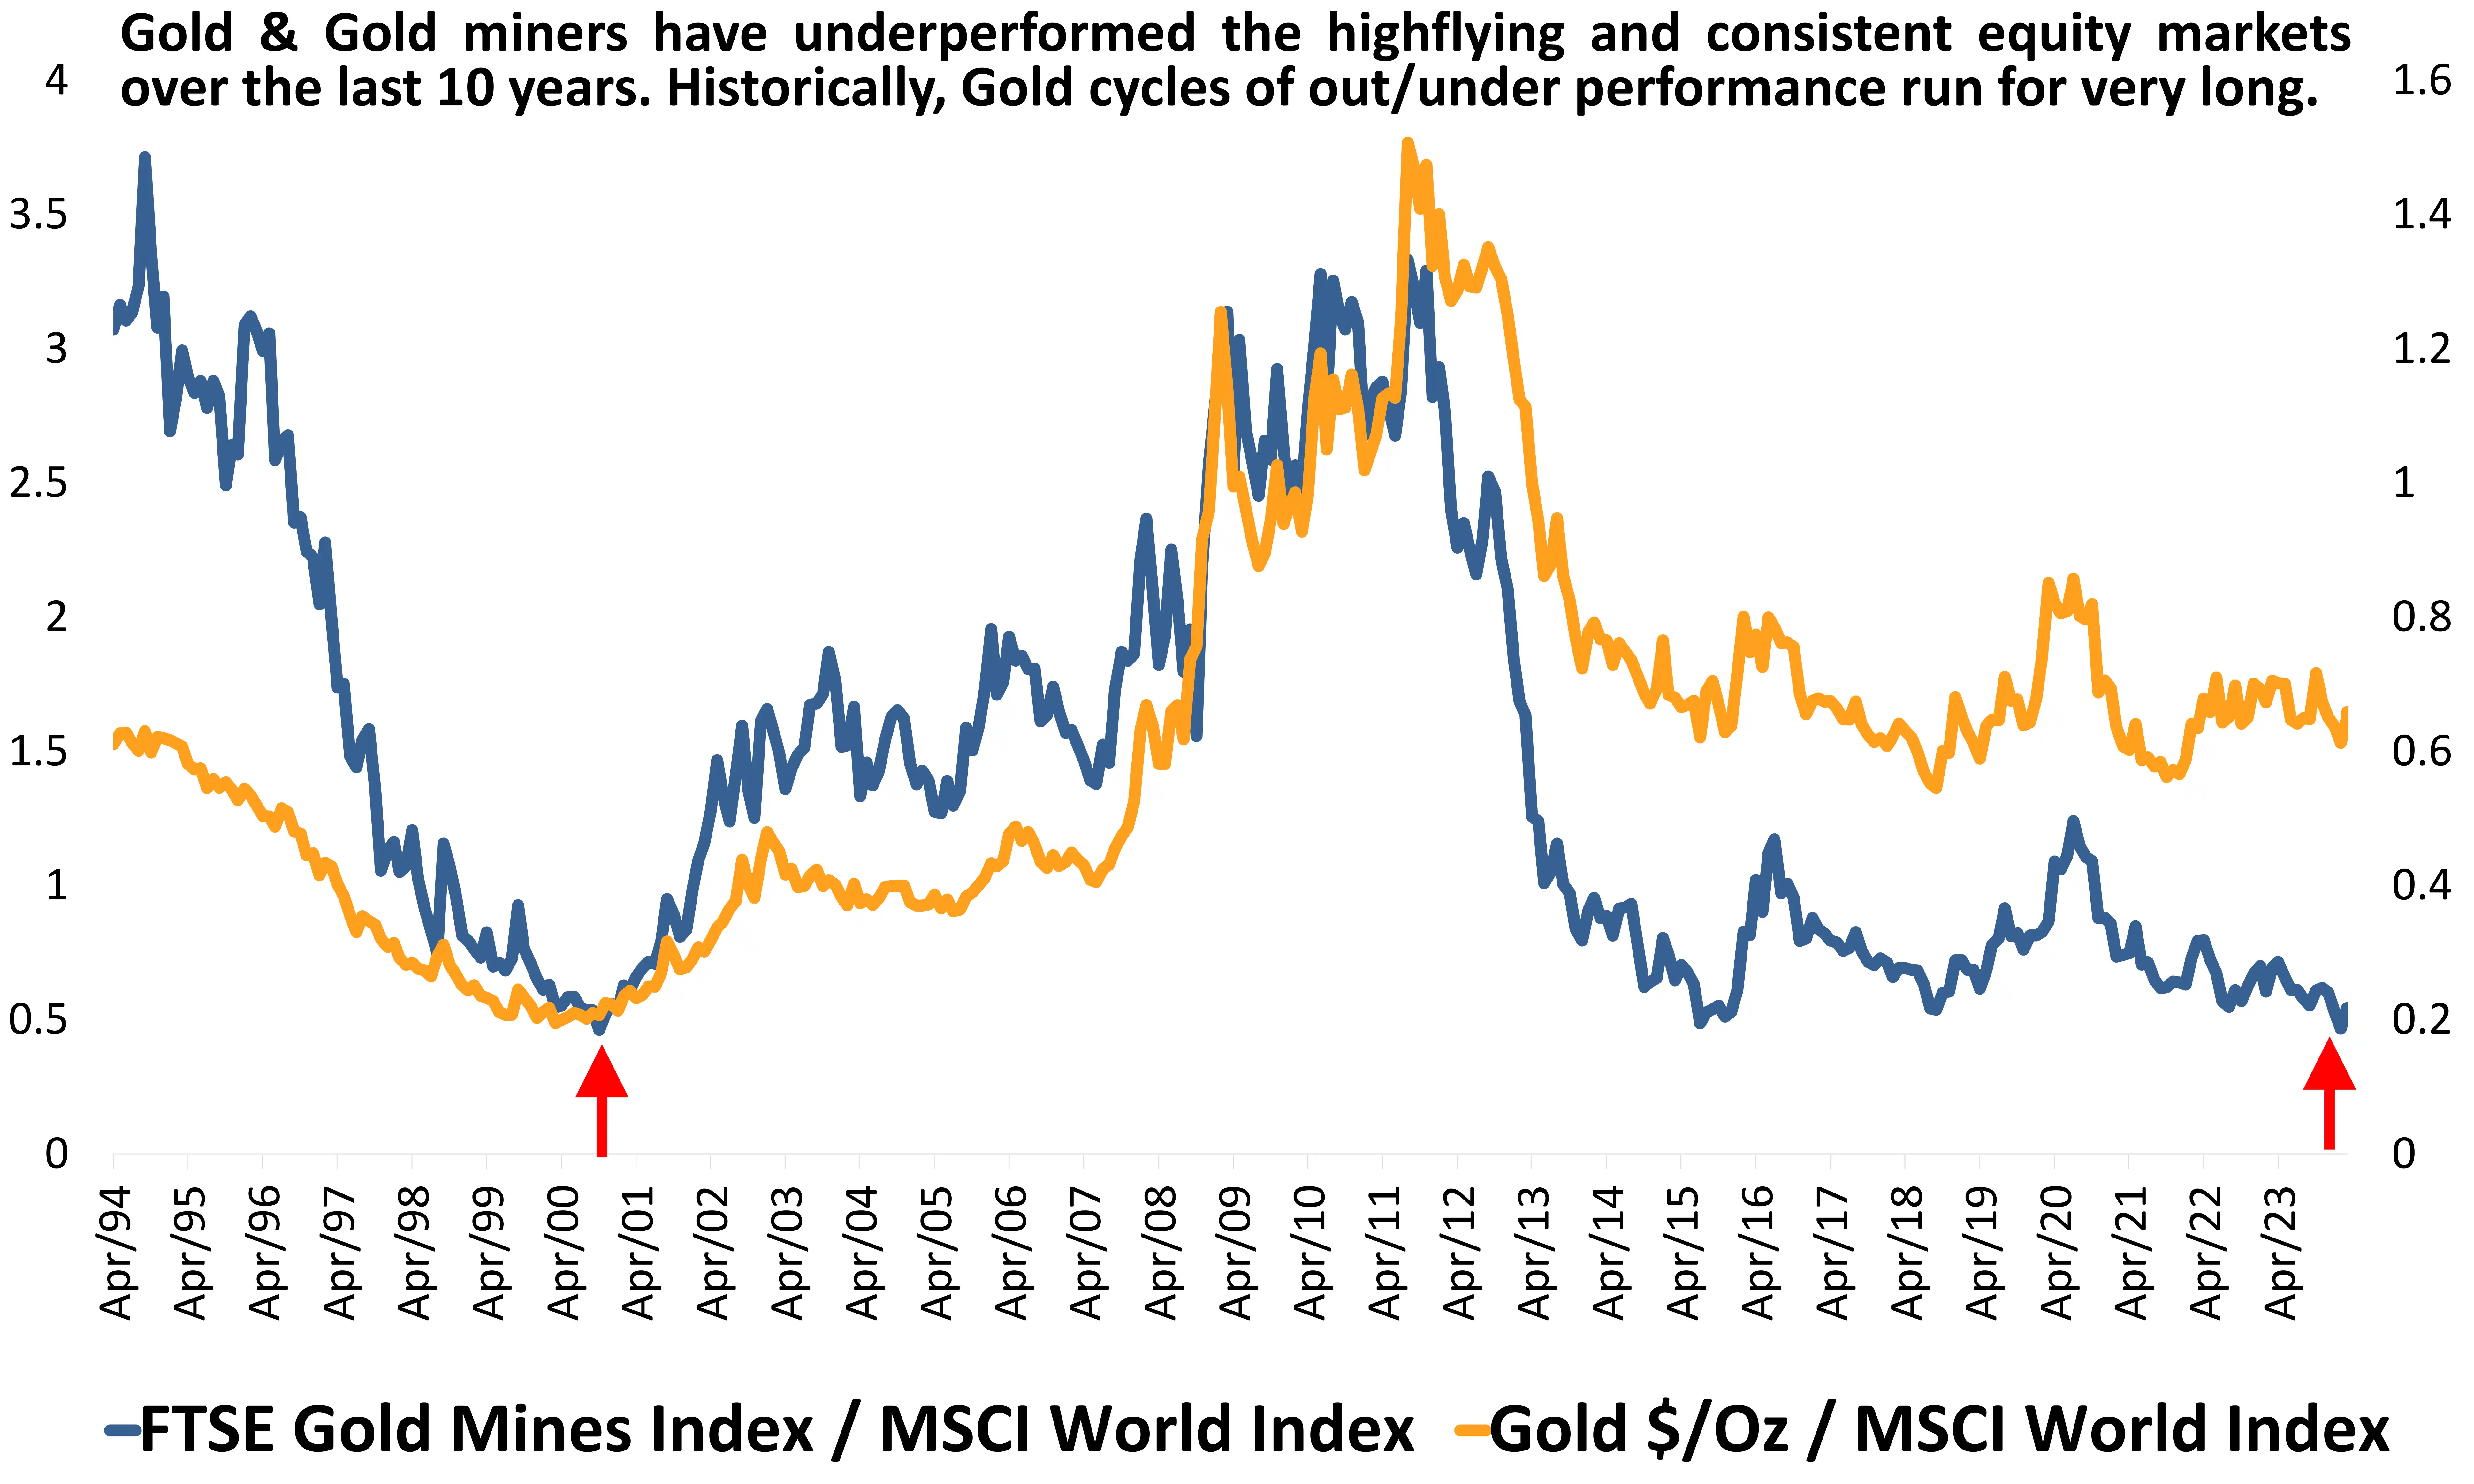
Gold & Gold Miners Are Relatively Better Priced Versus World Equities
Gold mining firms and Gold, both have underperformed stocks over the last 10 years. Gold mining firms had their own ‘dot com’ bubble at the peak of the last cycle in 2011.
The firms were deep neck in debt, were doing record capex and guiding for higher Gold prices, forever. Anybody who had seen the 1999 to 2011 Gold bull run would have made similar assumption. But Gold peaked and miners were left with huge debt to service amidst declining top line, challenged profit margins and to hurt the sector more, Crude oil prices traded over $100 for the next 3 years. This was sort of ‘worst of all worlds’ scenario for this sector. The sector went through a derating over the next decade. The market leader, Barrick Gold, rerated from 40x PE to 16x PE through the cycle.
Since then, the gold miners have delivered and cleaned their balance sheets. Oil prices have stabilized. Miners are doing disciplined capex and are relatively cheaper. Gold miners have all the ingredients to do well, if Gold remains in a bull market.
Source: Bloomberg, DSP; Data as of Mar 2024
What Does History Say About Impact of Rate Hikes On US Economy
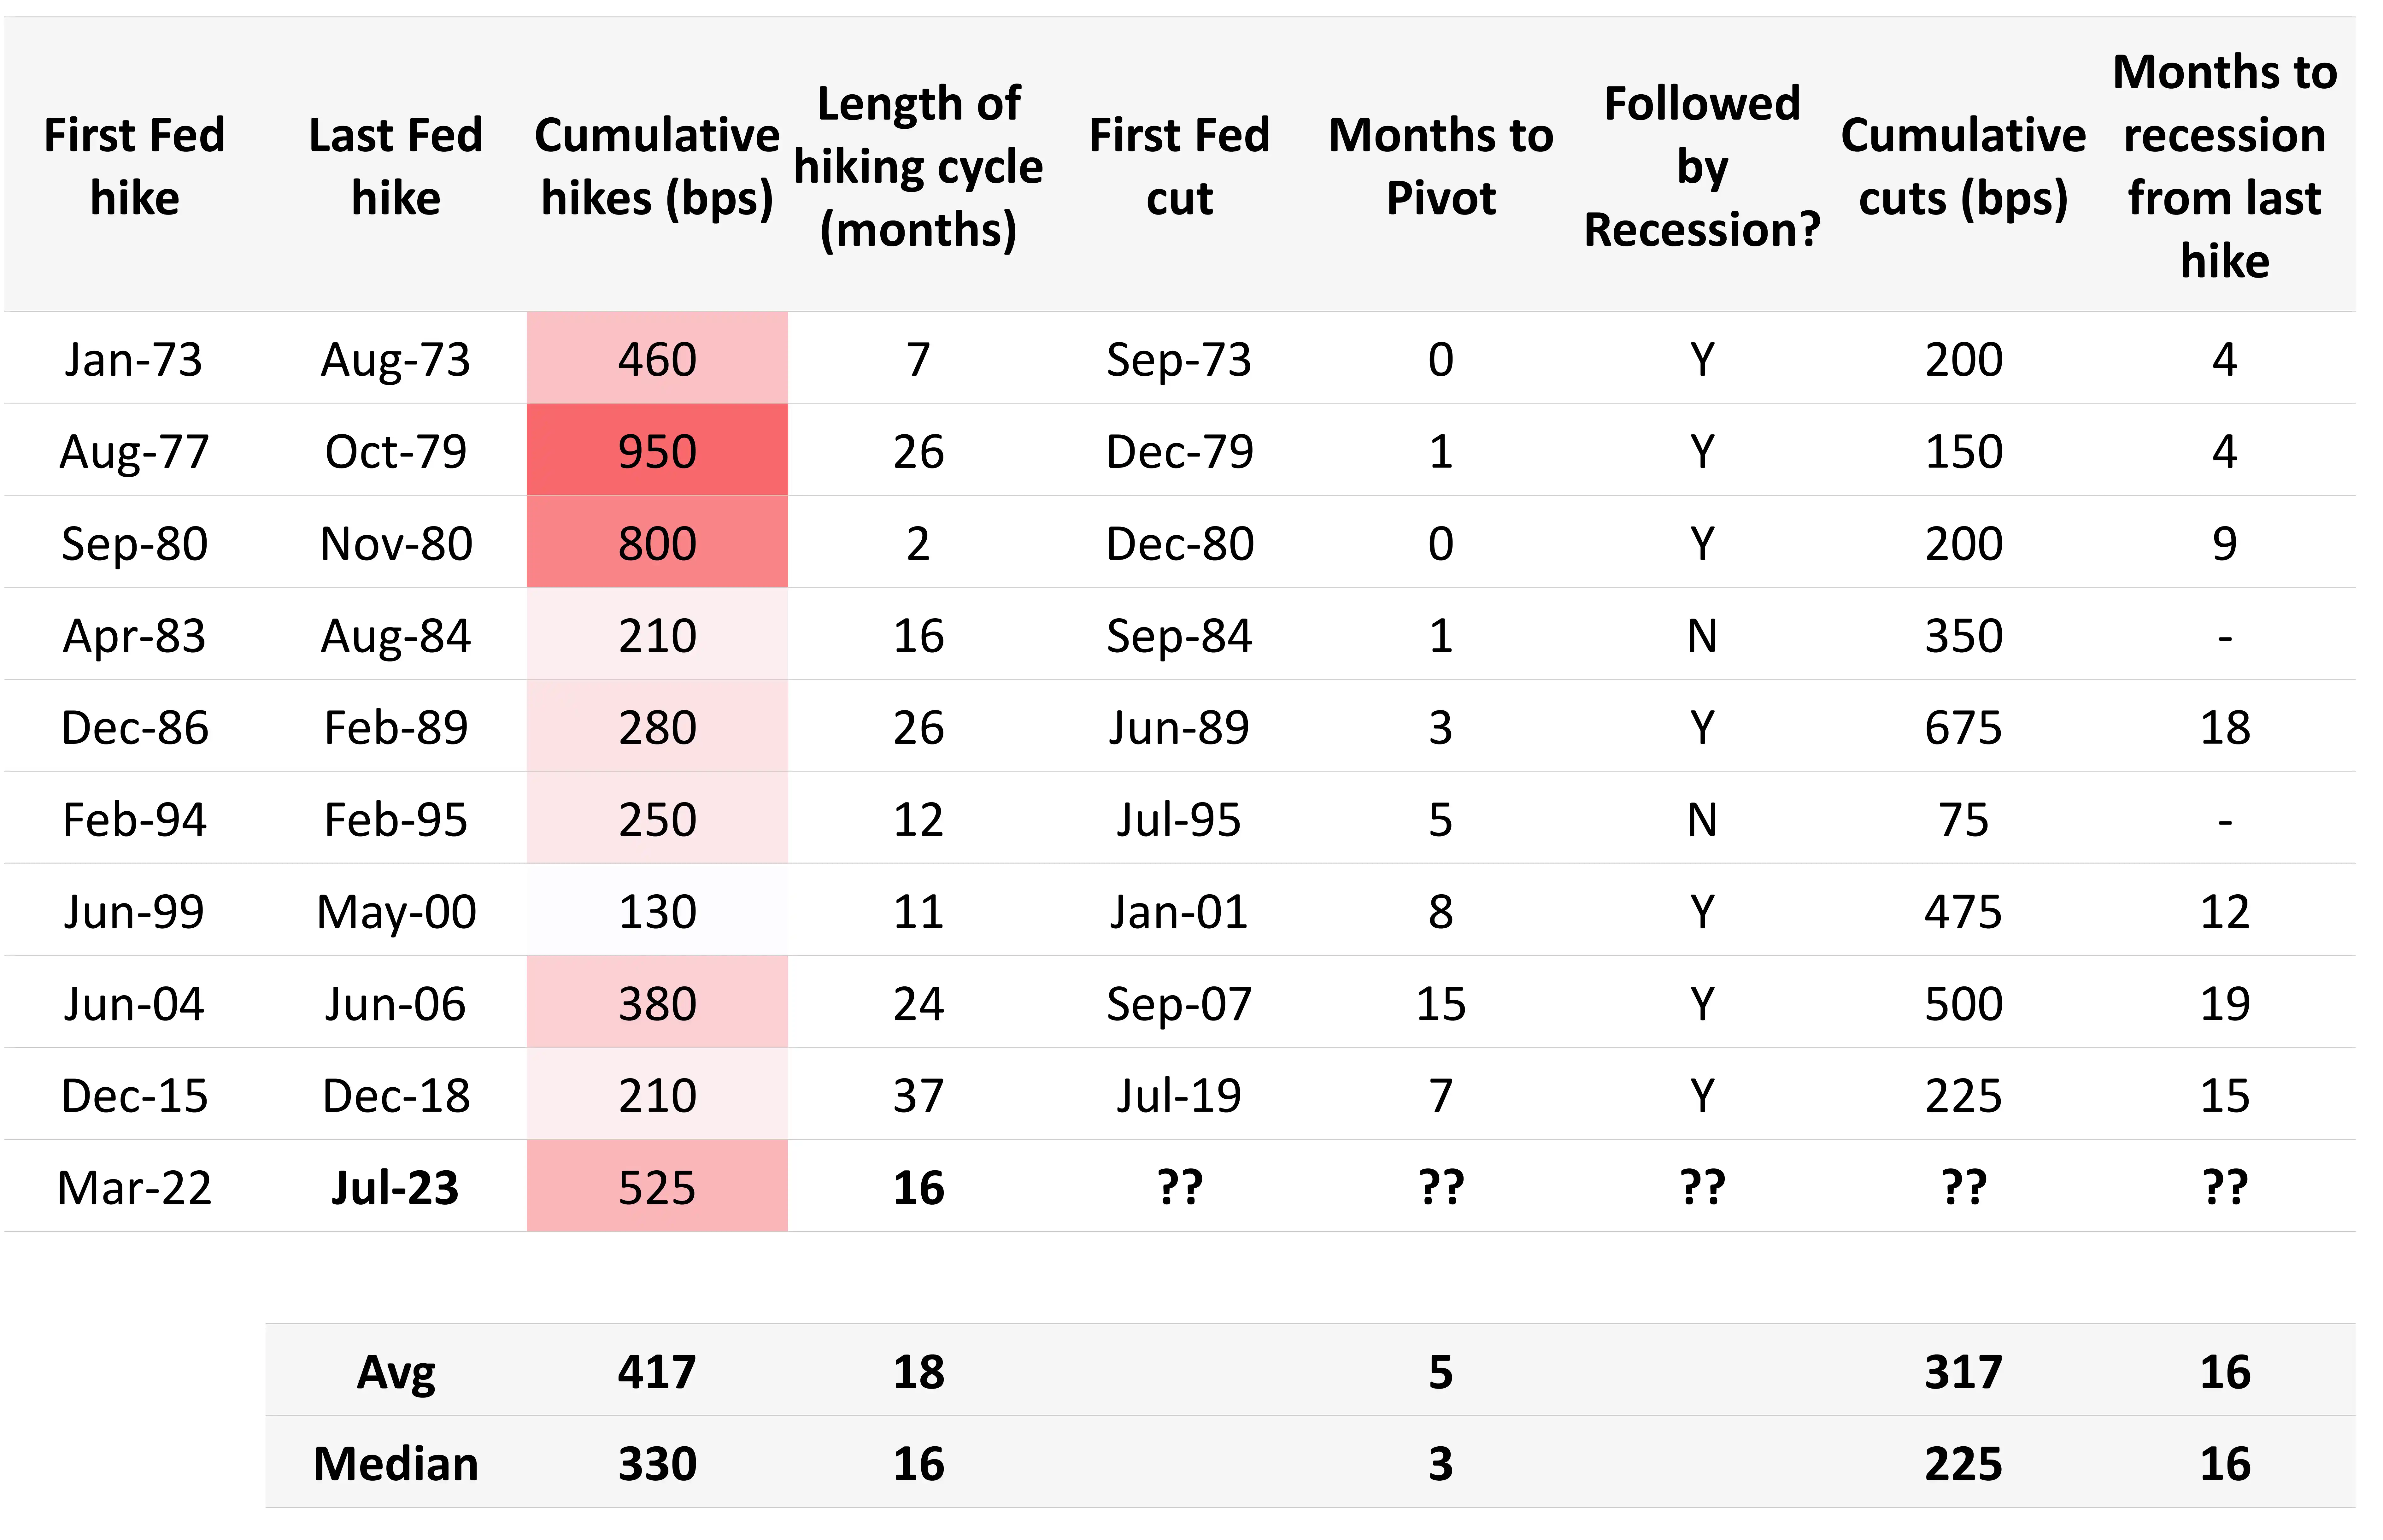
The Federal Reserve has kept rates at the peak of the cycle for a maximum of 12 months after which it embarked on rate cuts. This was preGFC 2008 cycle.
This is now the second longest hold at interest rate cycle high. The impact of higher rates on the economy is severe but it flows with a lag. As can be gleaned from the historical data table at the right, on an average there is a 16-month lag between last interest rate hike and a recession. There have been instances of this period getting stretched to 19 months also.
The cumulative hikes, so far, have also been above the historical average of 417 bps, currently at 525bps of rate hikes between Mar’22 to July’23.
Expect the countercyclical impact of monetary policy to show up in US economic data and impact corporate earnings growth and thus stock prices. We will enter this period, as per historical data, in Q2 to Q4 of CY24.
Source: Emkay Research, Madhavi Arora, DSP; Data as of Mar 2024
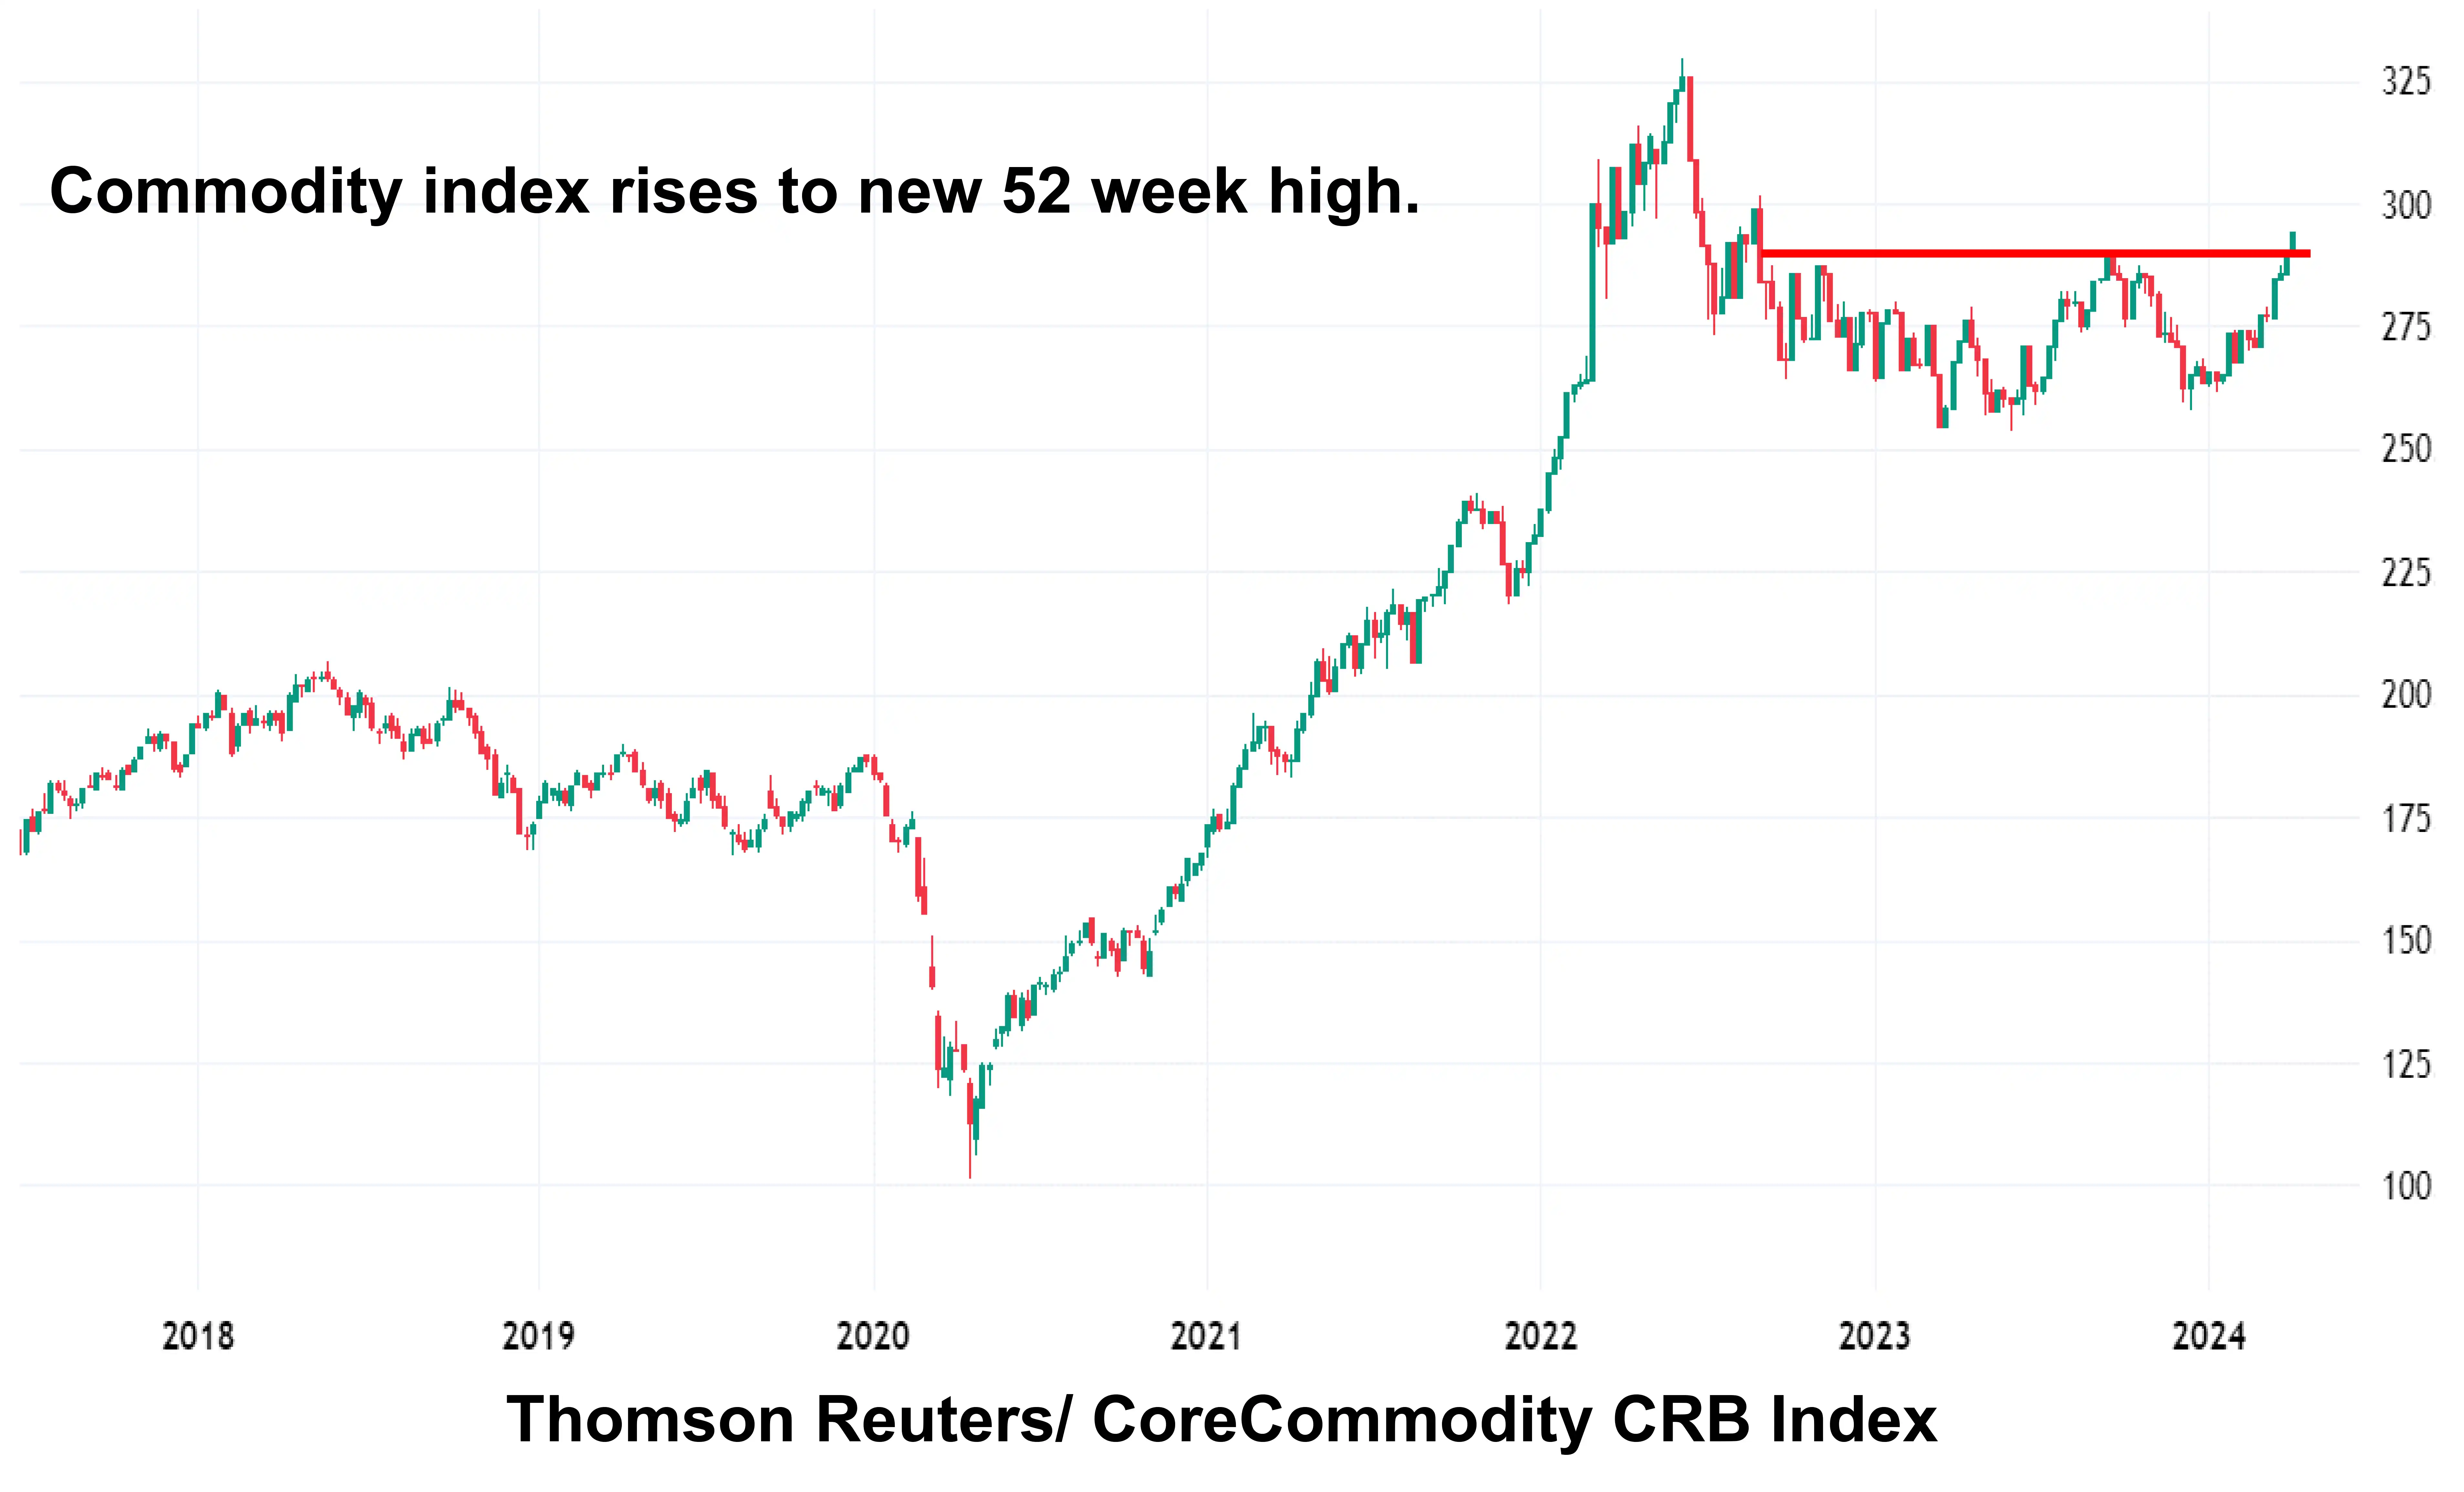
Commodity Index Rises To New 52 Week High
Led by strong gains in Gold and steady rebound in Crude oil prices, the Thomson Reuters/ CoreCommodity CRB Index has risen to a new 52 week high.
This is a development which is contrary to our expectation and demand supply dynamics for core commodities like metals and energy although precious metals reflect possibility of strong uptrend. The ability of this price rise to impact inflation and change the trajectory of interest rates cycle remainslimited for now. Further gains, especially if driven by crude oil and metal prices, could likely dent the case of rates cuts.
Lack of commensurate moves in interest rates, high yield bonds and term spreads of commodities indicate that this could be short lived, but we are keen to track this indicator further.
Gold, silver and other precious metals are likely to lead over the next few quarters and core commodities may lose momentum overtime.
Source: TradingView, DSP Data as on March 2024.
India Commands The Highest Derivatives Trading Volumes
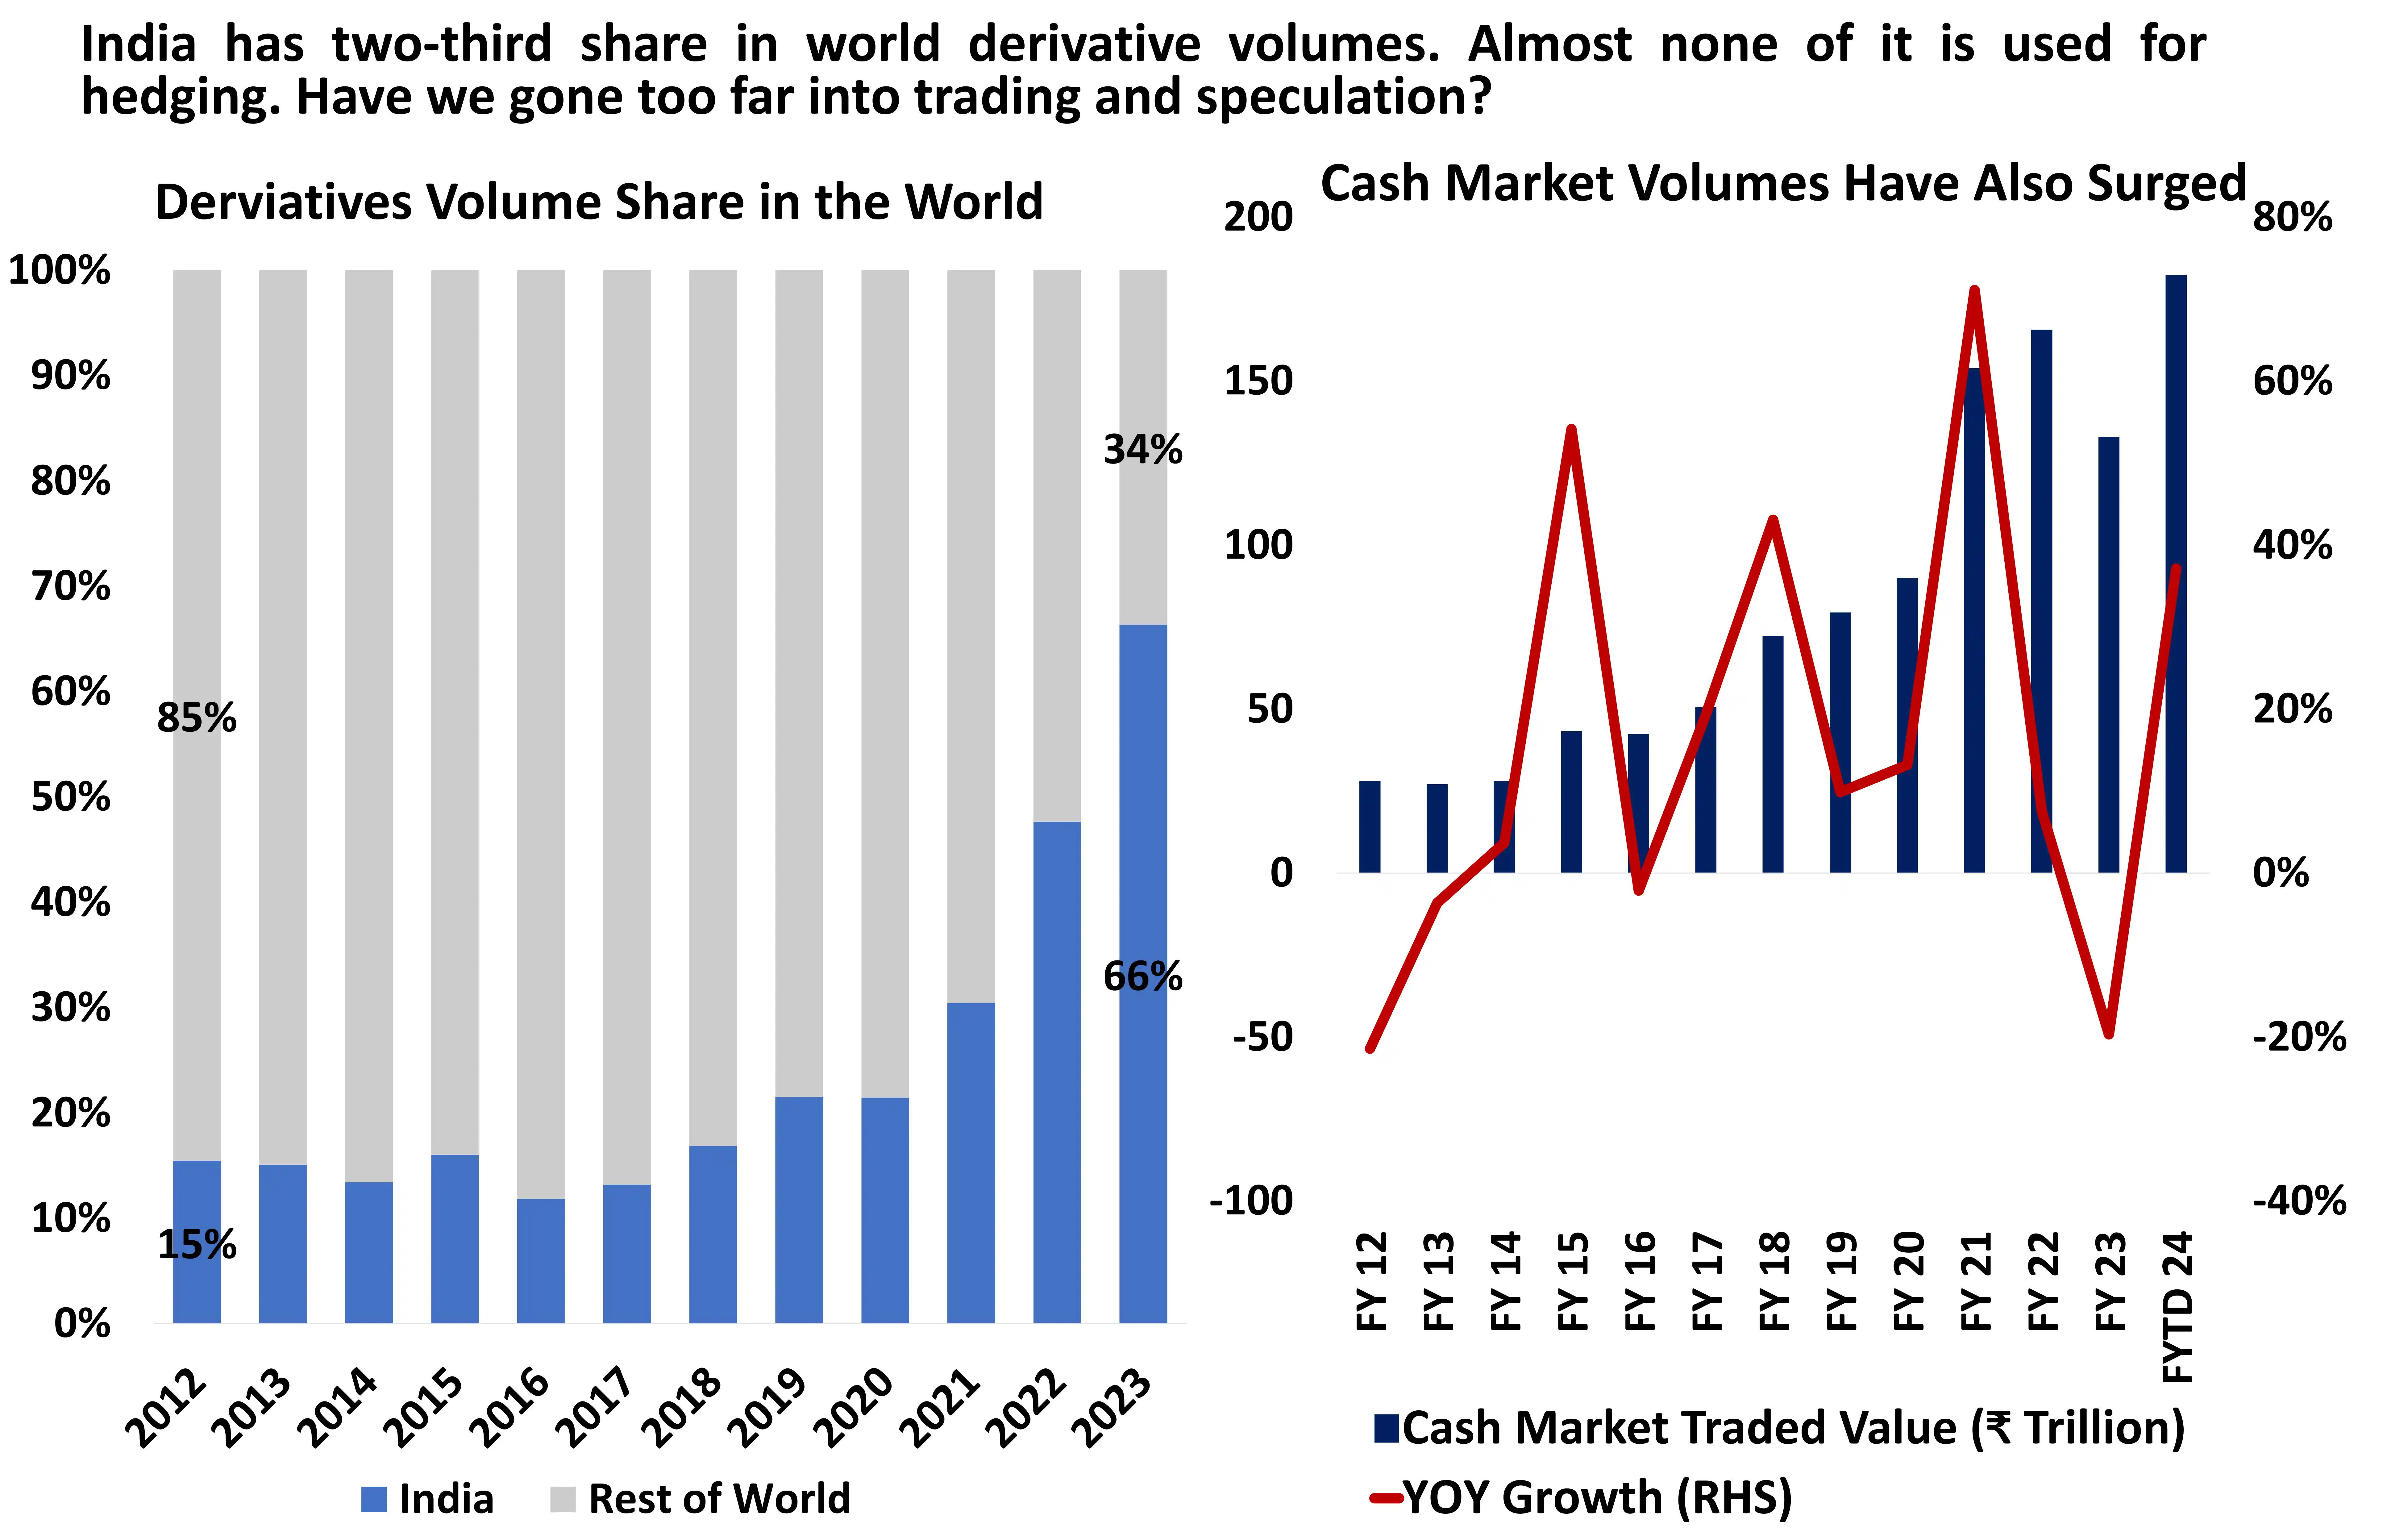
India’s share in derivatives volumes across the world is now a staggering two-third. This highlights the growing comfort with specialized and highly levered instruments, derivatives, among retails investors.
In the past, most economic and markets excesses were accompanied by high interest and inclination for derivative speculation.
None of these instances normalized without an instance of market disruption. The heightened derivatives trading volumes along with very low levels of volatility indicates an ‘unsettling calm’ which reflects market’s unpreparedness for an unknown shock.
This is not an indicator of a shock. This only indicates complacency, and a confidence driven by recent easy money environment.
Source: FIA, DSP; Data as of Mar 2024
2023: An Outlier From Fund Flows Perspective
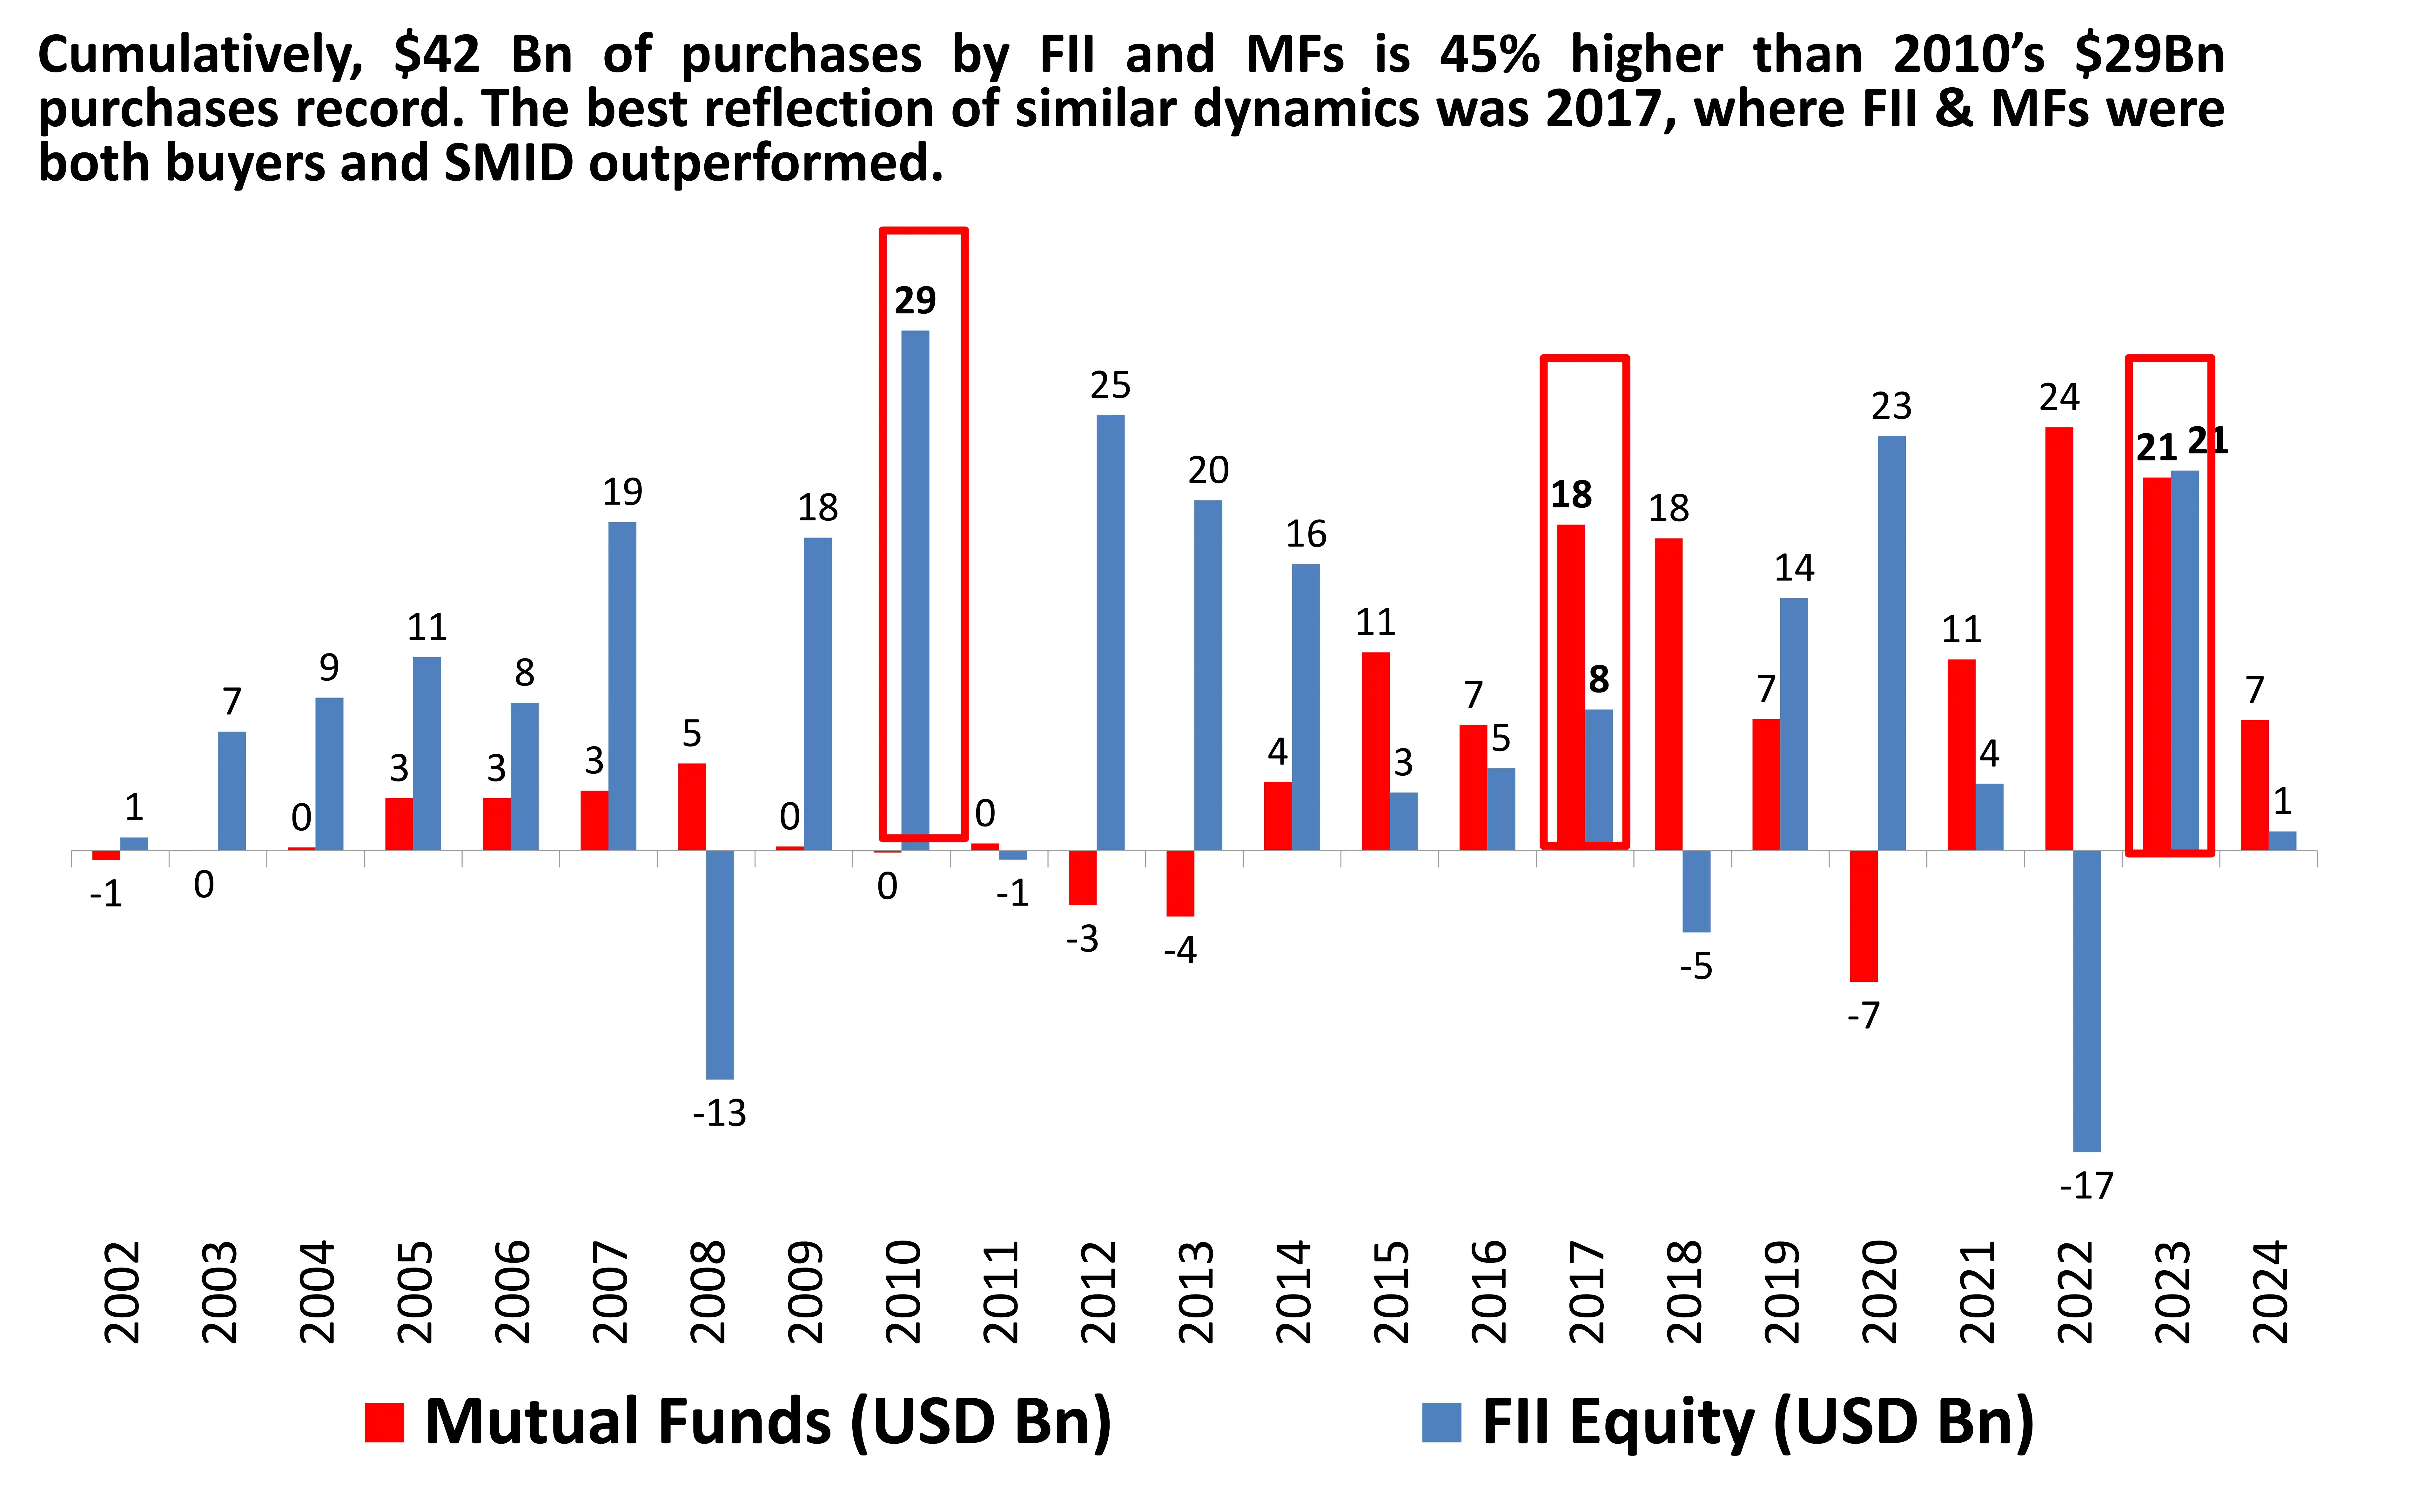
2023 was the only year where FII & DII bought close to record amounts of Indian equities, that too in similar amounts
Similarities between the ‘unsettling calm’ of 2017 and now:
- Similar institutions flows
- Identical low volatility uptrend
- Significant outperformance by SMID stocks over large caps
- Valuations extremes for SMIDs on relative basis over large caps
All these indicate that the current rally in overstretched part of the market is likely to give way to long period of consolidation or a steep correction.
Source: Bloomberg, DSP; Data as of Mar 2024
Measures of Risk: The VMF Indicator
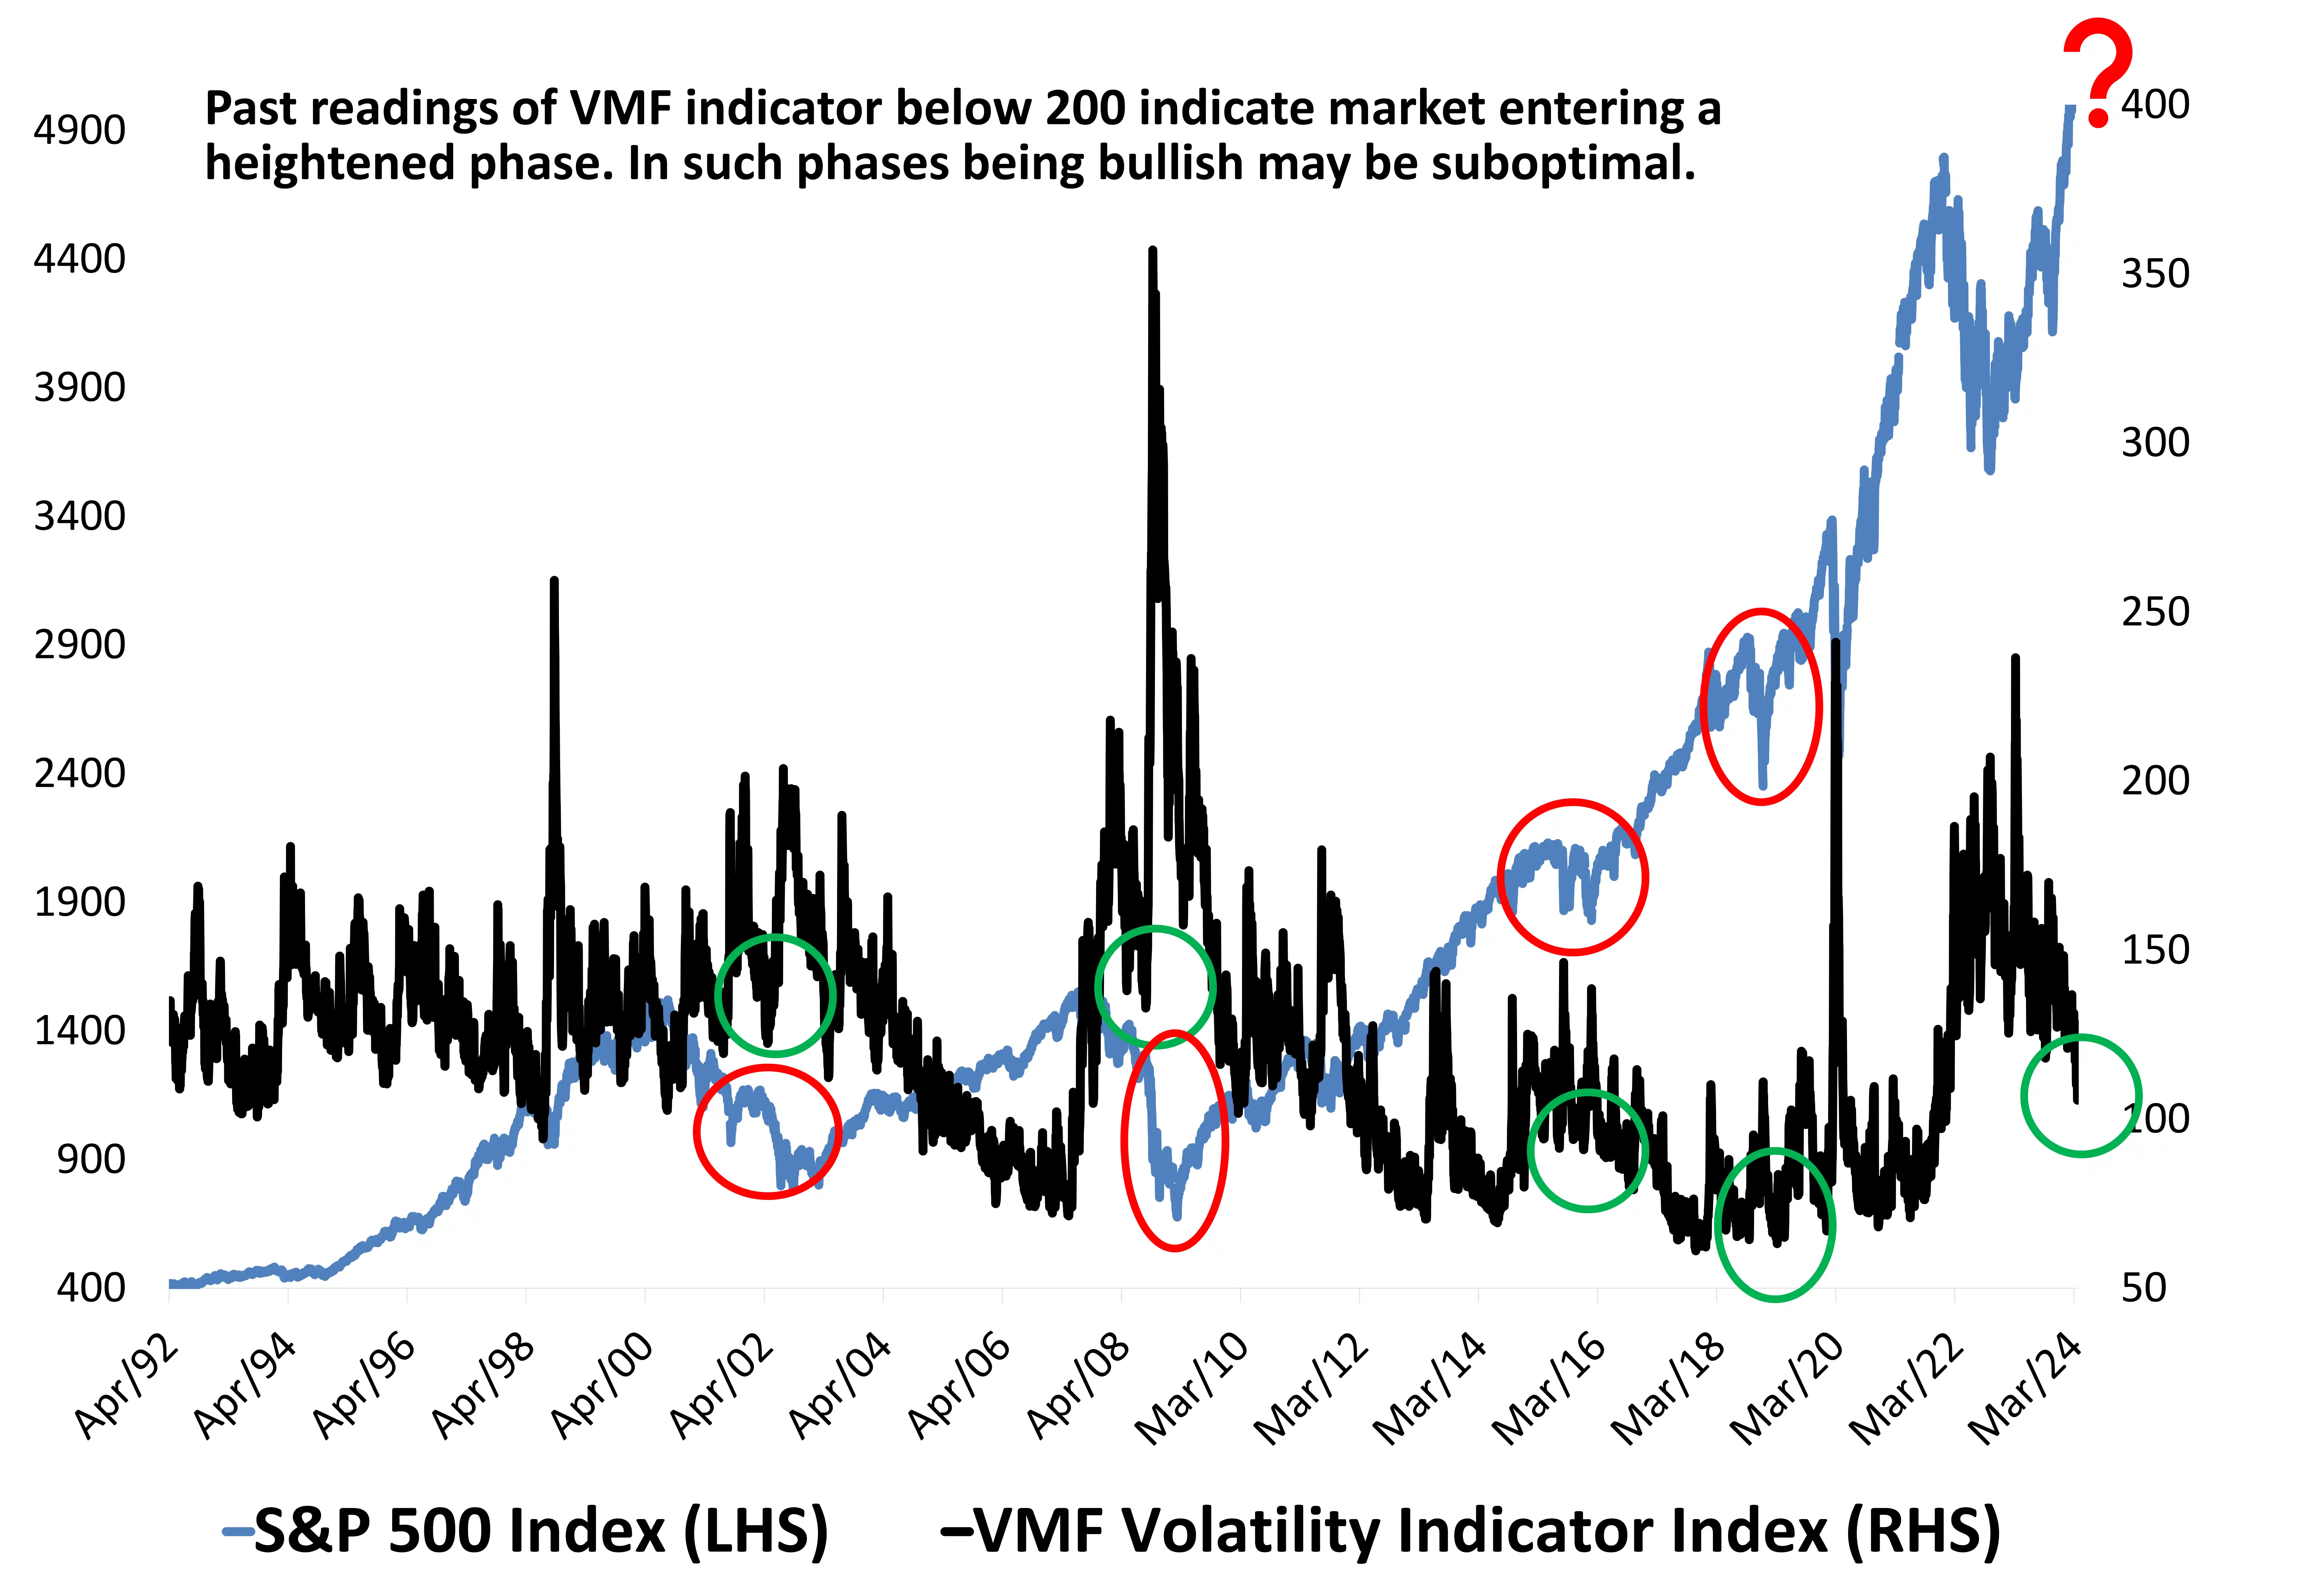
VMF(VIX, MOVE and FX volatility index) indicator is our inhouse indicator which measures the combined volatility in stocks, bonds and currency markets. Elevated readings in this indicator mean that all three asset classes are under stress at the same time.
Currently, we are witnessing lower readings across all the three underlying volatility indices. In the first week of Oct’22, this indicator reached a level which signaled the possibility of a bottoming out process in markets. During the March’23 banking crisis the indicator once again spiked and has begun to cool off. The ‘Risk-off’ has run too far.
However, the readings now are towards the lower end, which shows it could be more prudent to be pessimistic on stocks.
Source: DSP, Bloomberg Data as on March 2024
SMID Median Valuations Were Double Versus The 2007 Peak
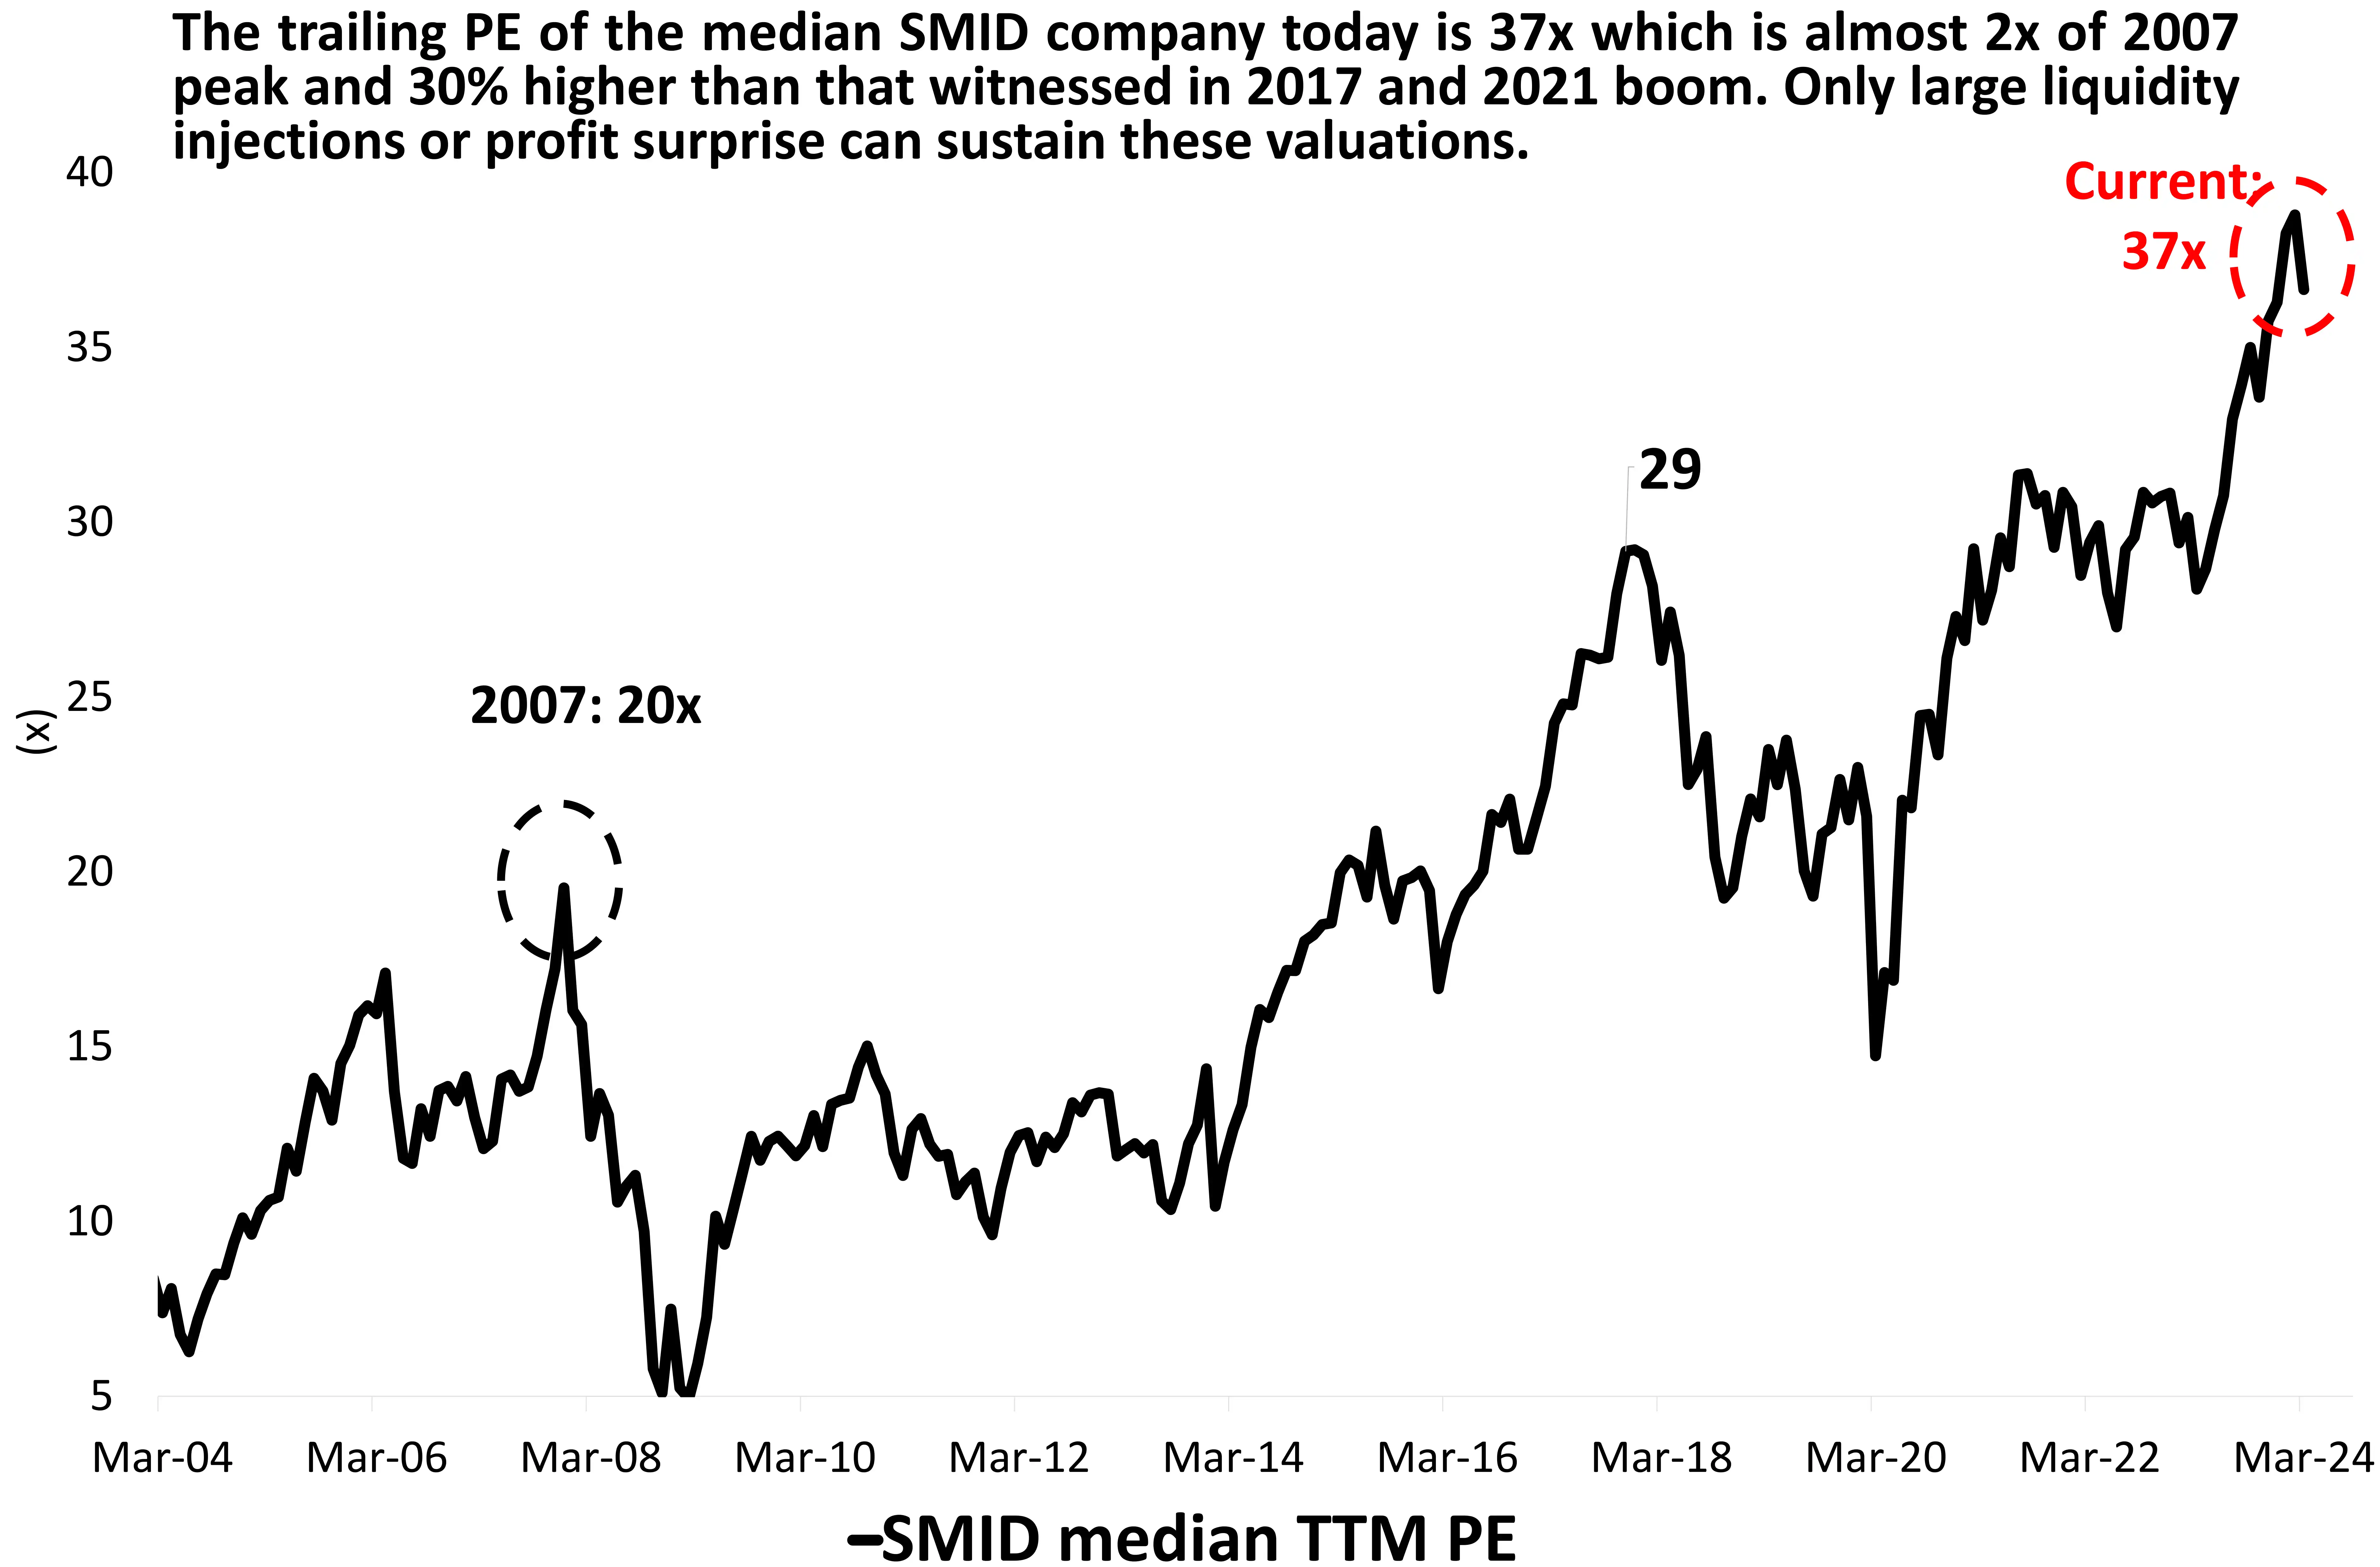
The median valuation (on a trailing price to earnings basis) for the SMID universe peaked at nearly double of what it was in 2007 bull market peak.
These are the kind of readings which are hard to make sense of in real time. In real time, there are so many justifications on why this is normal, that it is hard to stand out. But if history is any guide, when excesses begin to pile up, they can continue in the same direction for an unknown period. It doesn’t mean that it pays to participate in excesses. It is equally important to use historical data as a guiding light and align exposure.
Current SMID valuations offer little comfort. One must be purely ‘bottoms-up’ to find opportunities and avoid excessively priced stocks in this segment.
Source: Nuvama Research, DSP; Data as of Mar 2024
Small & Midcap Market Cap to GDP Hits Record
Small & Midcap stocks have rallied to levels at which, as a percent of India nominal quarterly GDP, they have hit a record. This level, at 52% currently, is now higher than that seen in the roaring bull market of 2003-07.
This is not without a reason. SMIDs have shown strong earnings growth momentum and high quality of earnings growth. However, the current valuations are stretched. SMIDs are trading north of 90 percentile of their valuation band. This means they are in an expensive zone.
Also, market cap to GDP isn’t a remarkably useful indicator. But it can indicate extremities when one segment of the market deviates from their long-term average. Currently, SMIDs Mcap to GDP is at a 79% premium to the long-term average.
Source: Investec, Bloomberg, DSP; Data as of Mar 2024
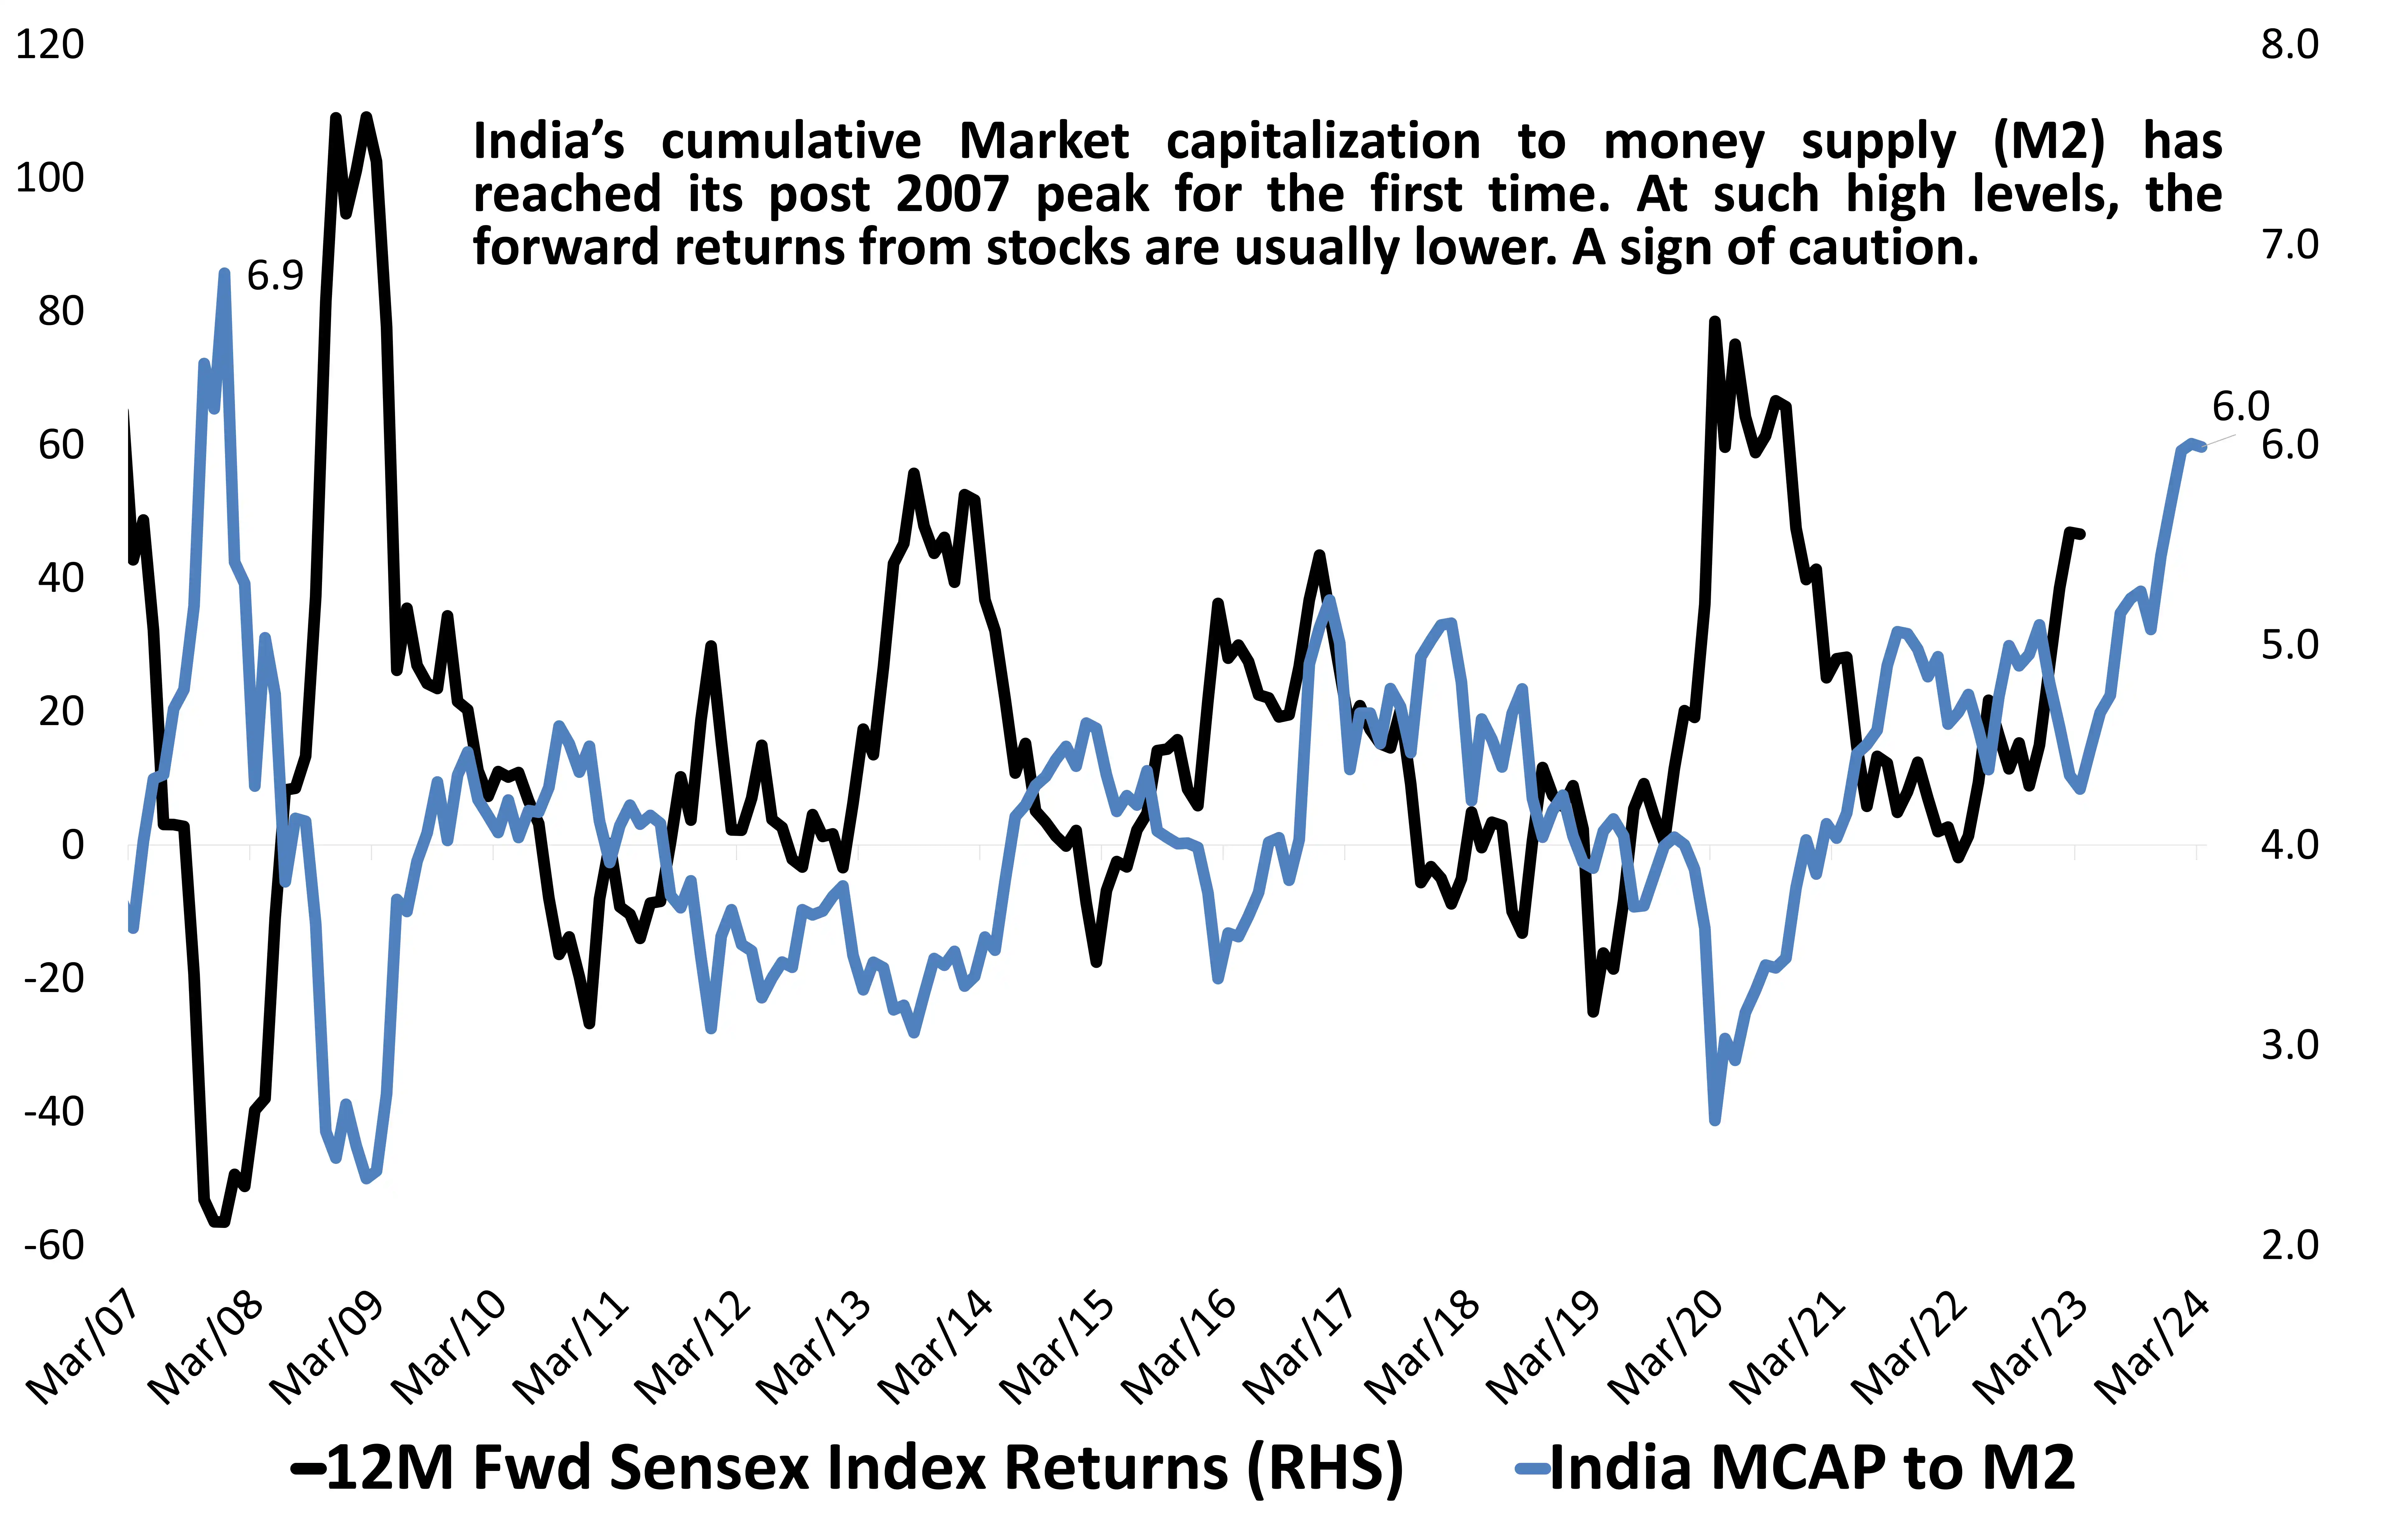
India Equity Market Cap to Money Supply Hits Record
It pays to buy stocks when they are cheaper and out of favour. One instance was the extreme valuations comfort at the lows of COVID crisis. Other instances include the steep decline in 2015-16 and the prolonged lull during the 2011-13 sideways market. During these instances, stocks earned handsome returns from oversold and attractive levels of valuations.
Currently, India’s equity market capitalization to money supply (M2) is trading at its most expensive level outside of the 2003-07 stock market peak.
M2 is a broad measure of the money supply that includes cash, checking deposits, savings deposits, and certain types of time deposits and money market funds. M2, nominal GDP and corporate earnings growth broadly grow at similar pace over a long period. This makes this ratio an important indicator, for highlighting extremes.
Source: Bloomberg, DSP; Data as of Mar 2024
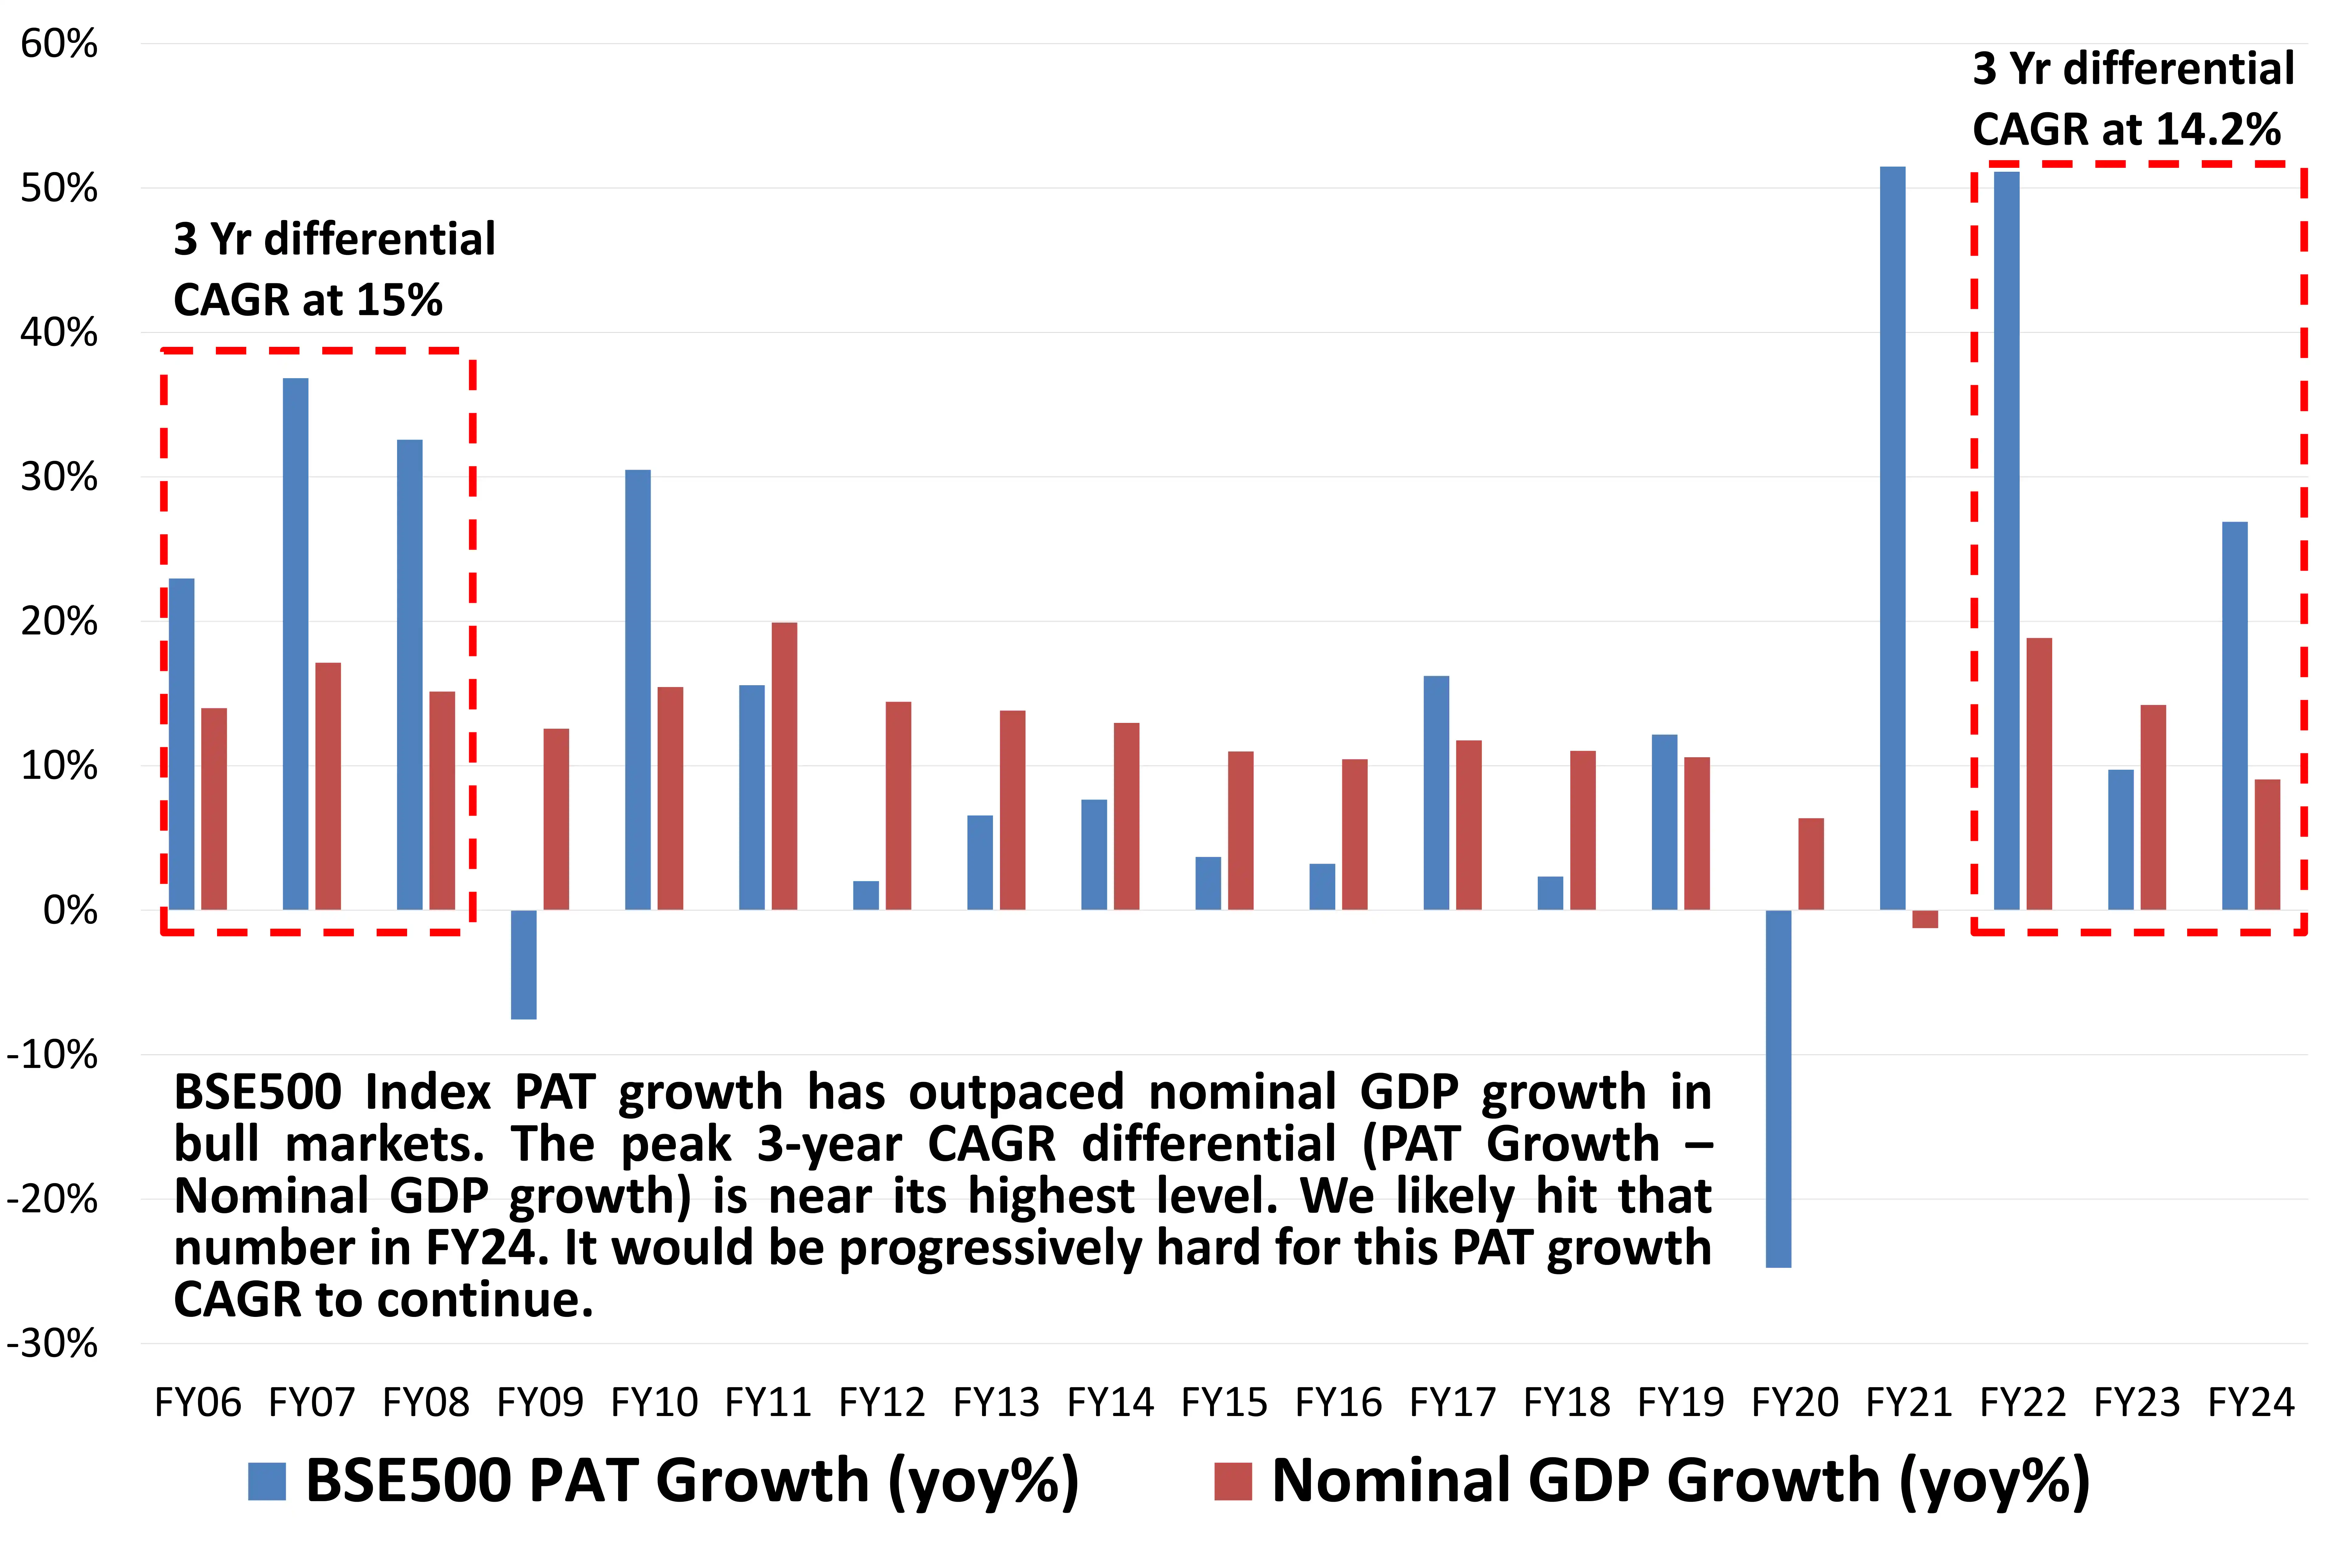
PAT Growth Outpacing Nominal GDP Near It’s Best Reading
As is evident from the Market Cap to M2 reading, equities have reached such extreme readings because profit growth has endured strong trend. Over the last 4 years, BSE 500 Index PAT growth has been higher than nominal GDP growth.
This outperformance of profit growth is a feature of bull markets.
As is evident that each instance of profit growth exceeding nominal GDP growth is marked by strong equity market performance, the highest differential that we have seen on a rolling 3yr CAGR basis was in 2007, at 15%. This number reached 14.2% at the end of FY24.
With nominal GDP slowing, sales growth for BSE 500 slowing and margins beginning to peak and contract, this trend is likely to normalize and pressurize stock prices in FY25.
Source: Investec, Bloomberg, DSP; Data as of Mar 2024
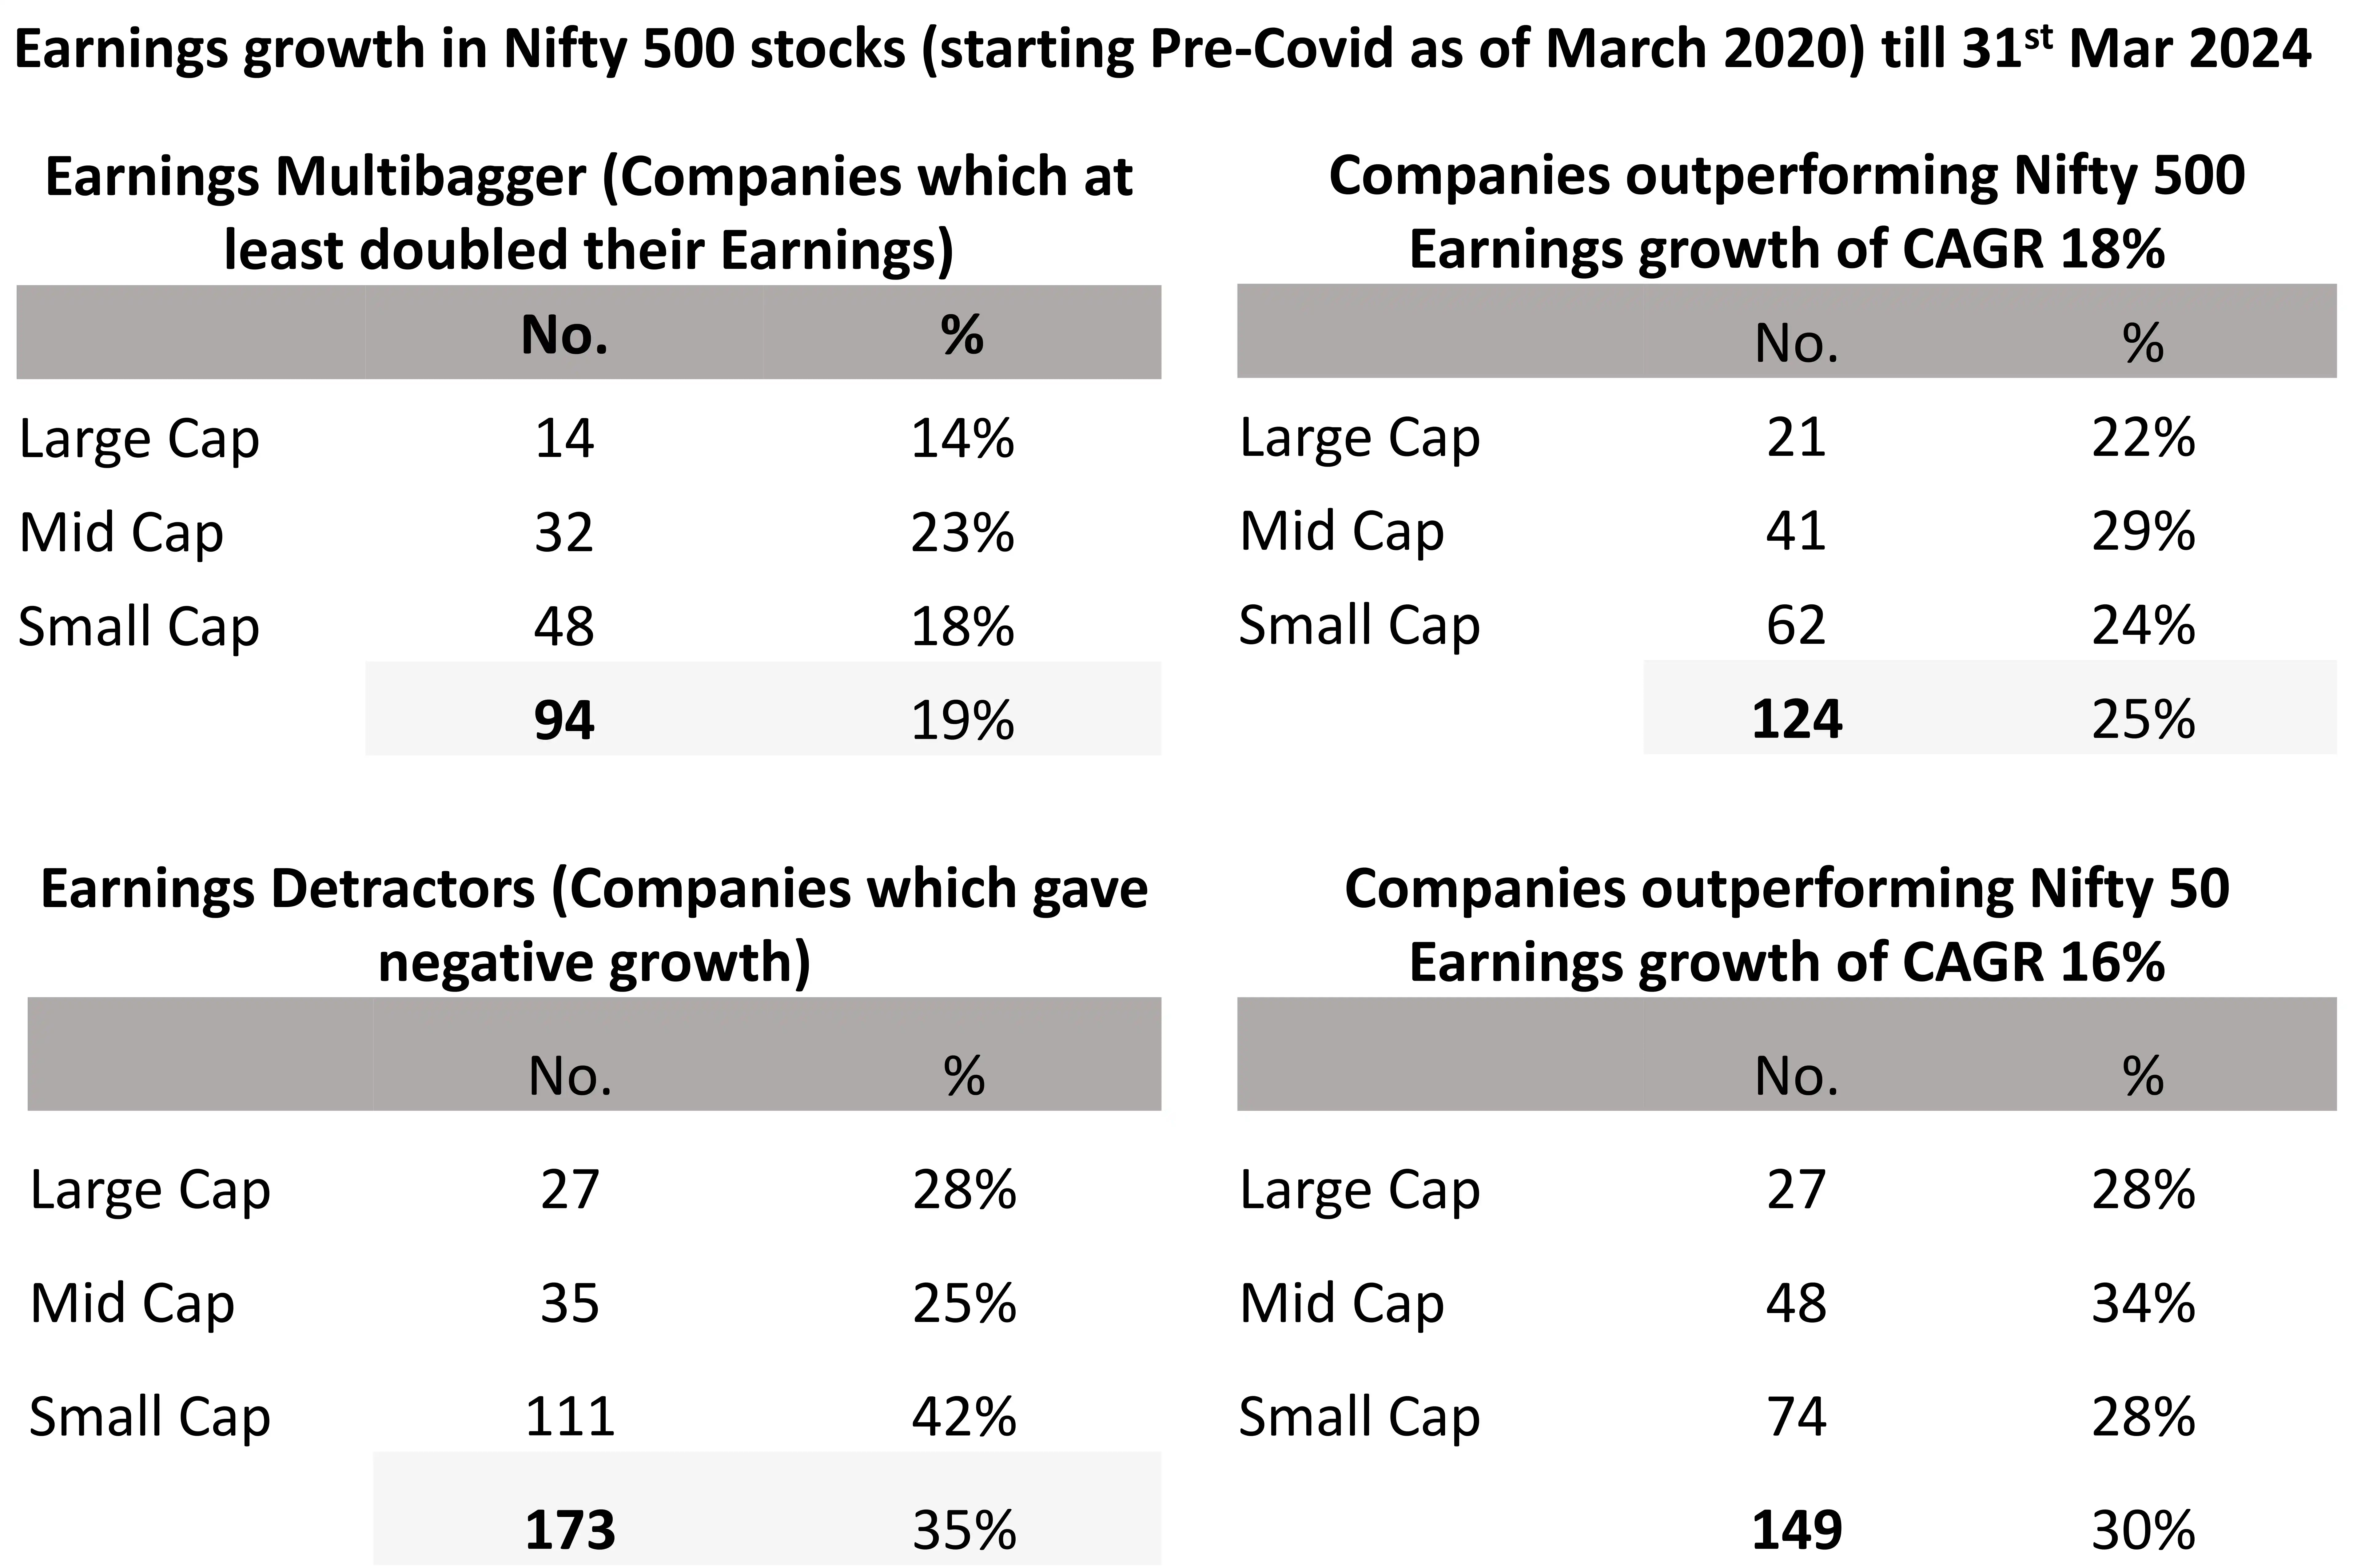
The Earnings Multibaggers
From the last quarterly earnings (March 2020), before COVID led disruptions hit corporate earnings to end of FY24, there is diverse performance from companies.
Nearly one in five firms have delivered multibaggers earnings growth. This means their earnings have doubled or more during this period. This is a healthy pace of growth where earnings CAGR exceeds 19%.
Every fourth firm has outperformed NSE500 Index earnings growth CAGR of 18% and nearly one in three have outperformed Nifty earnings growth of 16%.
These are remarkably strong numbers which showcase why India has delivered such a superior performance across market capitalization.
However, these numbers have begun to slow. The consensus growth for FY25 is likely to be below 15% and can derail the strong bull market of last four years.
Source: Q4FY24 estimates from Bloomberg; DSP, Data as on Mar 2024
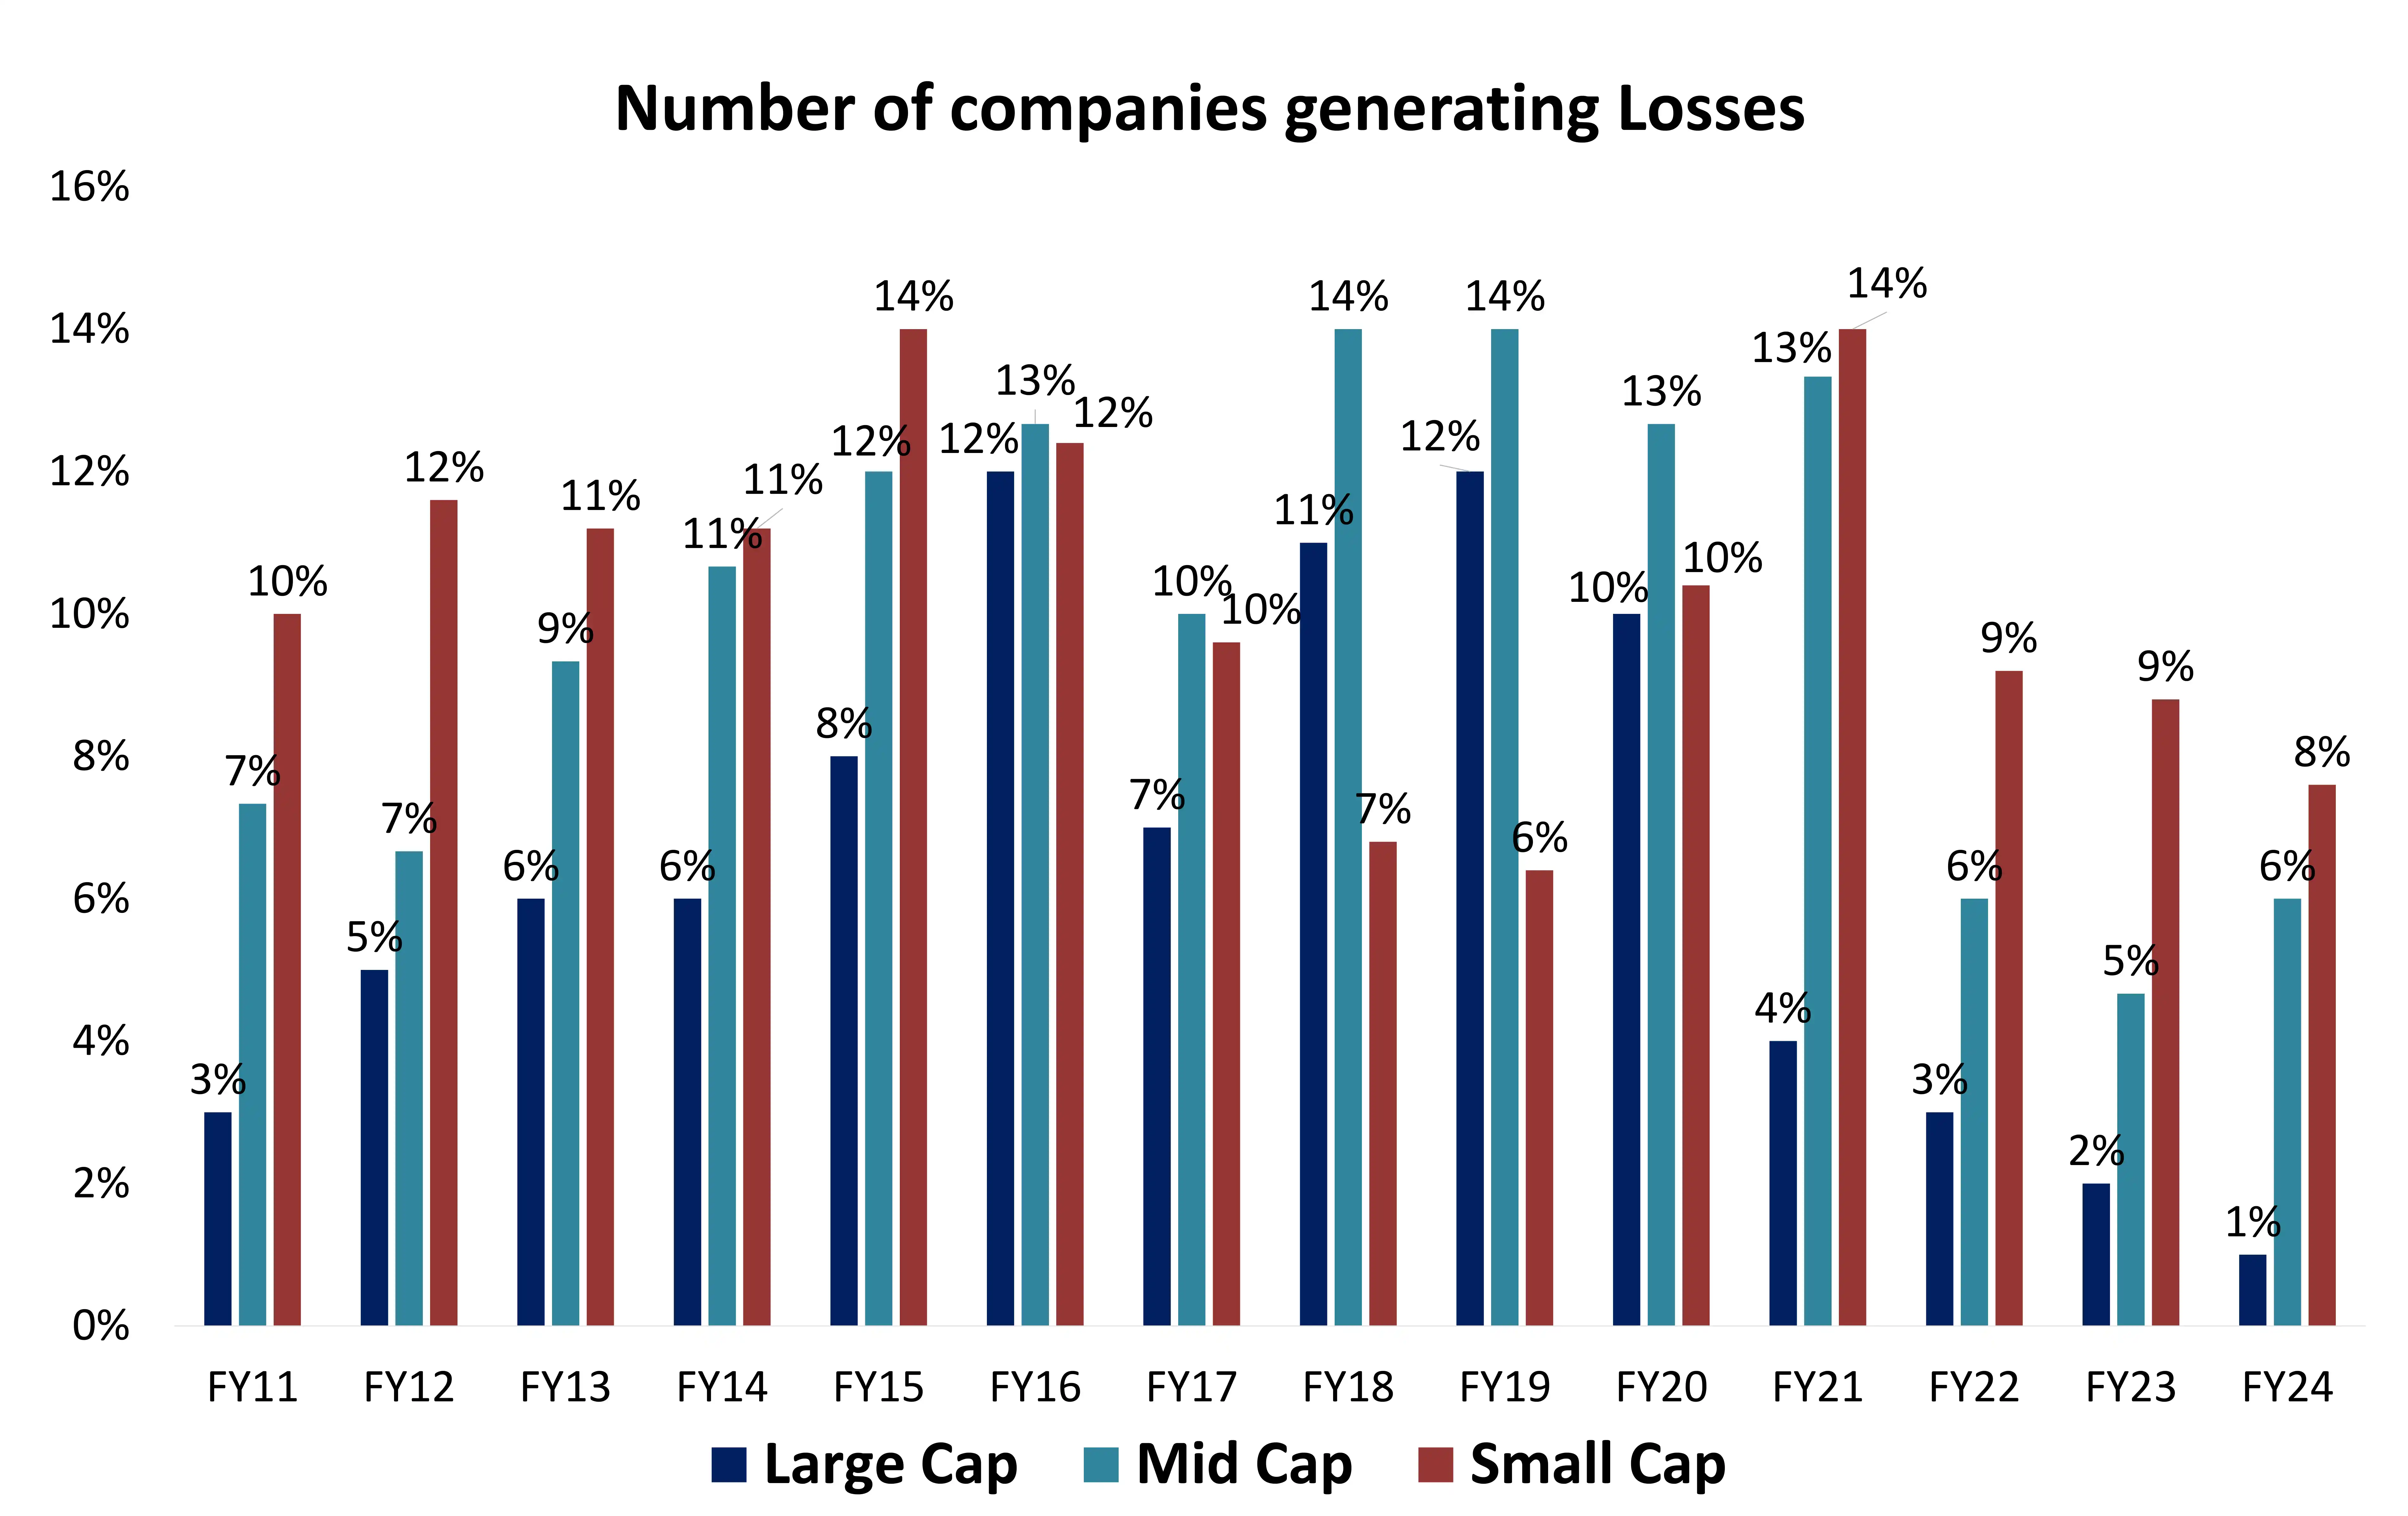
Number of Firms Reporting Losses At Record Lows
The surge in profitability on back of cost cuts, higher efficiency and the demand rush post COVID has reduced the number of loss-making firms to near record lows.
The extraordinary decline in loss making companies is a result of broad easing of financial conditions, high fiscal deficit led government spending and stable external situation for India coupled with resilient economic growth in India.
These factors rarely align like they have in the past three years. If they continue to remain aligned, the long-term trend of higher corporate profitability will remain strong.
This is a data worth tracking over the long term.
Source: Bloomberg; Data as on Mar 2024. Large caps are defined as top 100 stocks on market capitalization, mid caps as 101 250 and small caps as 251 and above.
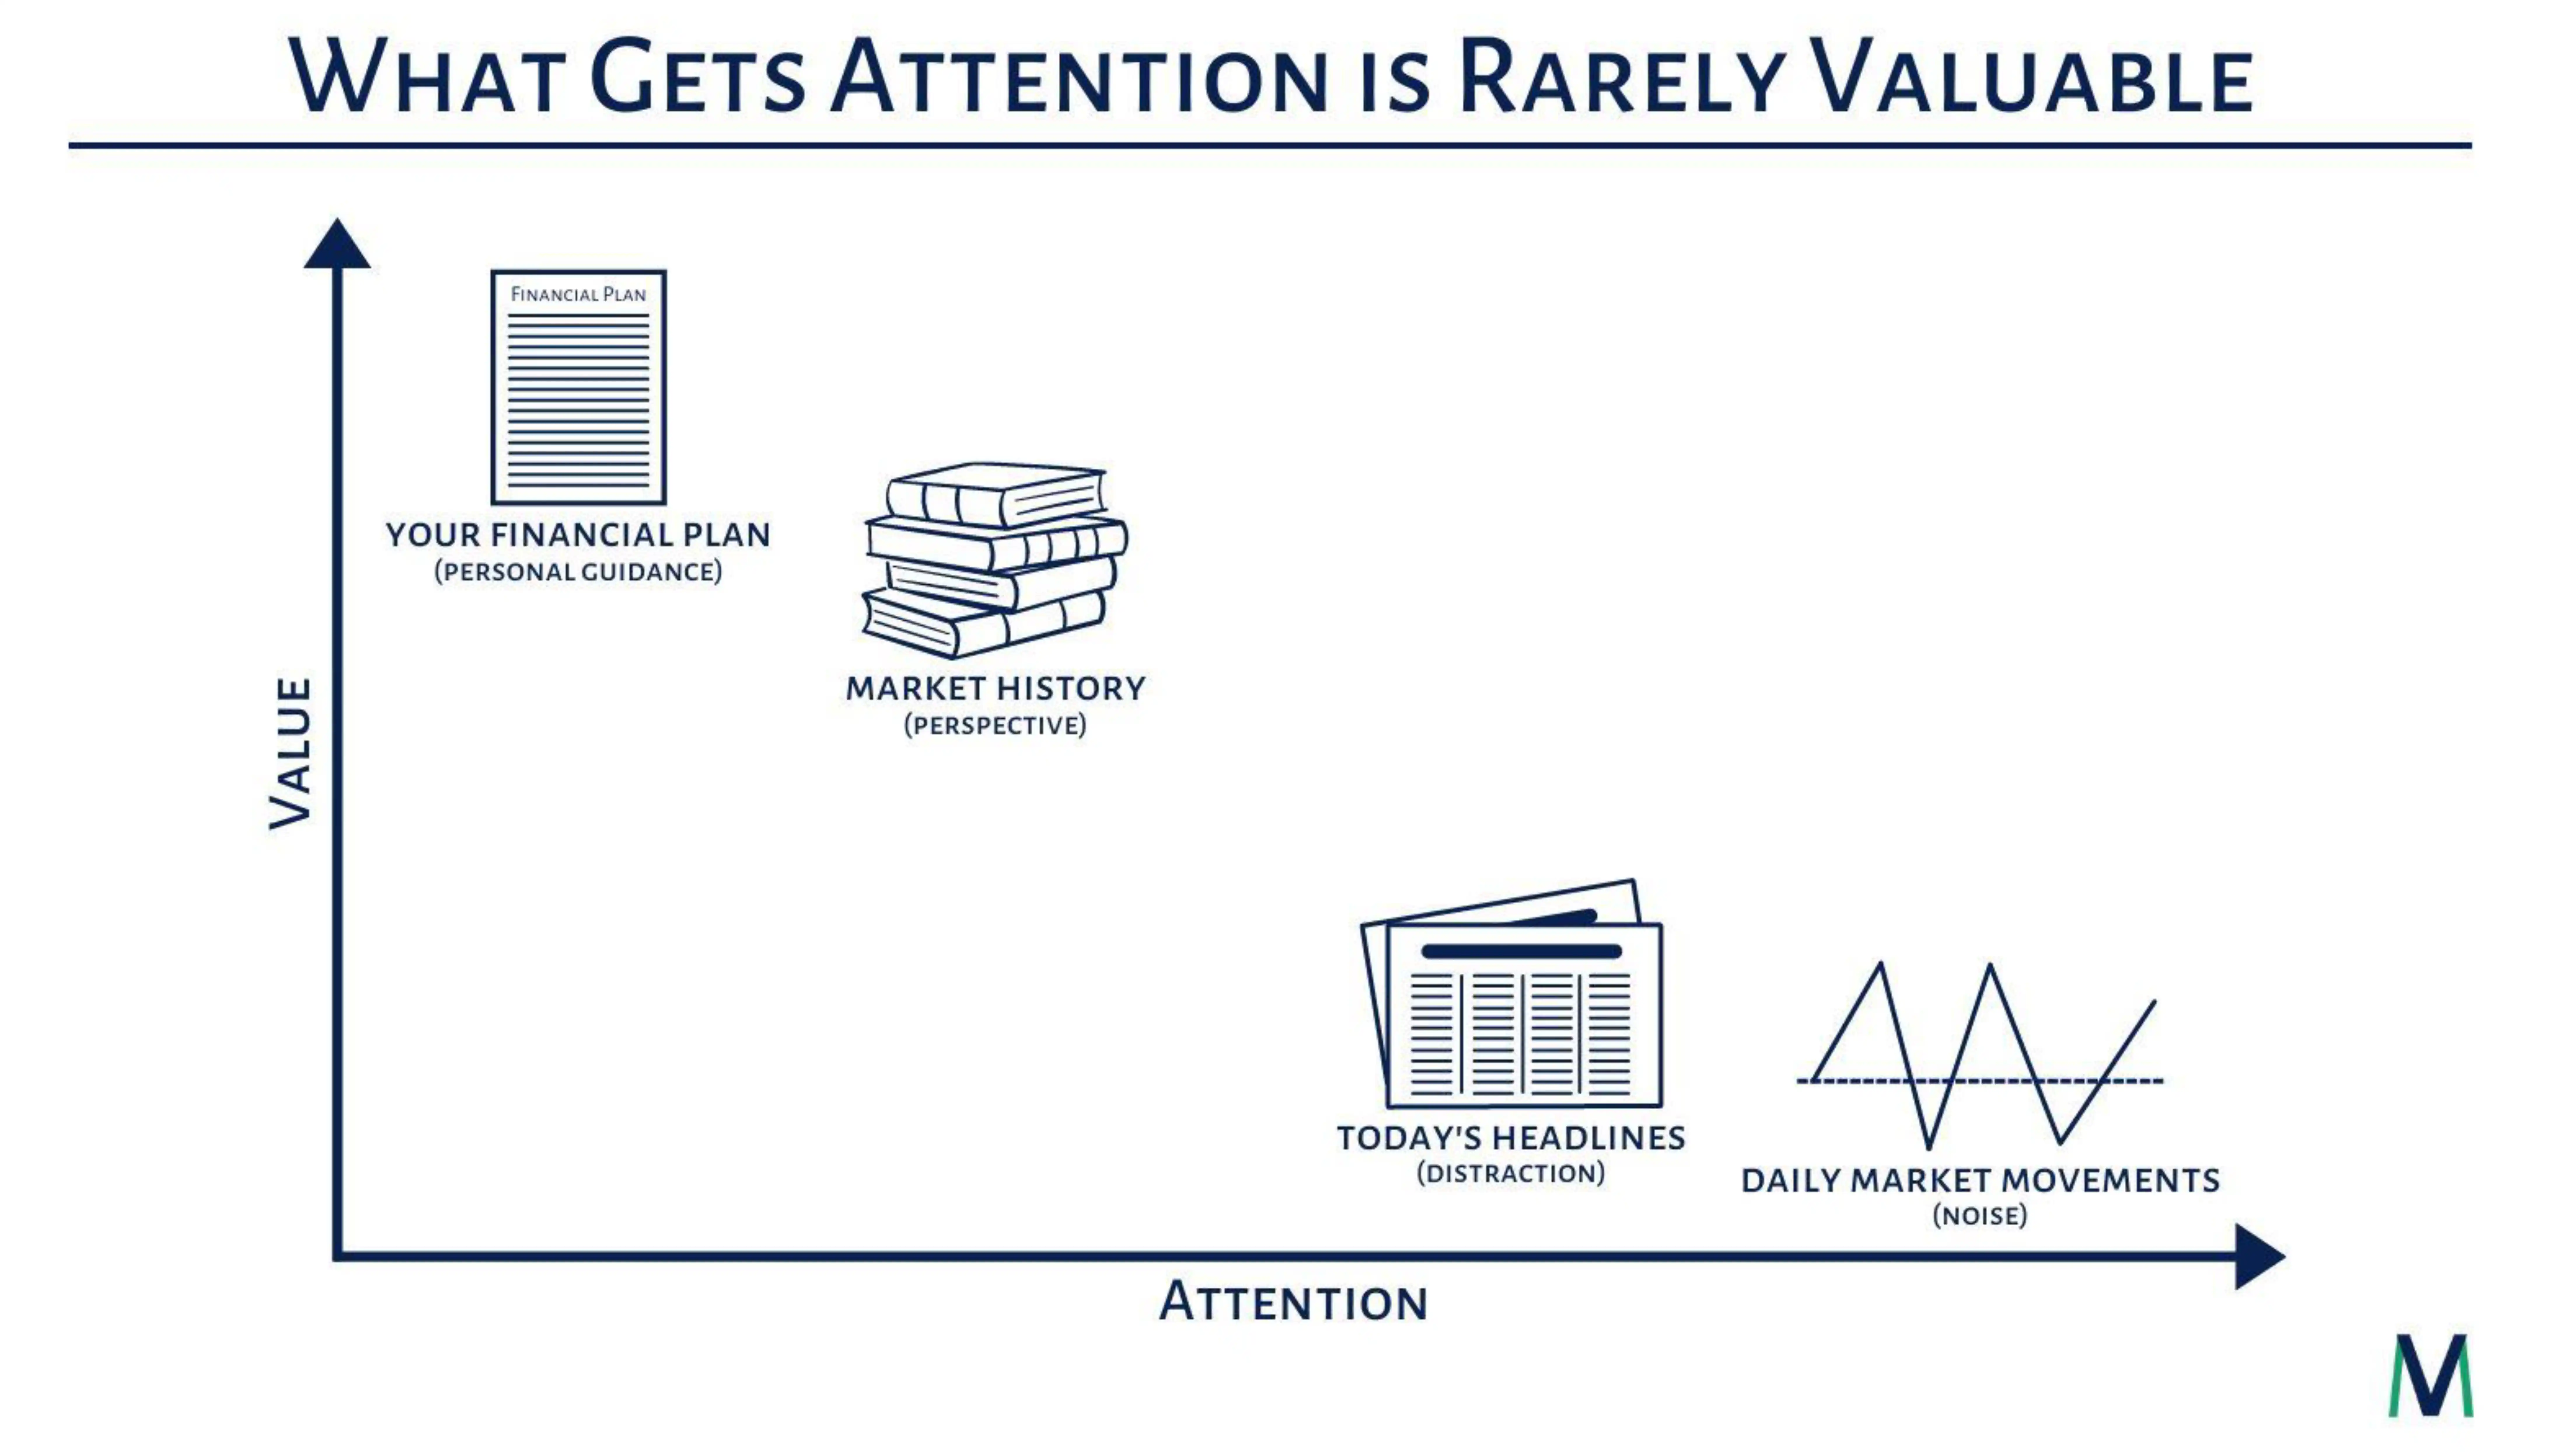
Perspective > Predictions
Source: Money Visuals, LLC
 Account Statement
  Capital Gain Statement
  Key Information Memorandum
  PAN Updation
  Register / Modify KYC Online
  Nominee Registration
  Email / Phone Updation
  OTM / eNACH Registration
  Guidelines for Incapacitated Investors
  FAQs
FAQs Reach us


