DSP Converse May 2024
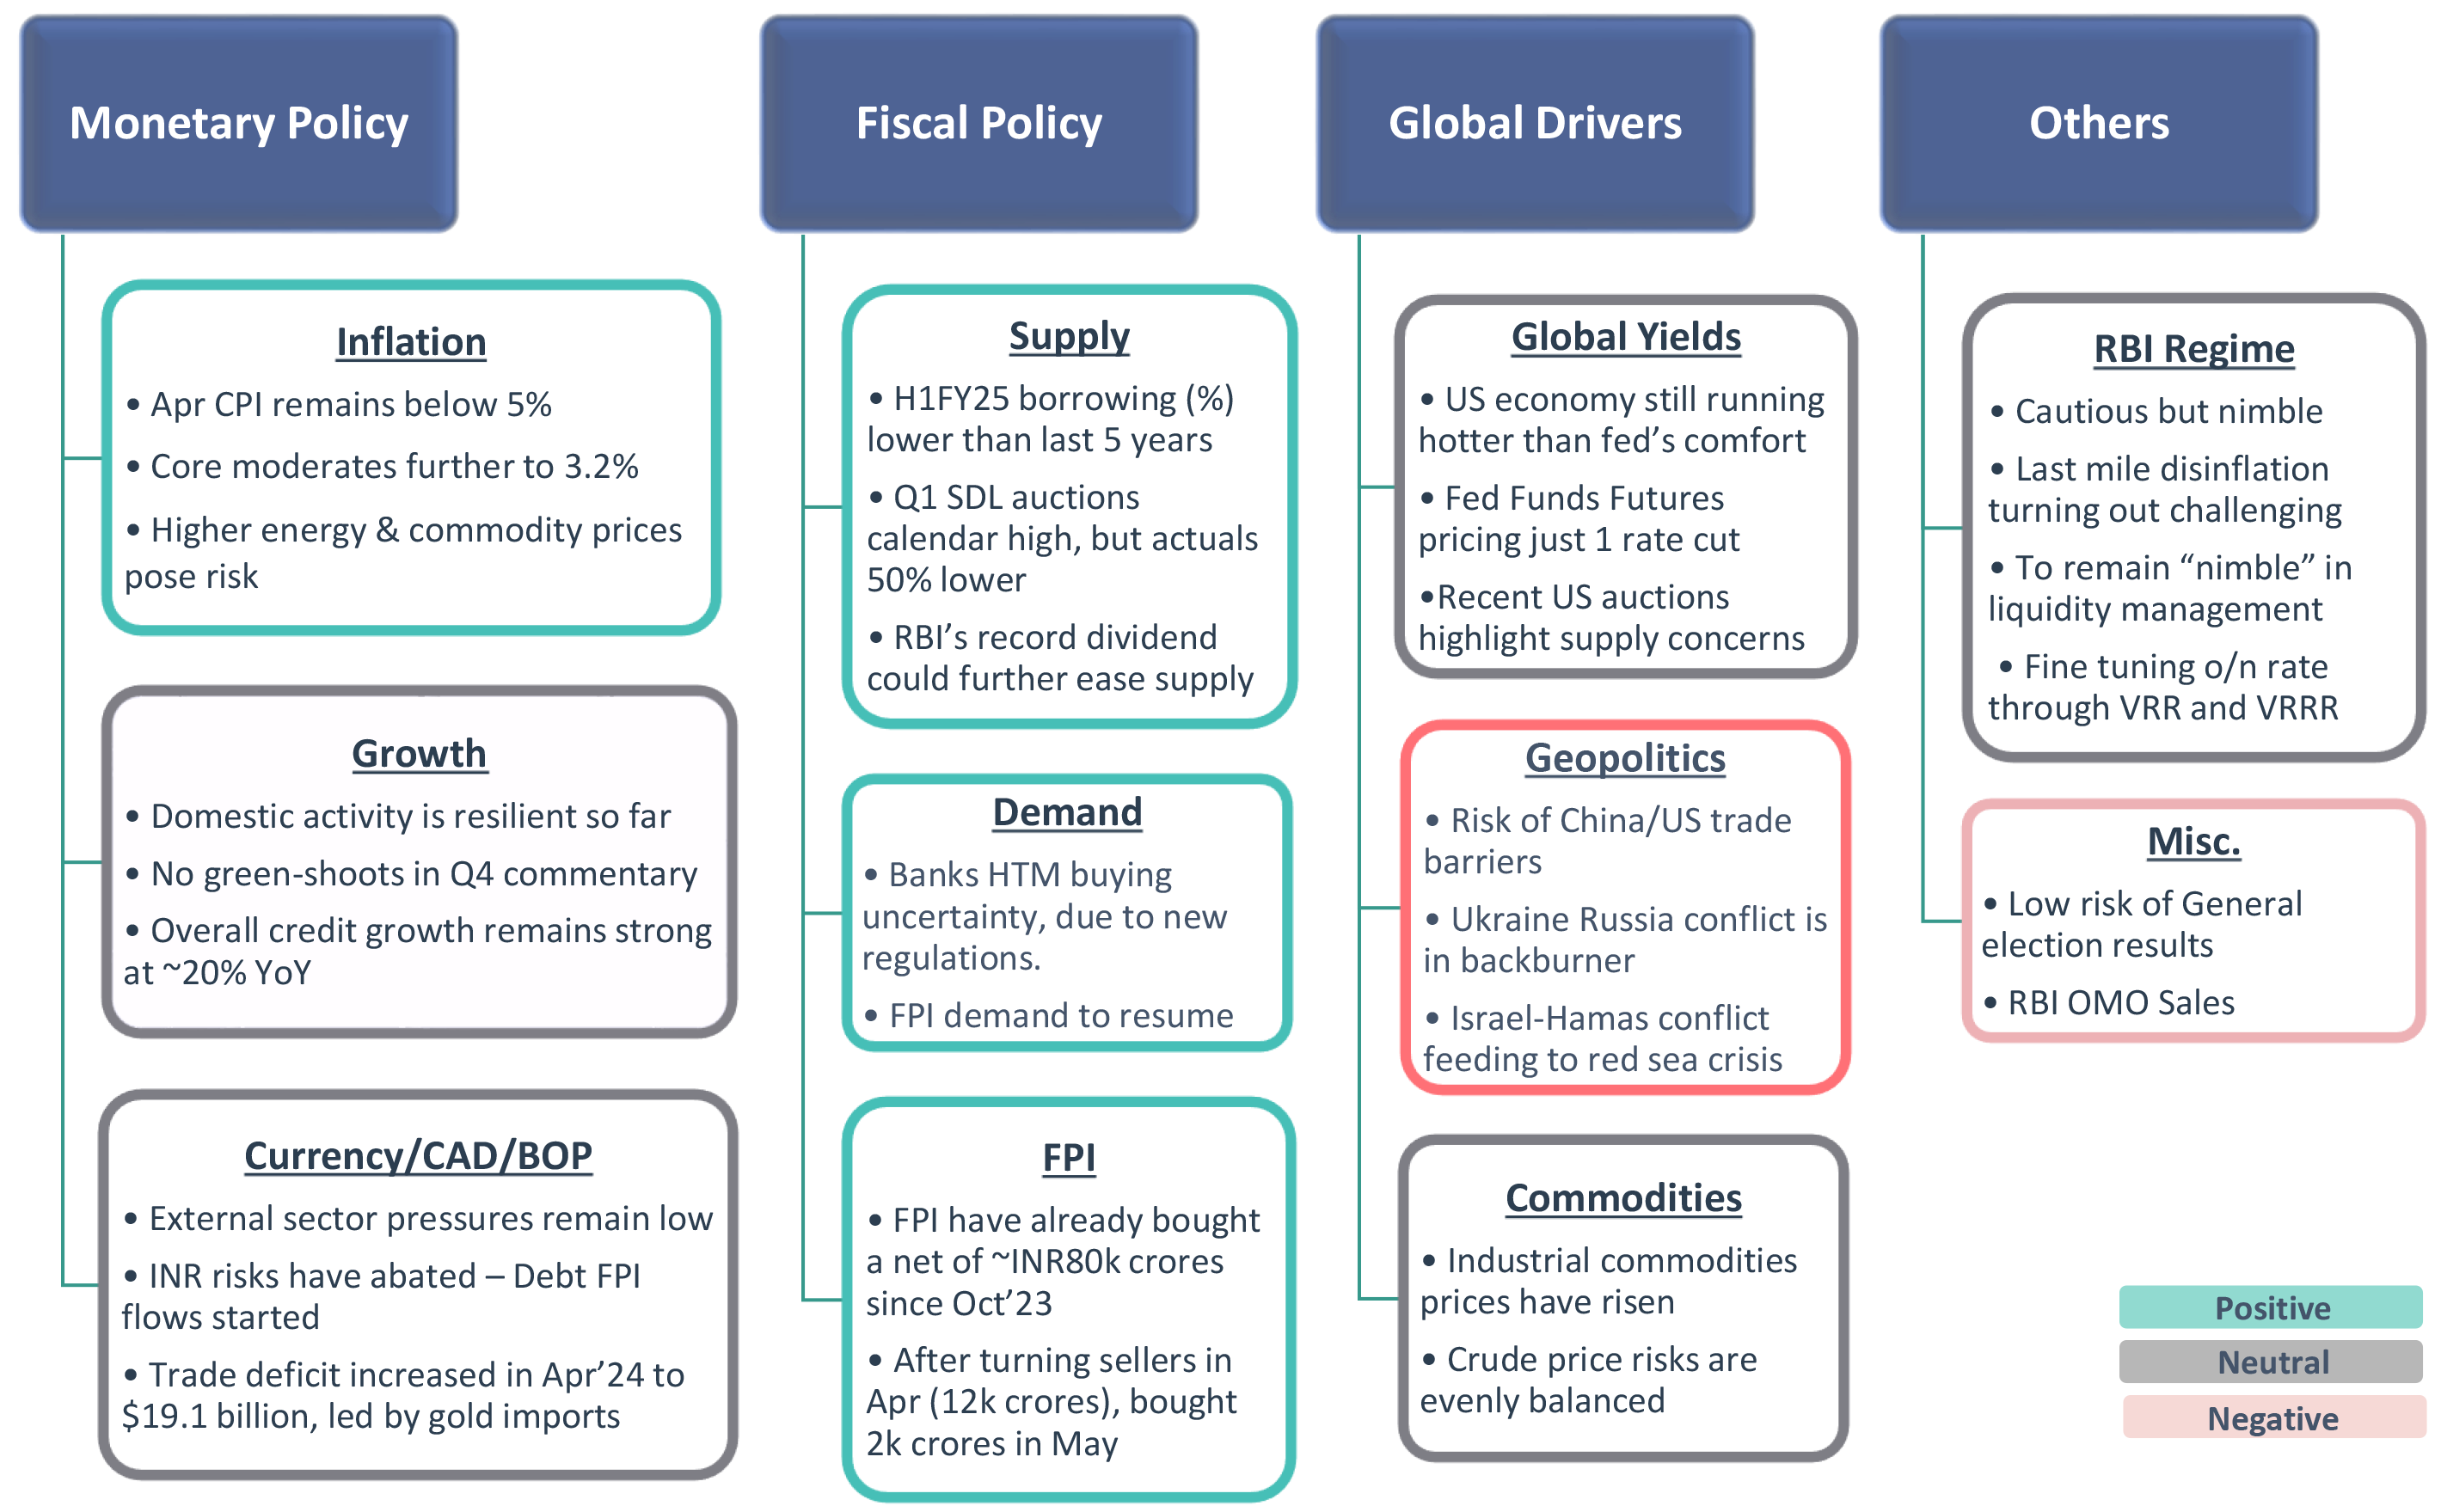
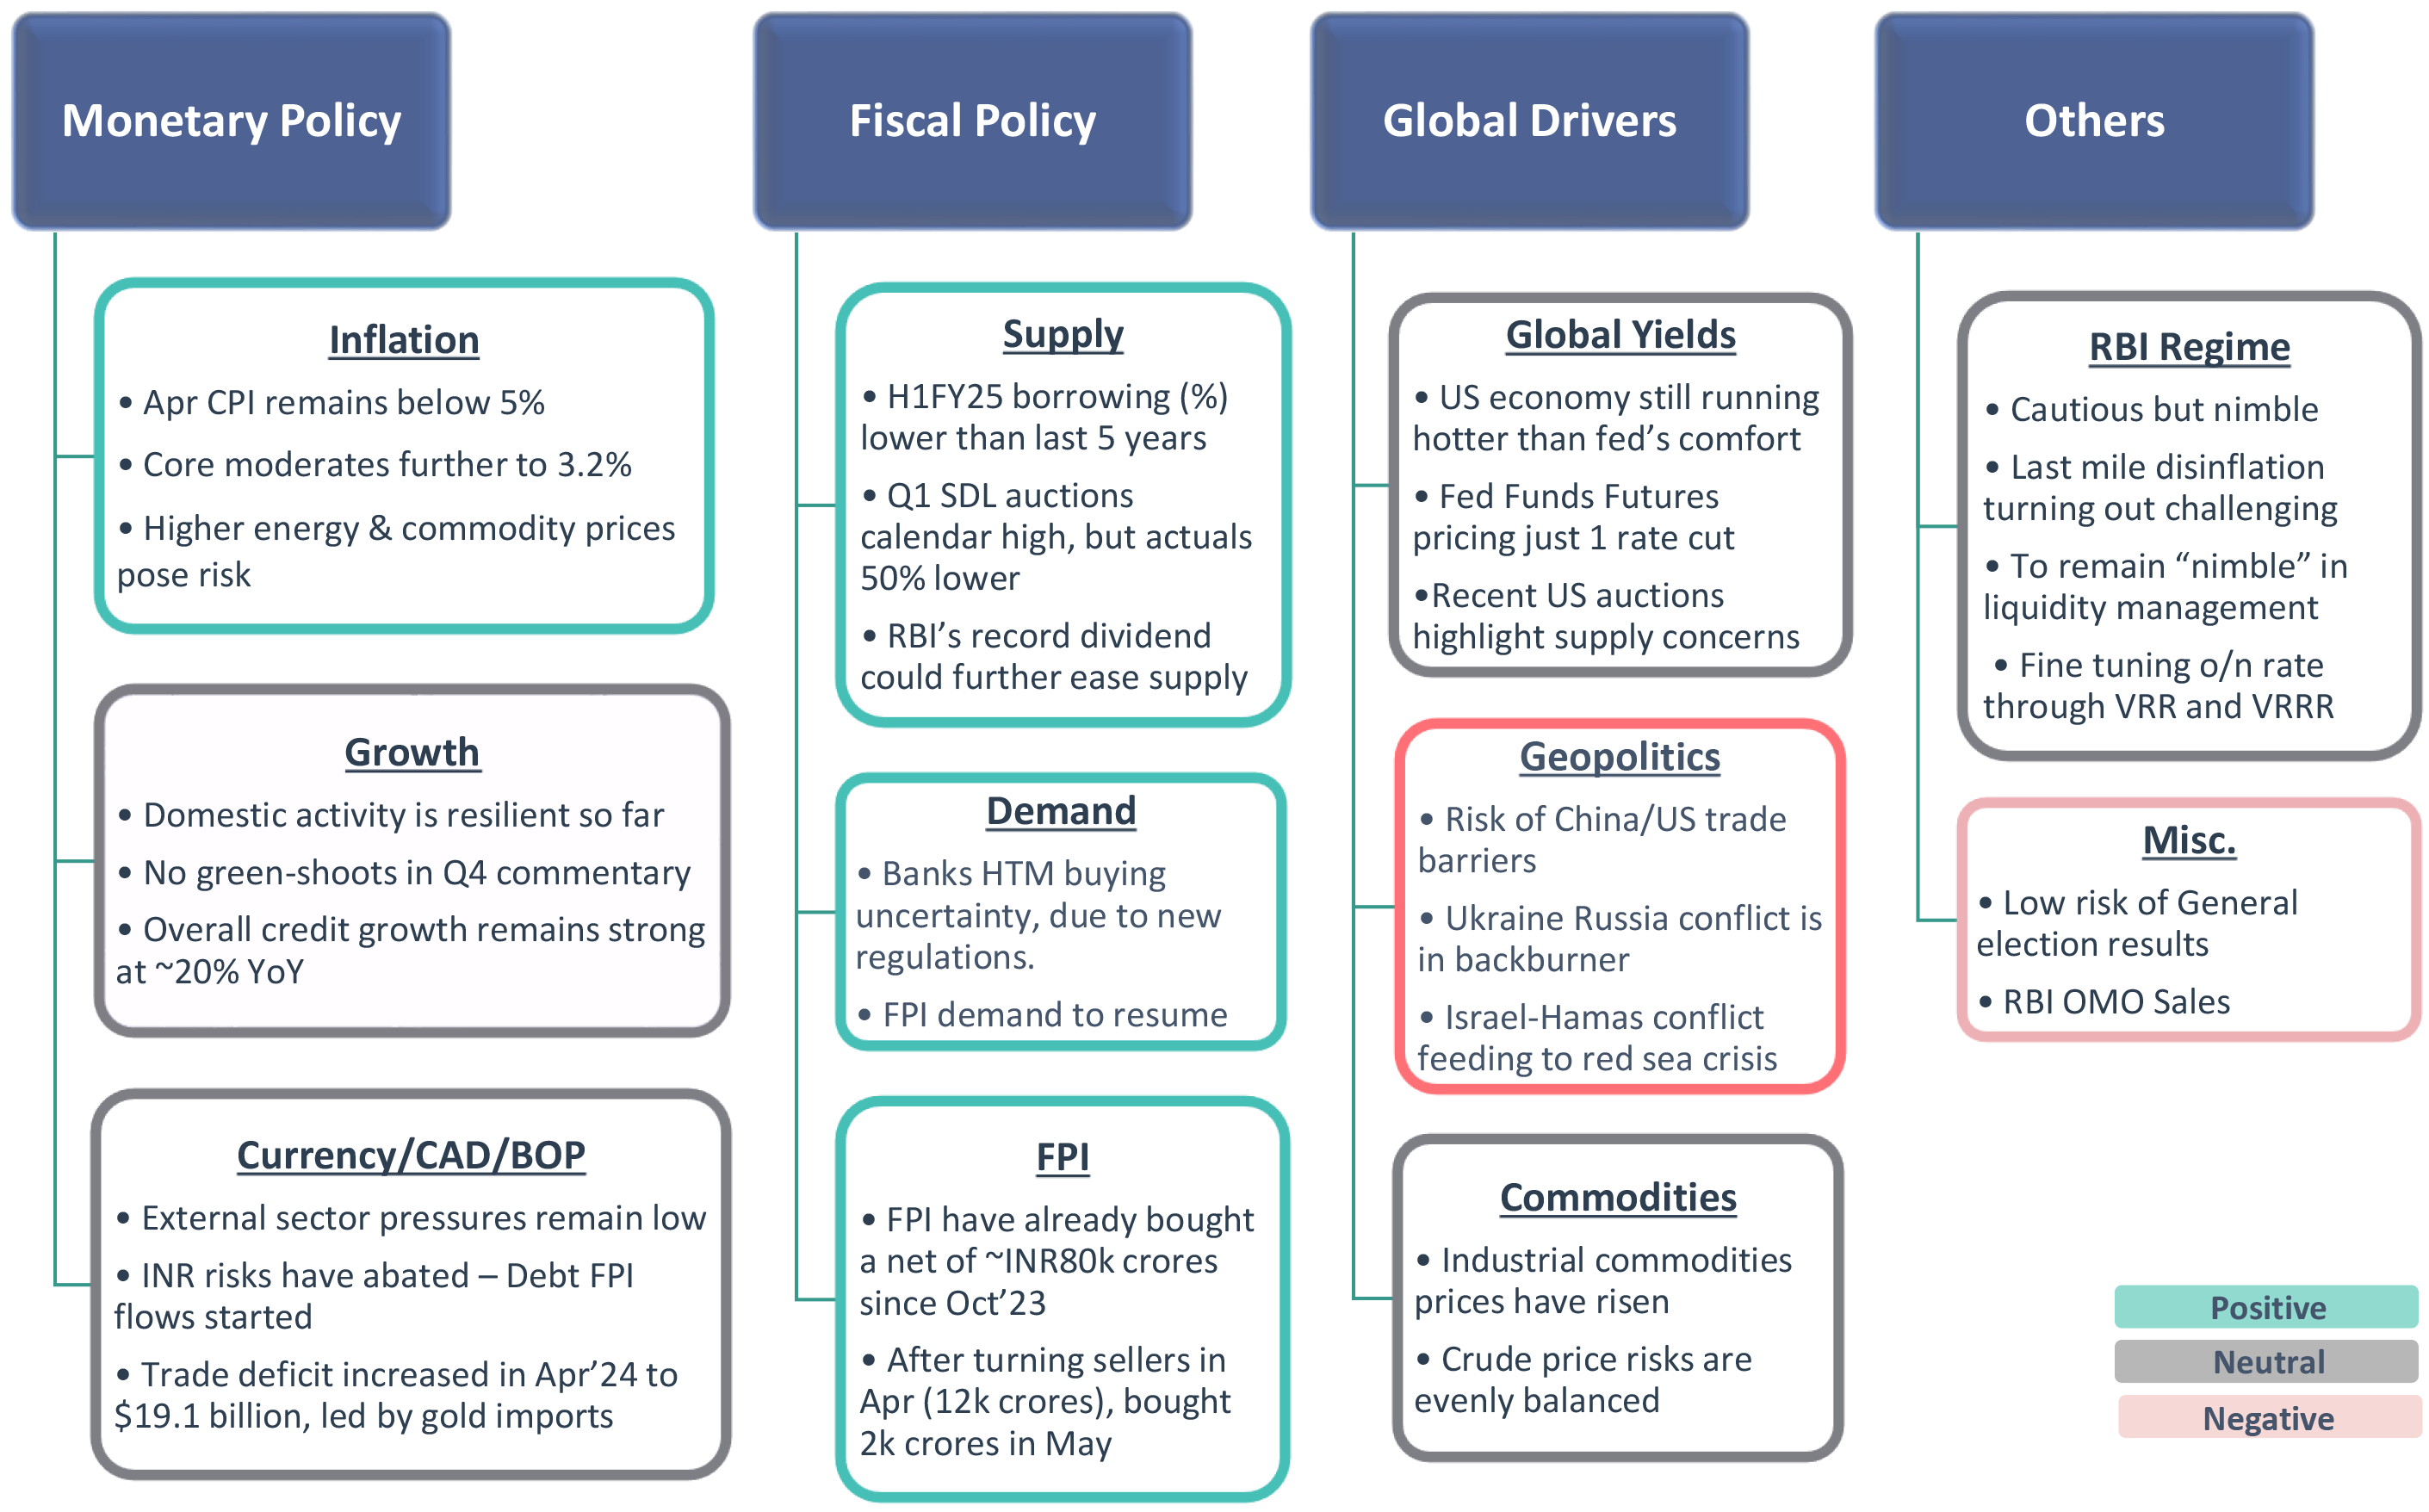
Our Framework
Takeaway:
Domestic environment steady, US pricing of rate cut expectations to drive bond yields
CAD – Current Account Deficit; BoP – Balance of Payment; SLR – Statutory Liquidity Ratio; SDL – State Development Loans; RBI: Reserve Bank of India; G-Sec: Government Securities; FPI: Foreign Portfolio Investment; NSSF: National Small Savings Fund; VRR: Variable Repo Rate; VRRR: Variable Reverse Repo Rate; o/n: Overnight
Be Long! Why?
Domestic macros supportive of lower yields
Yet, cut duration risk a bit! Why?
US data is volatile.
Let’s revisit our rates call trajectory
Source – Bloomberg, Internal
To start with,
Recap of events since last DSP CONVERSE release.
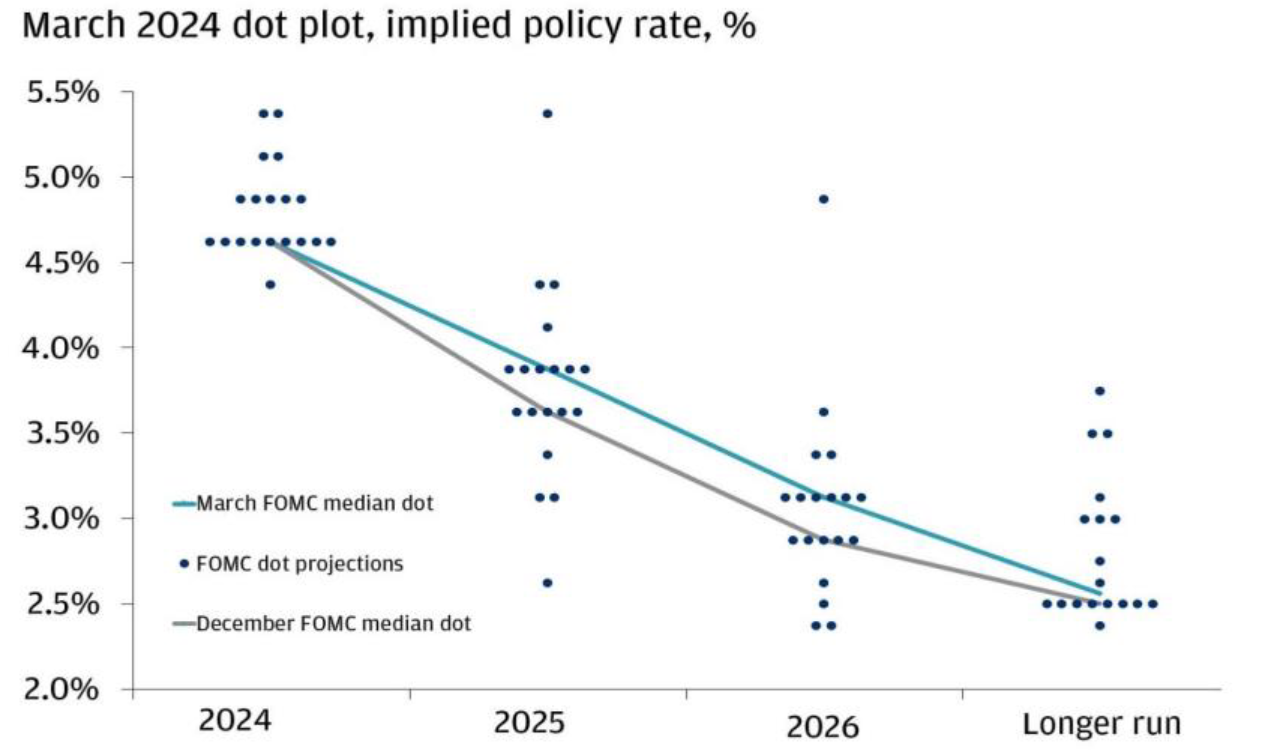
US Fed needs “greater confidence” to cut
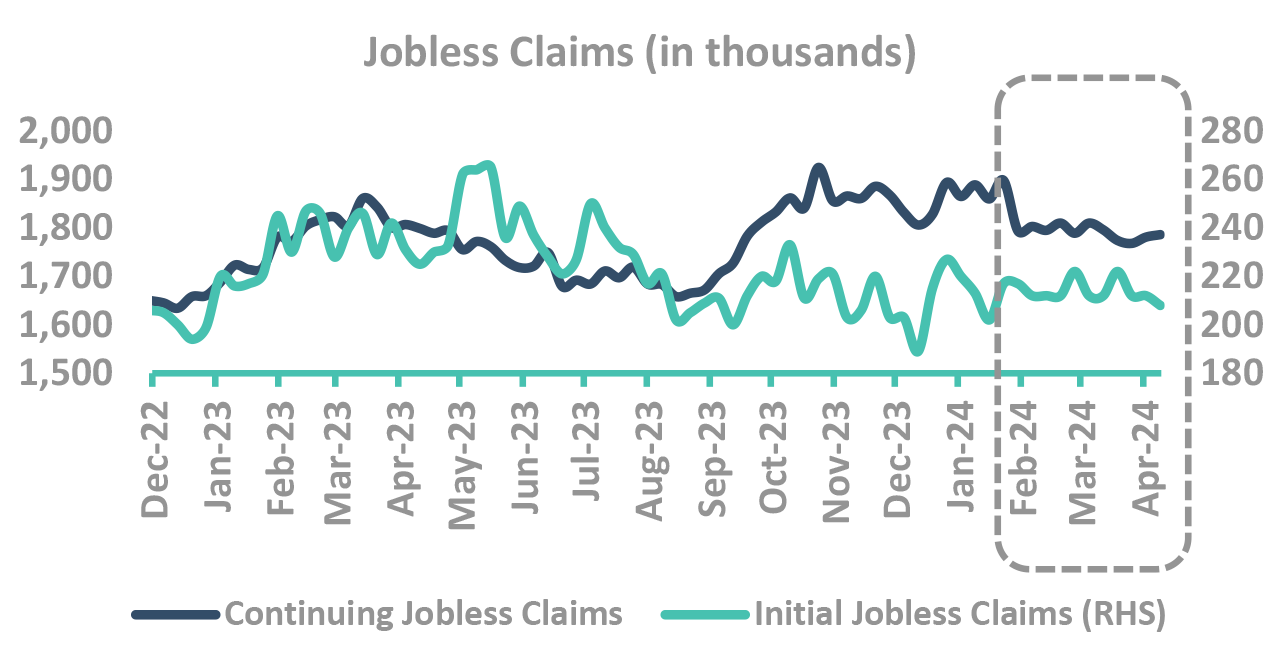
US Data is volatile
RBI’s record 2.1 lac crores dividend could ease supply further
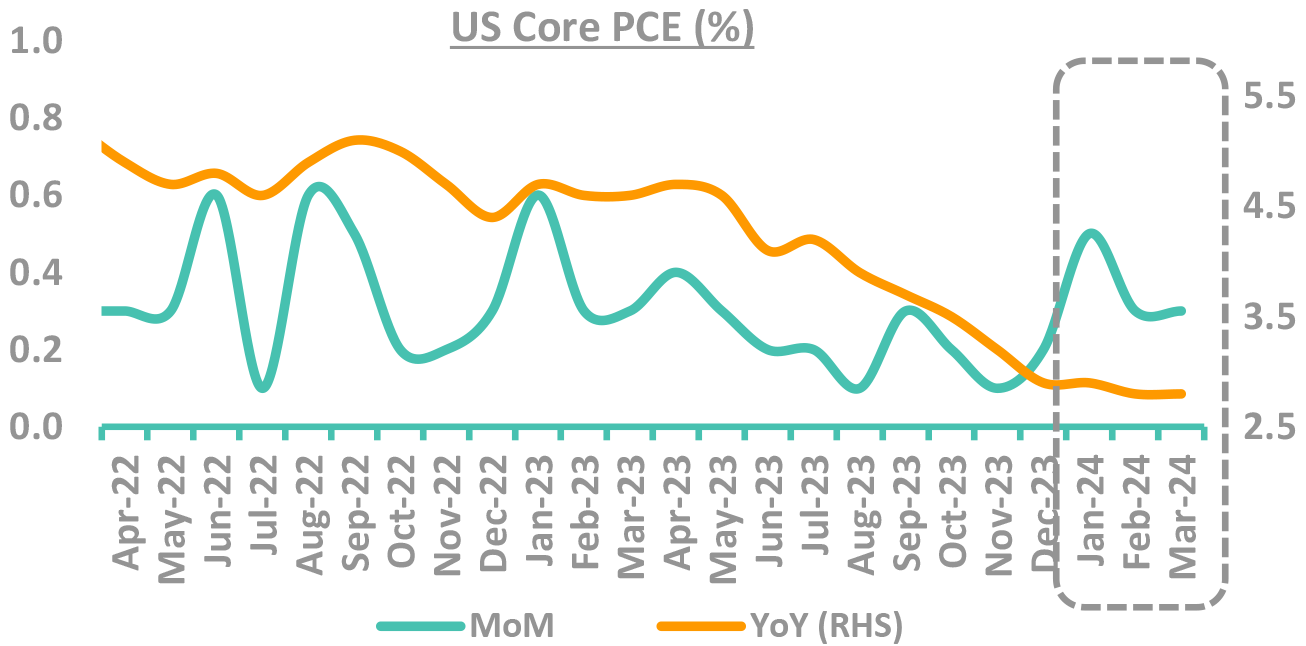
US data still running hot and Fed not to rush into cutting rates
Takeaway:
Fed not to rush into cutting rates
Source – Bloomberg, Federal Reserve PCE: Personal Consumption Expenditure; FOMC: Federal Open Market Committee
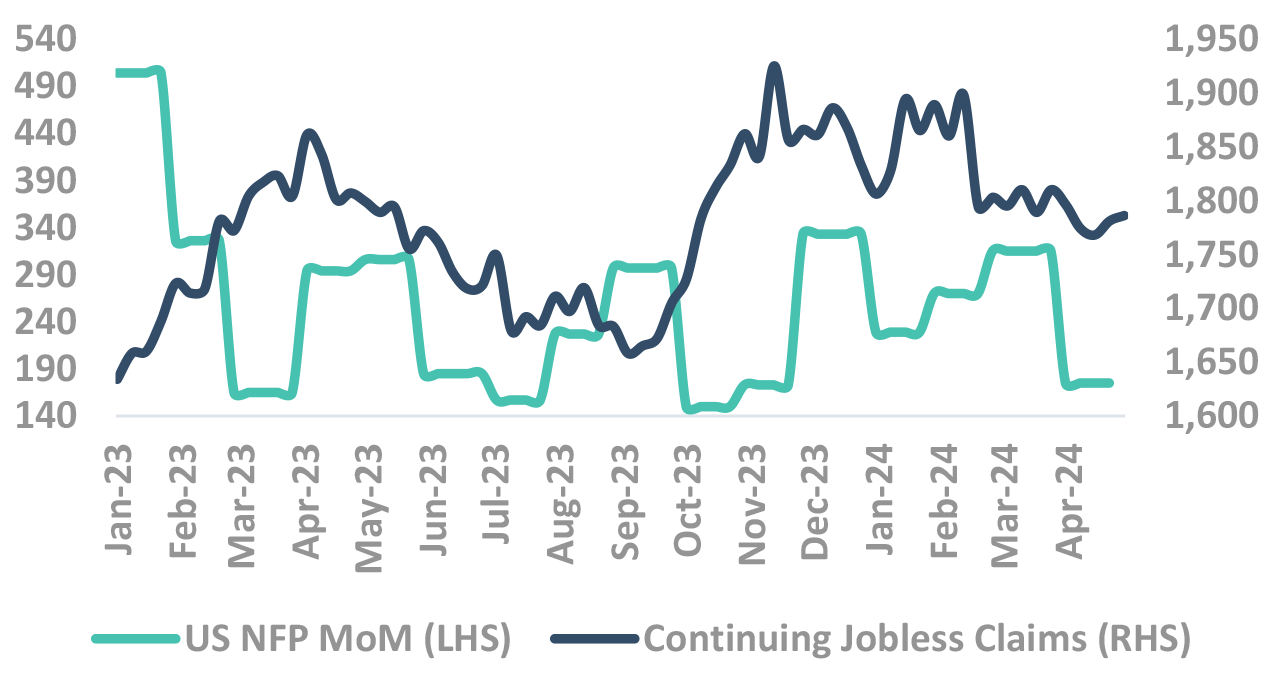
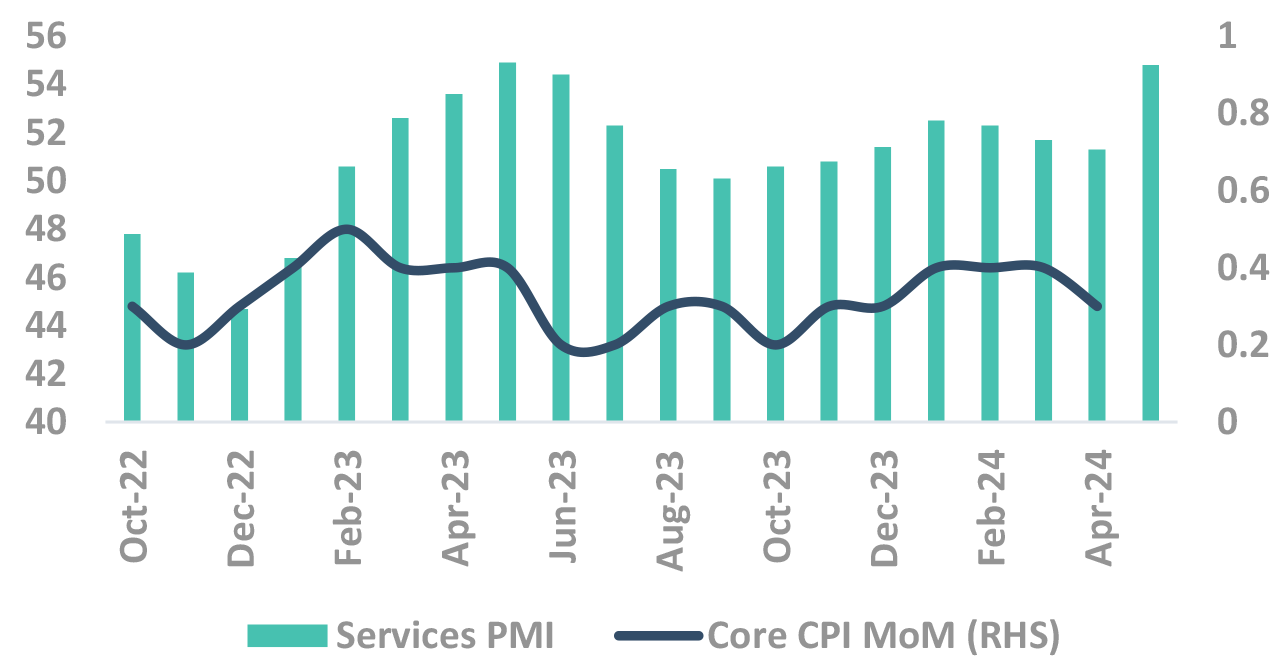
US Data not softening enough to give confidence to cut rates
Takeaway:
Services sector being the major contributor to employment and inflation, any significant softening to provide a tailwind
Source – Bloomberg NFP: Non Farm Payroll, PMI: Purchasing Managers’ Index; CPI: Consumer Price Inflation
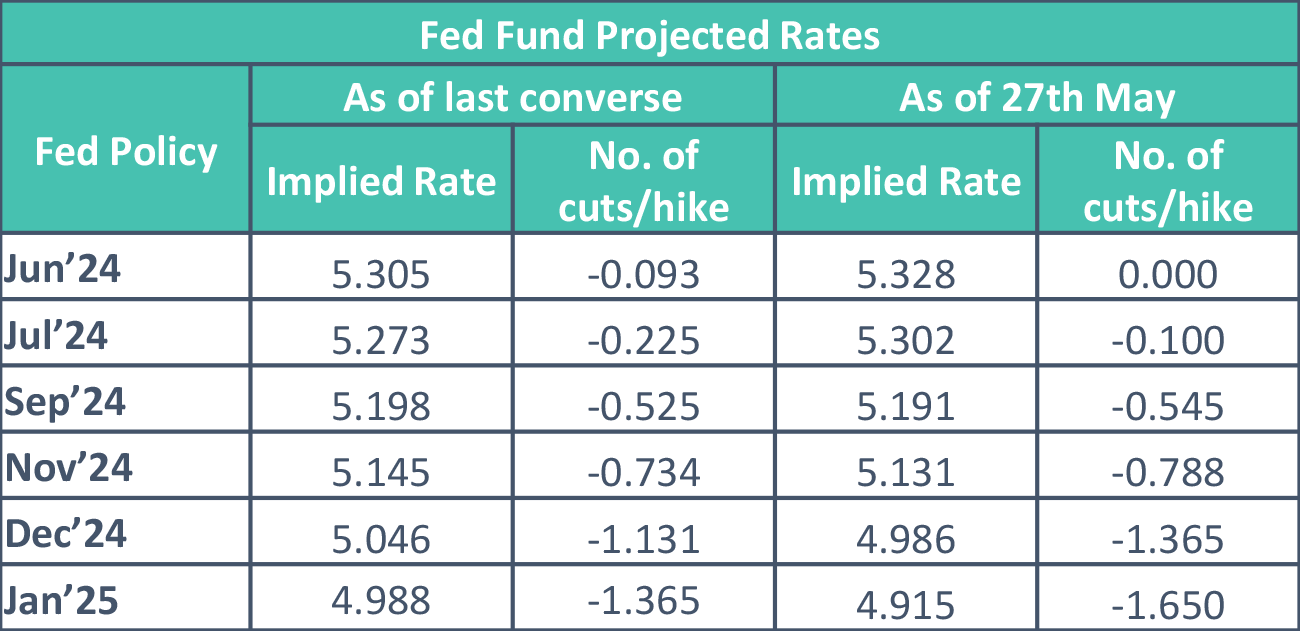
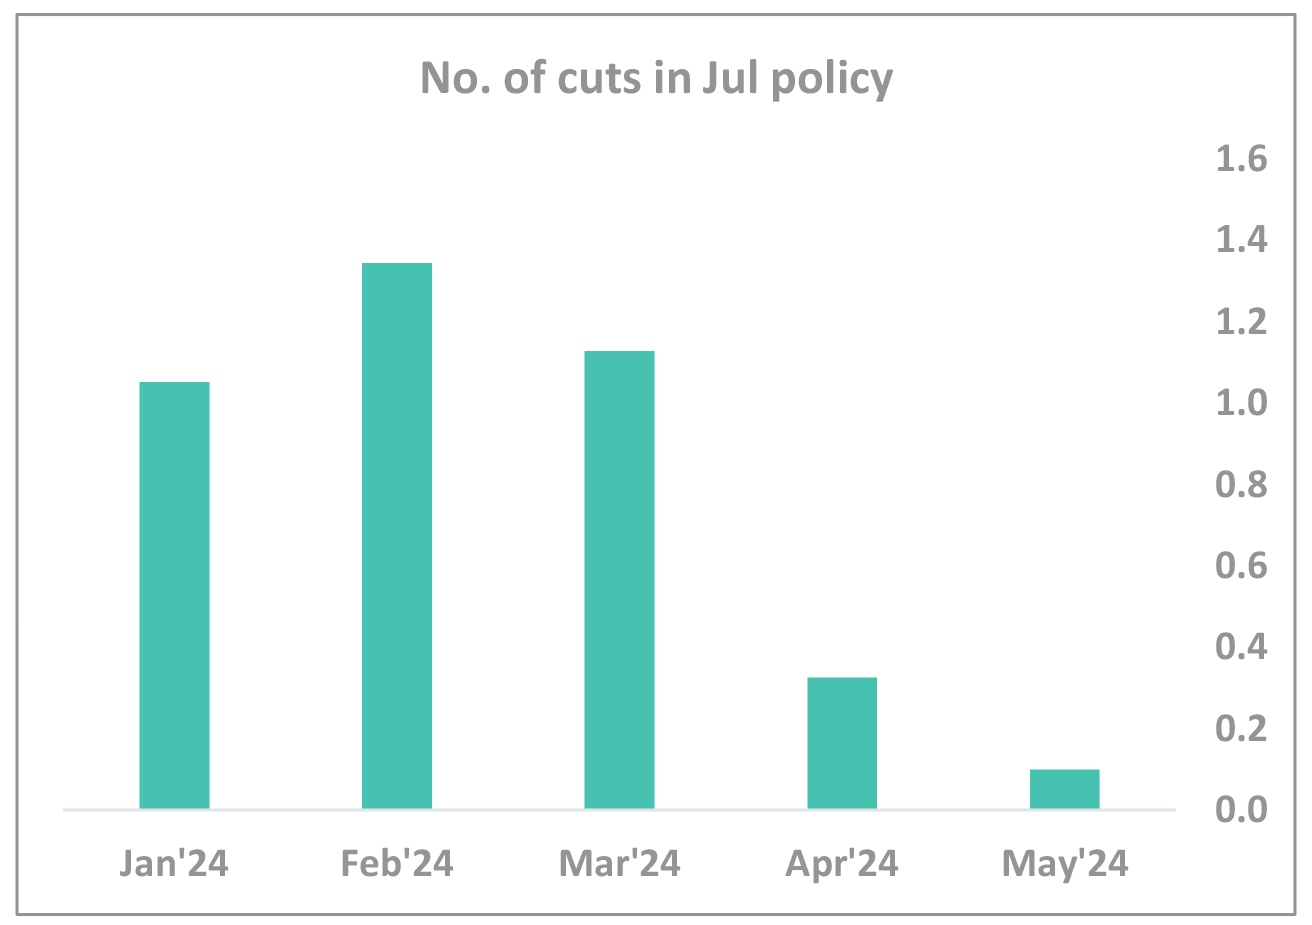
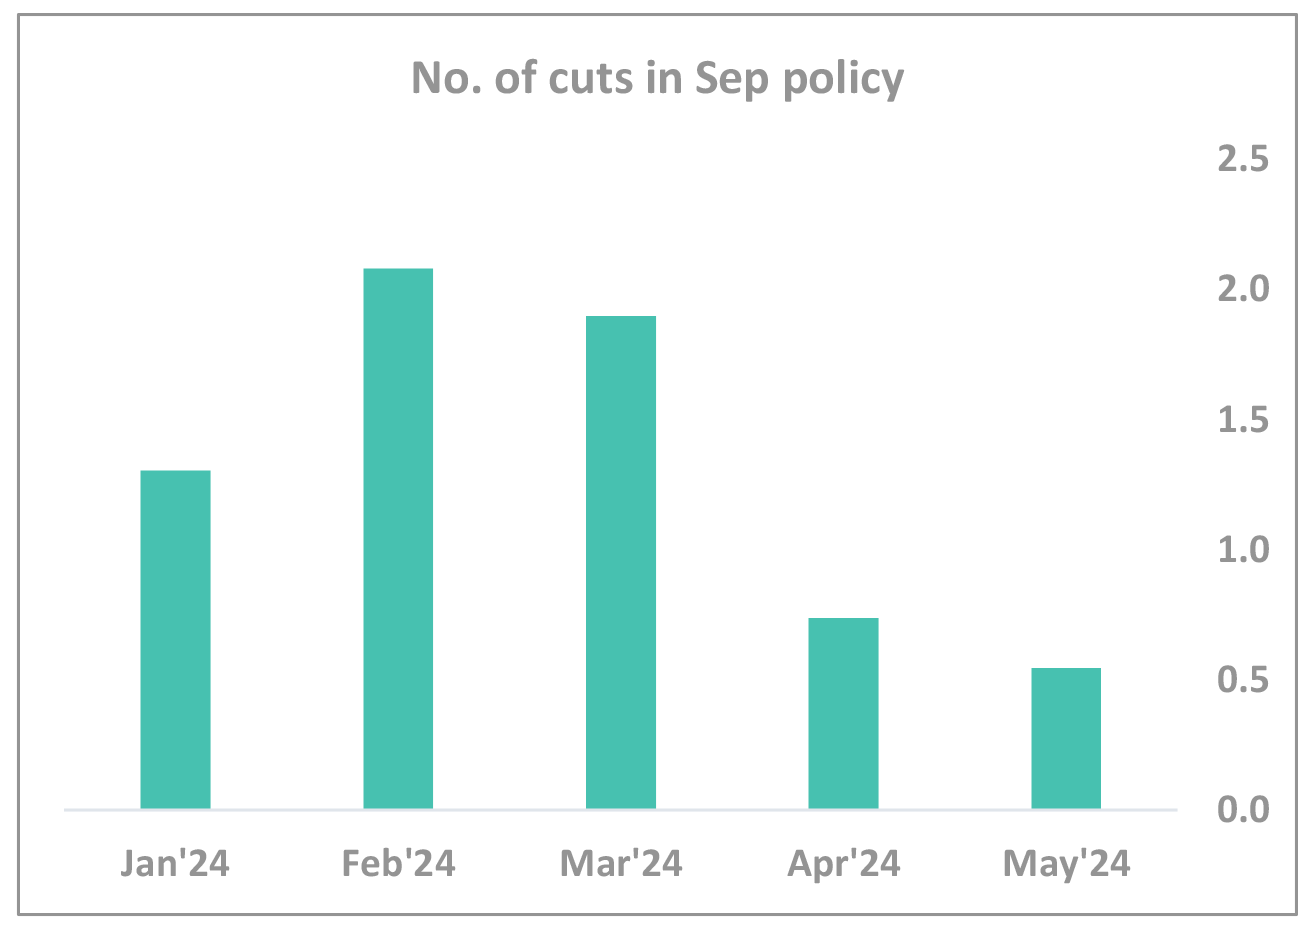
Rate cuts getting priced out
-
From pricing in 6 rate cuts in CY24 in Jan to just 1 rate cut now
Now our framework
And
What we track
Our Framework
Takeaway:
Domestic environment steady, US pricing of rate cut expectations to drive bond yields
CAD – Current Account Deficit; BoP – Balance of Payment; SLR – Statutory Liquidity Ratio; SDL – State Development Loans; RBI: Reserve Bank of India; G-Sec: Government Securities; FPI: Foreign Portfolio Investment; NSSF: National Small Savings Fund; VRR: Variable Repo Rate; VRRR: Variable Reverse Repo Rate; o/n: Overnight
Resilient domestic economic activity
Expansion in urban demand while rural still not completely out of woods
Inflationary risks seem contained
RBI to be nimble in liquidity management
Core CPI moderates further. Risks seem contained
-
Mar CPI moderates to 4.83% (4.85% in Mar)
- Below 5% mark for the 2nd consecutive month
- Led by further deflation in fuel & lighting segment
- Energy & higher commodity prices pose upside risk
Core continues to provide comfort
- Moderates further to 3.22% (3.3% in Mar)
- Although increased MoM by 0.5% (0.2% in Mar)
- ✓ Led by personal care category (gold prices)
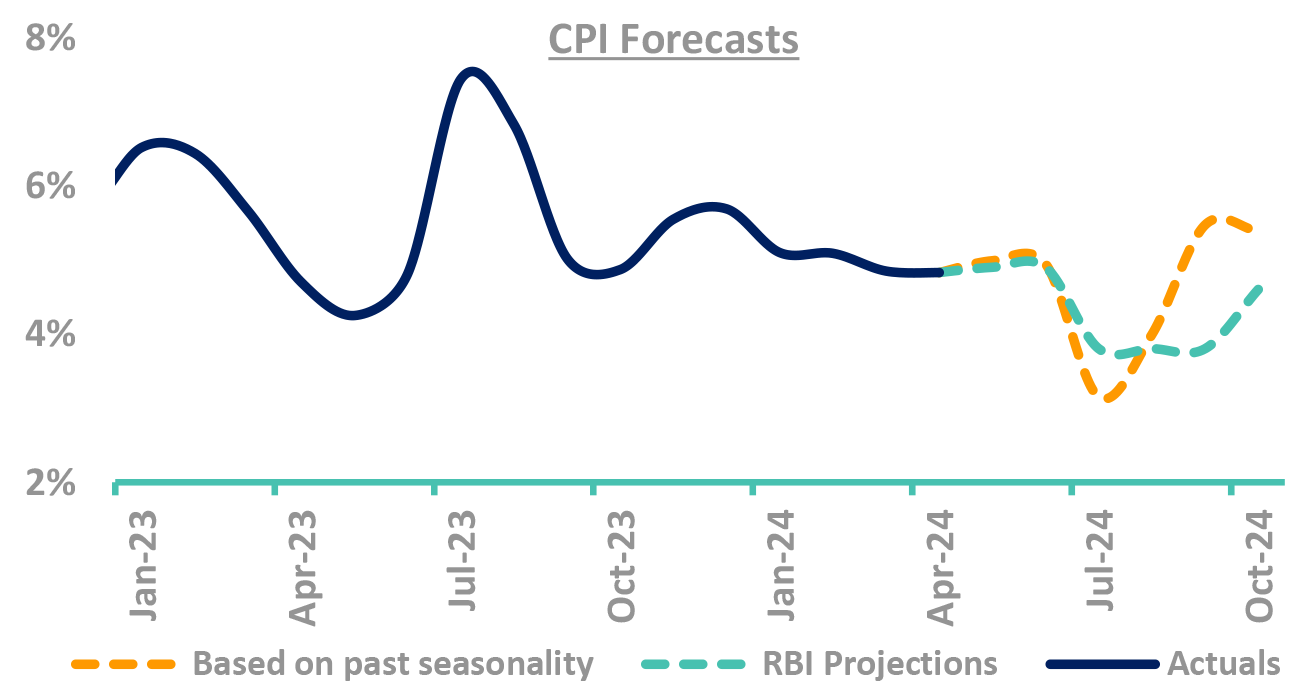
-
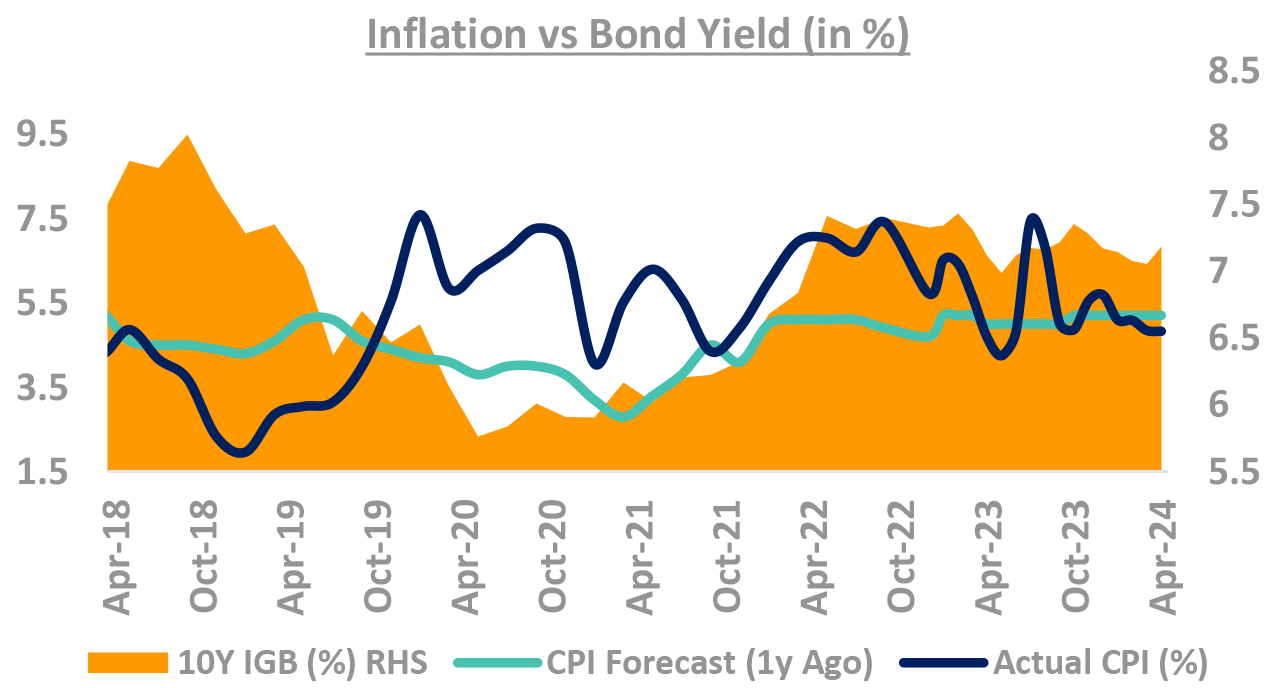
Do yields track inflation projection? No.
- Orange area (chart) is 10Y yields, Blue line is CPI
Can forecasters predict Indian CPI? No.
- Green line is forecasters CPI 1-Yr ahead prediction
- Blue line is where inflation actually came
- Guess the error of margin!
CPI forecast corelated (not causality) to yields
- Low predictive power, high current corelation
Takeaway:
Domestic inflation risks seem contained. Volatility in CPI has not impacted yields (especially in 2023)
Source – Bloomberg, RBI, Internal CPI: Consumer Price Inflation; RBI: Reserve Bank of India; IGB: India Government Bond
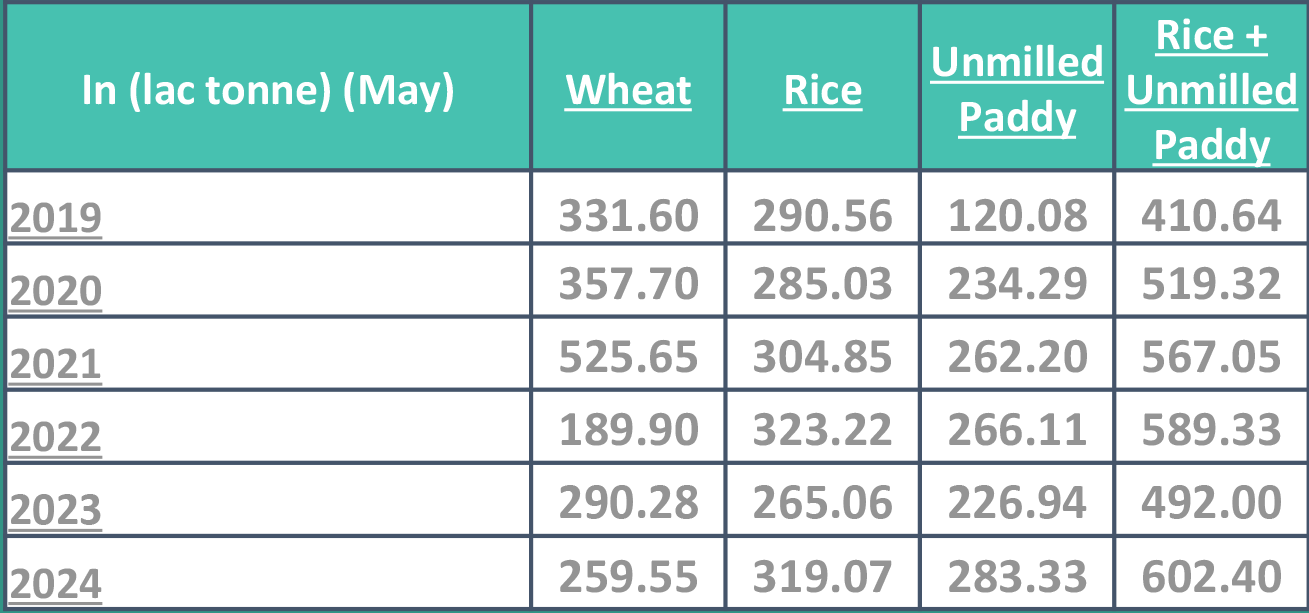
La Nina on the horizon? Good monsoon critical for low reservoir levels
-
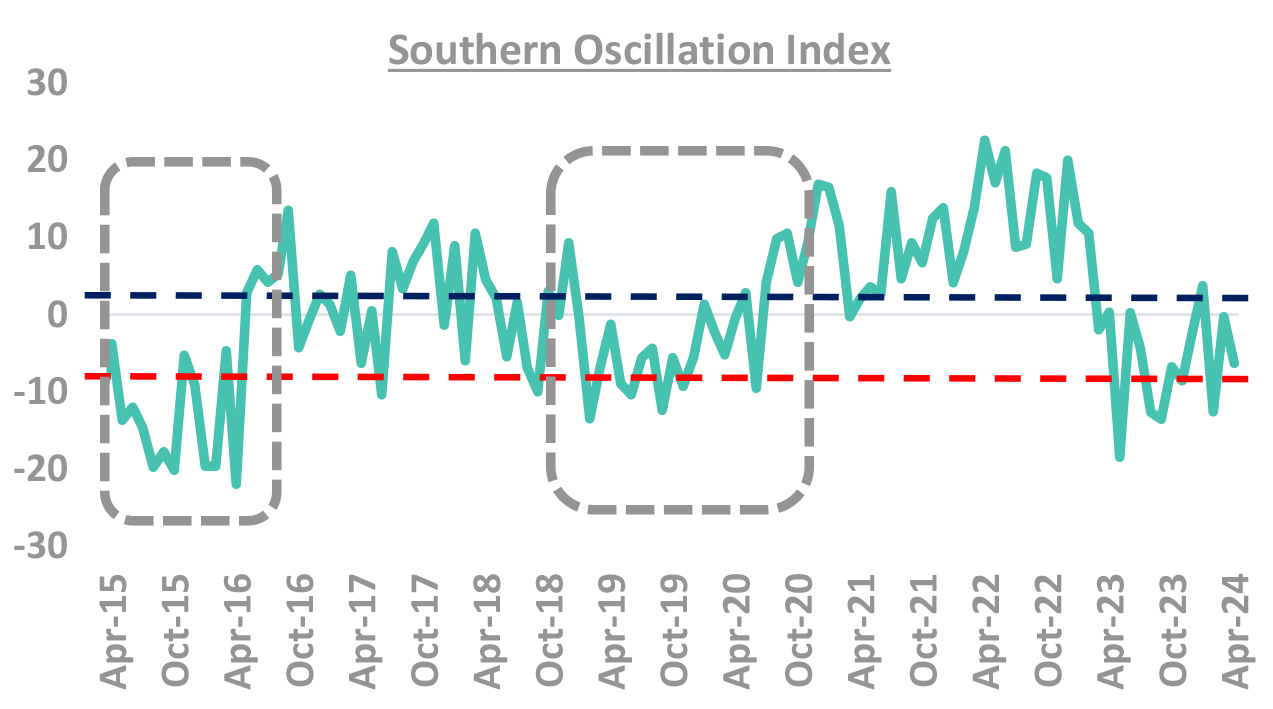
La Nina likely to start in the Pacific Ocean
- As per the US-based National Oceanic and atmospheric Administration, La Nina may develop in June-August (49% chance) or July-September (69% chance)
- Southern Oscillation Index value within normal range
- Low reservoir levels (24th May)
- ✓ Reservoir live storage at 43.29 BCM (at 79% of the live storage of corresponding period last year and 95% of storage of average of last ten years)
Takeaway:
La Nina conditions bode well for monsoon and thus food inflation
Source – FCI, Australian Govt BoM, NFSM
Domestic growth resilient so far: But watch out for trends
-
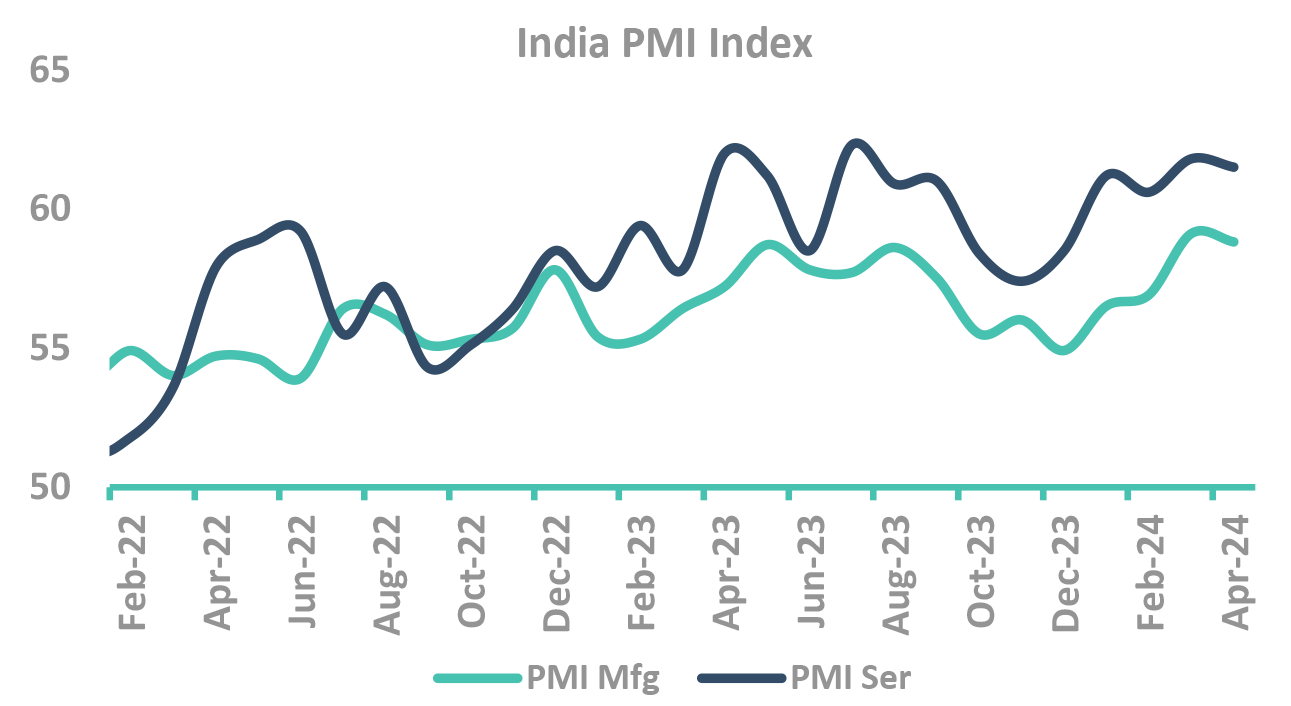
Watch out for domestic growth
- PMI continue to be in expansionary mode
- Record high GST collection for Apr (2.1 lac crores), up 12.4% YoY
- Lack of any green-shoots in Q4 commentary
Overall credit growth remainsstrong at ~20%
- Unsecured PL and loan to NBFCs have moderated
- Housing loan and services growth remain strong
- Credit to industry has improved further
-
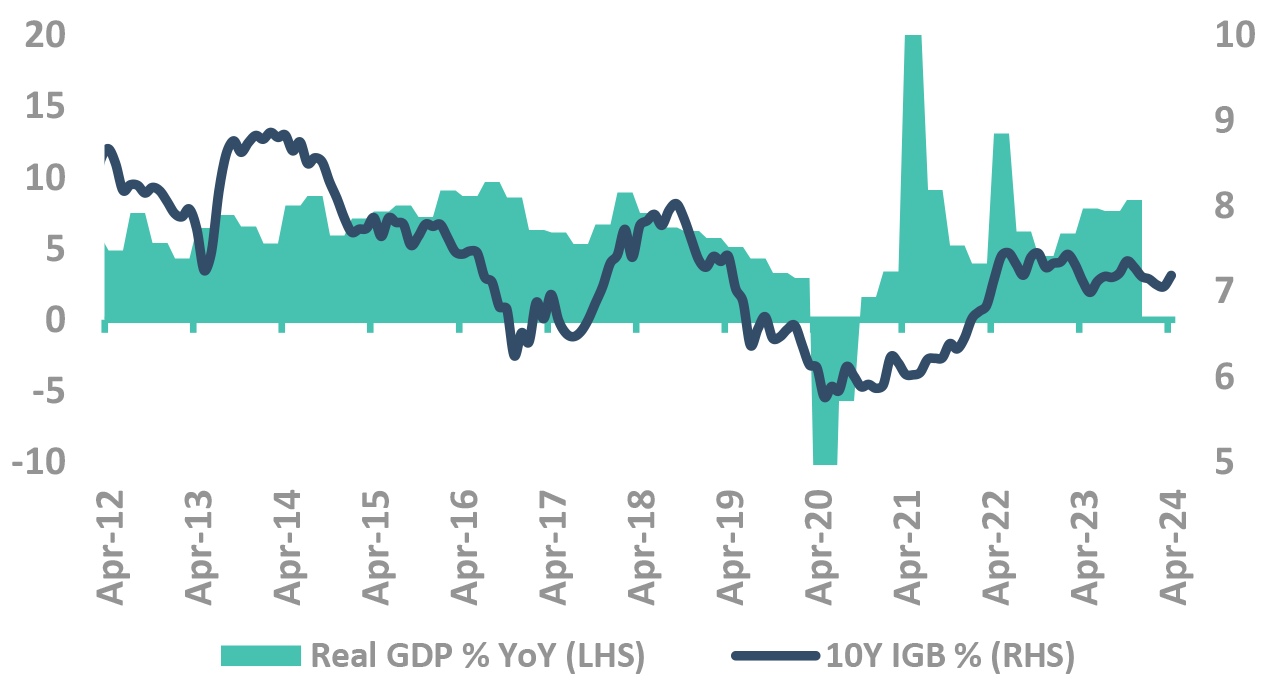
How closely do yields track growth?
- Yields have usually tracked GDP growth, with
correlation stronger when growth slows, barring
- ✓ 2013, rupee depreciation and debt outflows
- ✓ 2017, during demonetization
- Yields have usually tracked GDP growth, with
correlation stronger when growth slows, barring
FY24, growth may not be big driver for yields
- FY23 GDP growth at 7.2% -in line with RBI projections.
- Q3FY24 GDP Growth came in at 8.4%.
Takeaway:
Domestic growth seems to be resilient so far but watch out for emerging trends
Source – Bloomberg, PIB, Internal GDP: Gross Domestic Product; PMI: Purchasing Managers’ Index; GST: Goods and Service Tax; IGB: India Government Bond
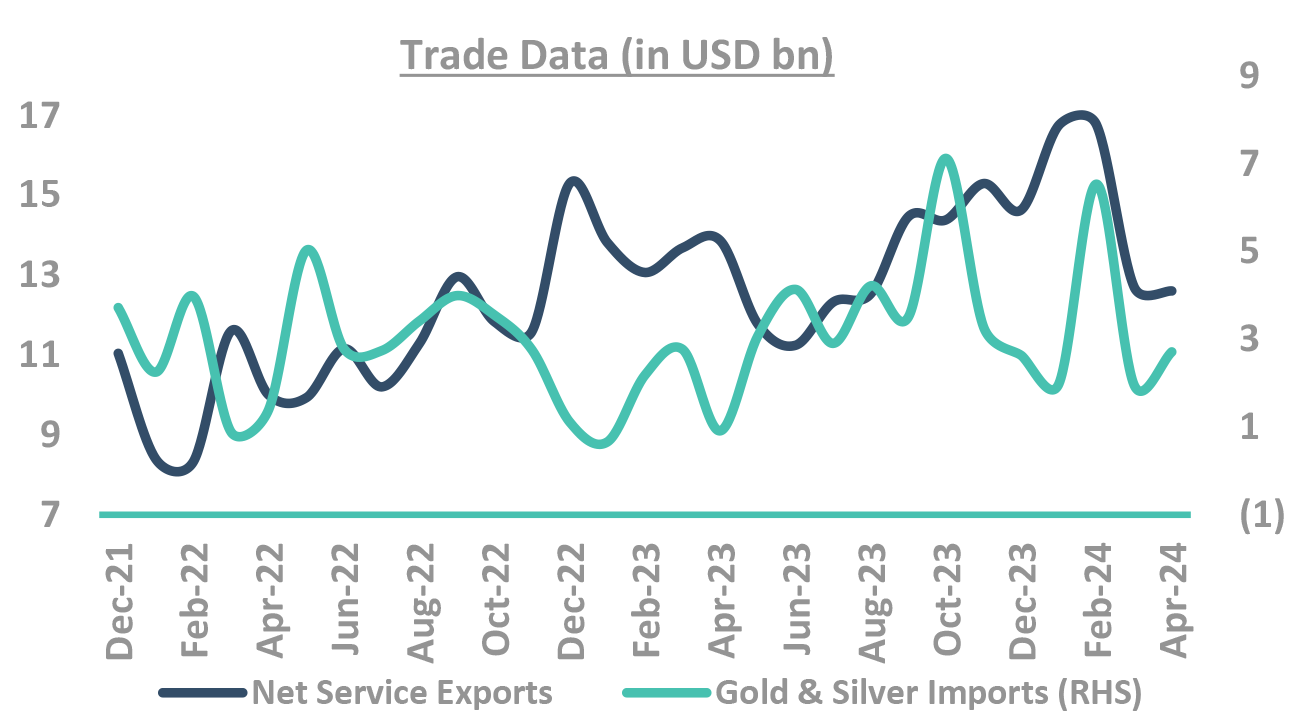
External sector metrics remain comfortable
Takeaway:
External Sector metrics remain comfortable
Source – Bloomberg, BoP: Balance of Payment; MTM: Mark to Market; EM: Emerging Markets; UST: US Treasury
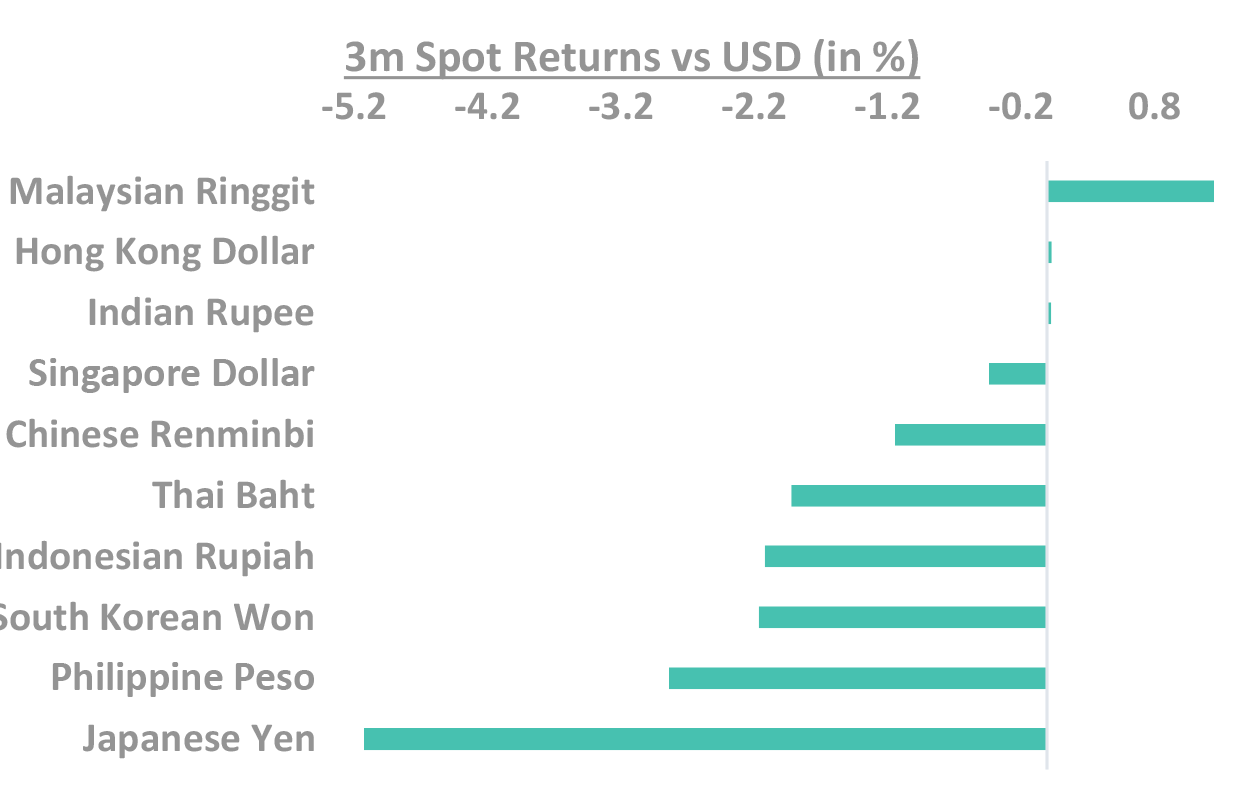
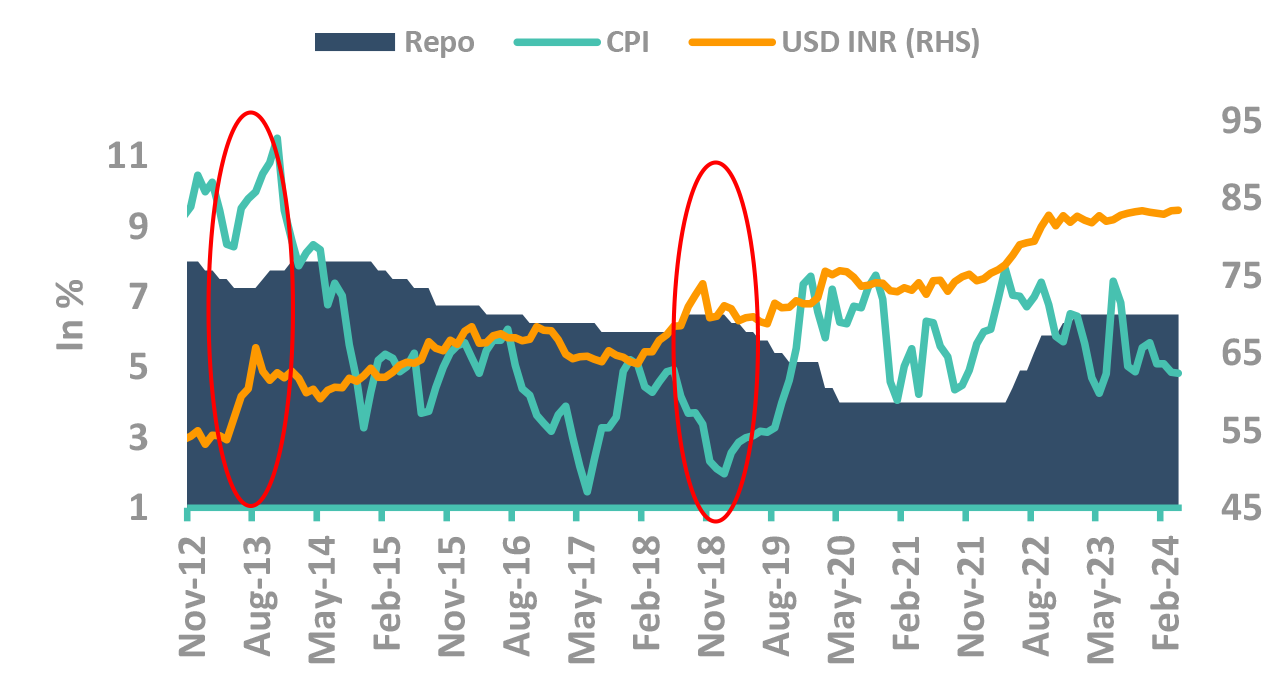
Rupee depreciation risks seem contained
-
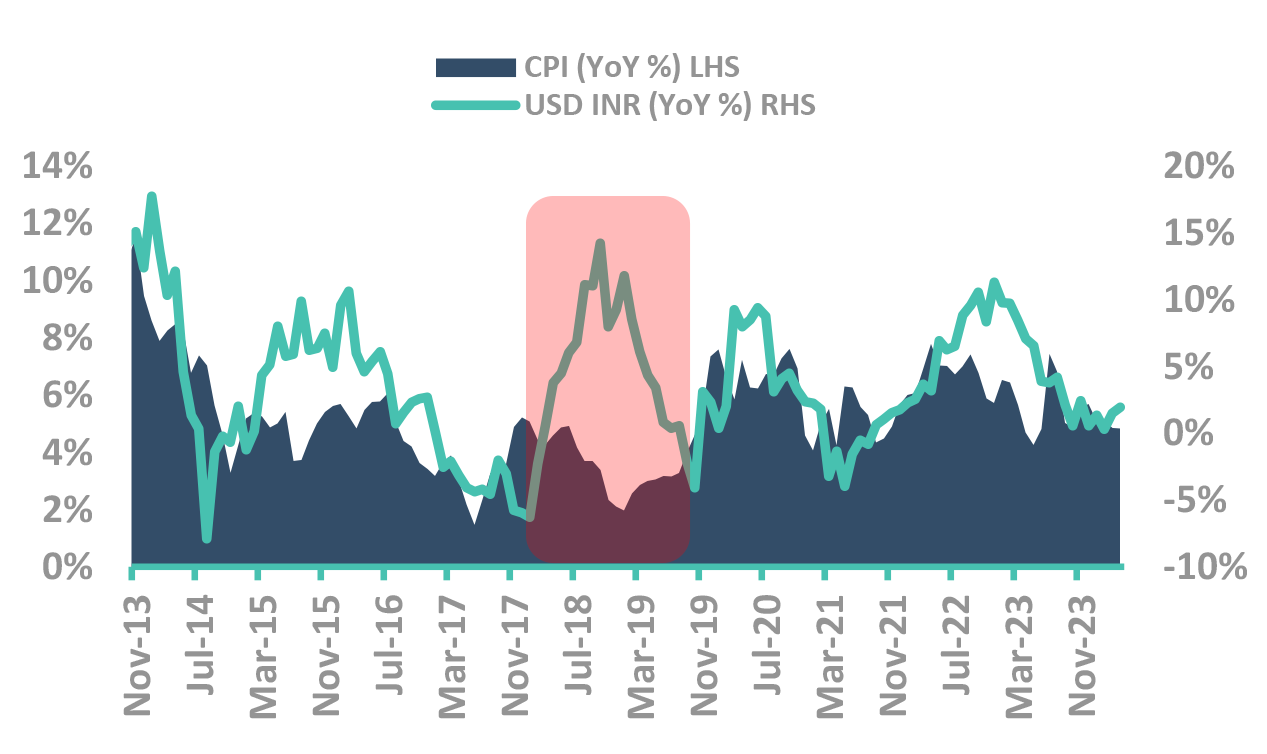
RBI has in past acted swifter to protect currency than inflation
- In 2013 and 2018 RBI increased rates when rupee depreciated
- In 2018, in inflation was within RBI’s target levels
We don’t see rupee depreciation risk
- Bond Inclusion (passive) flows to start in Jun
- Equity FPI flows (India being the sweet spot)
- Easing US yields to result into flows in emerging markets
Takeaway:
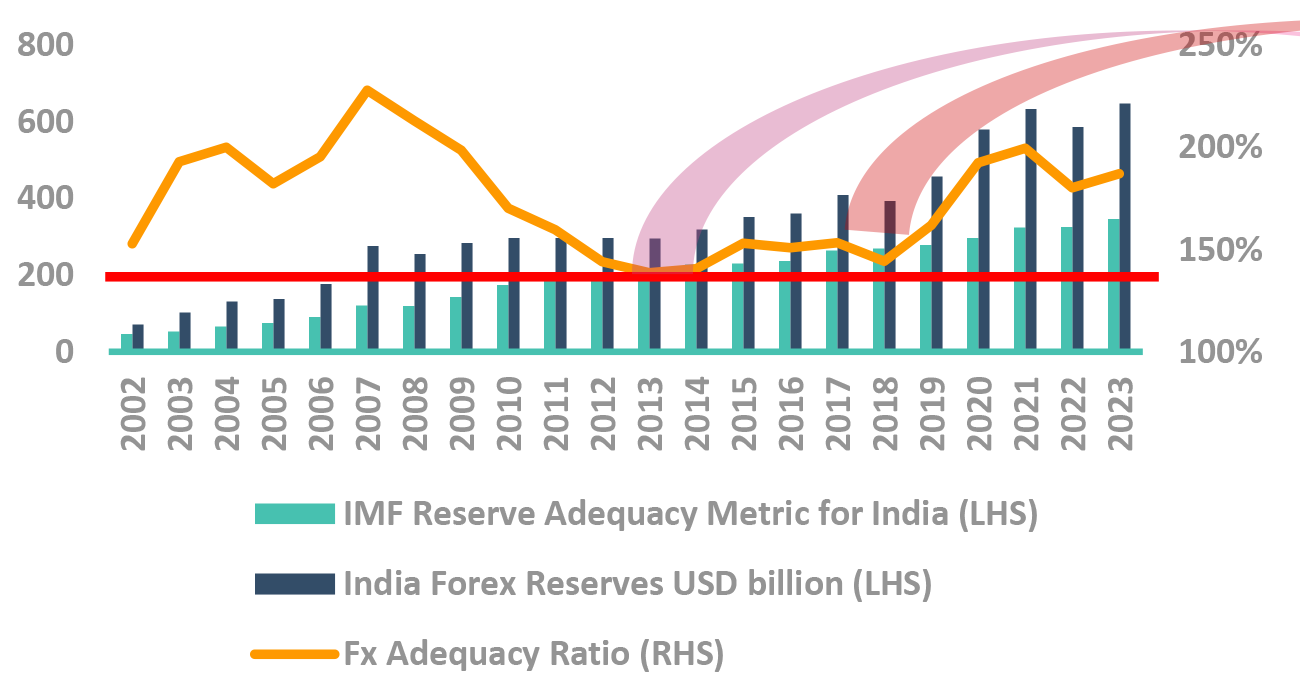
With record high forex reserve and passive flows around the corner, rupee depreciation risks seem contained
MPC – Monetary Policy Committee; CPI: Consumer Price Inflation; USD – US Dollar; Source: Bloomberg
What makes RBI Cut Rates?
In our view, the likely scenario
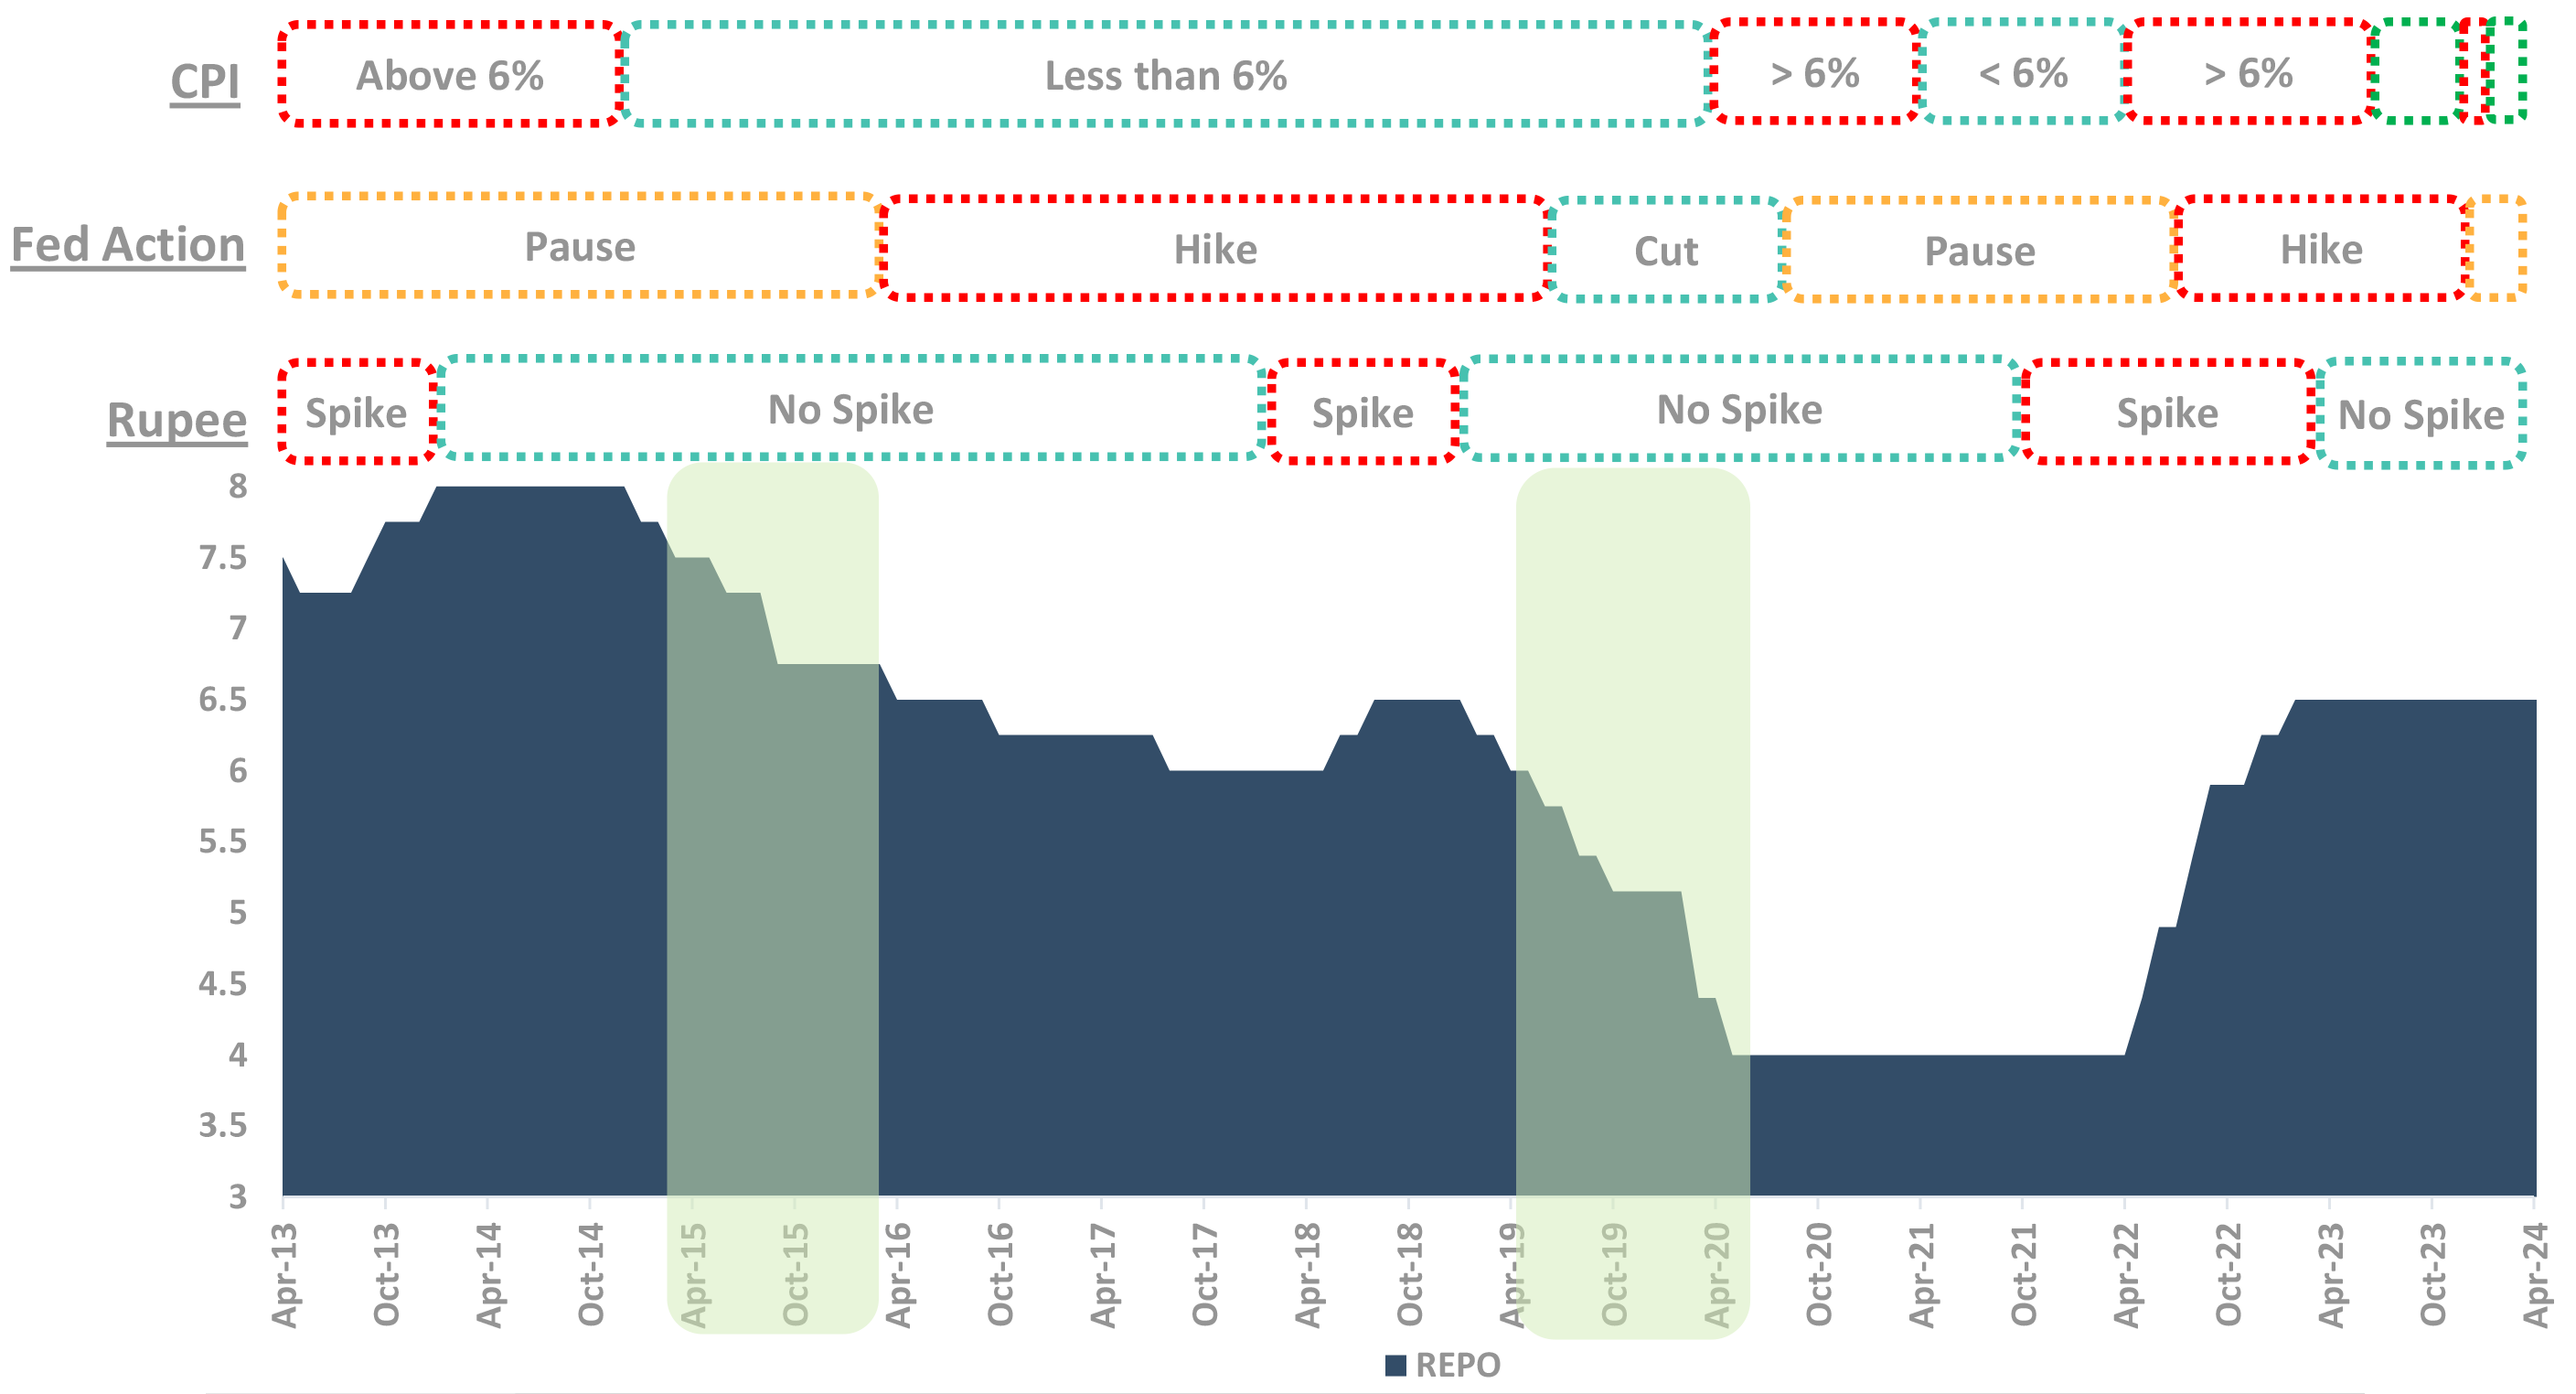
Rate cuts: Waiting for evidence from Fed cuts
-
Checklist for cut:
- Fed Pause/Cut
- Stable Rupee
- CPI less than 6% (except in 2013 when RBI didn’t have 6% target)
-
How is the Checklist now:
- Awaiting cuts from FED
- Given the FPI flows, forex reserves at $600bn+ and normalization of trade deficit, rupee to remain stable
- Inflation risks seem contained
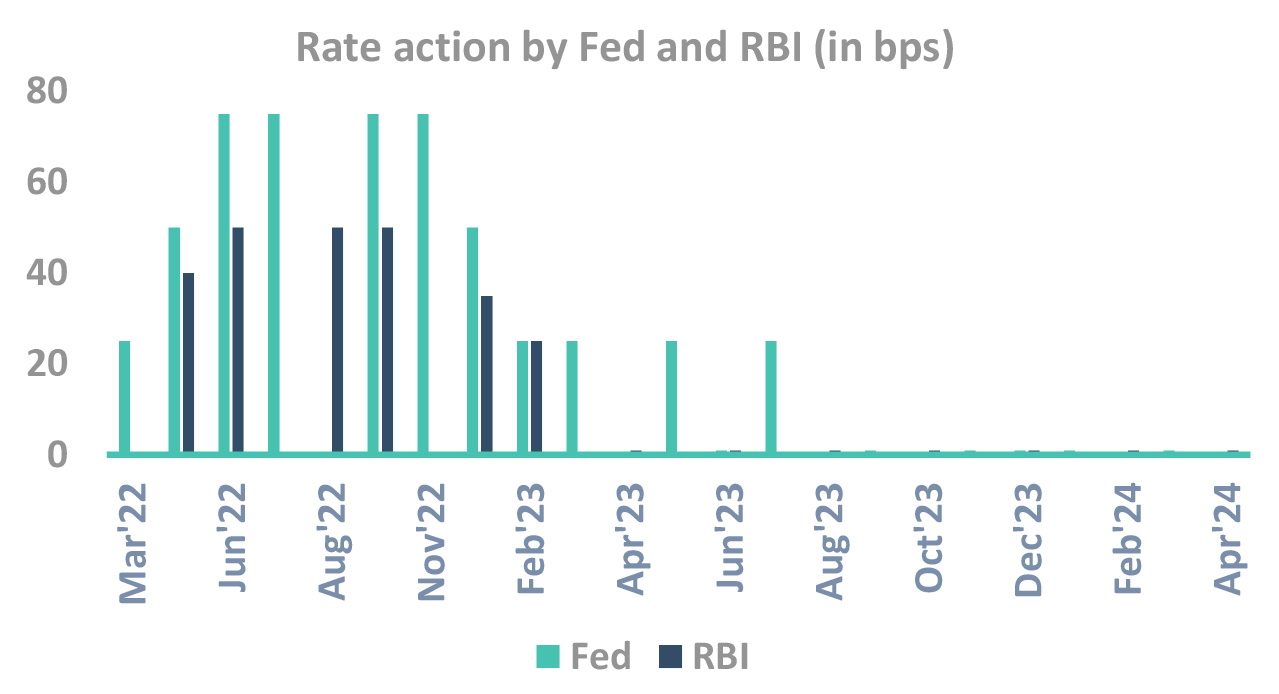
RBI actions followed FOMC – expect the same going ahead
Takeaway:
RBI MPC has shades from FED FOMC. RBI rate cut to follow Fed
Source – Bloomberg, Federal Reserve RBI: Reserve Bank of India; US FED: US Federal Reserve; FOMC: Federal Open Market Committee; MPC: Monetary Policy Committee
What makes RBI hike Rates?
Highly unlikely
Did you know – when our Fx reserves dip, RBI hikes
-
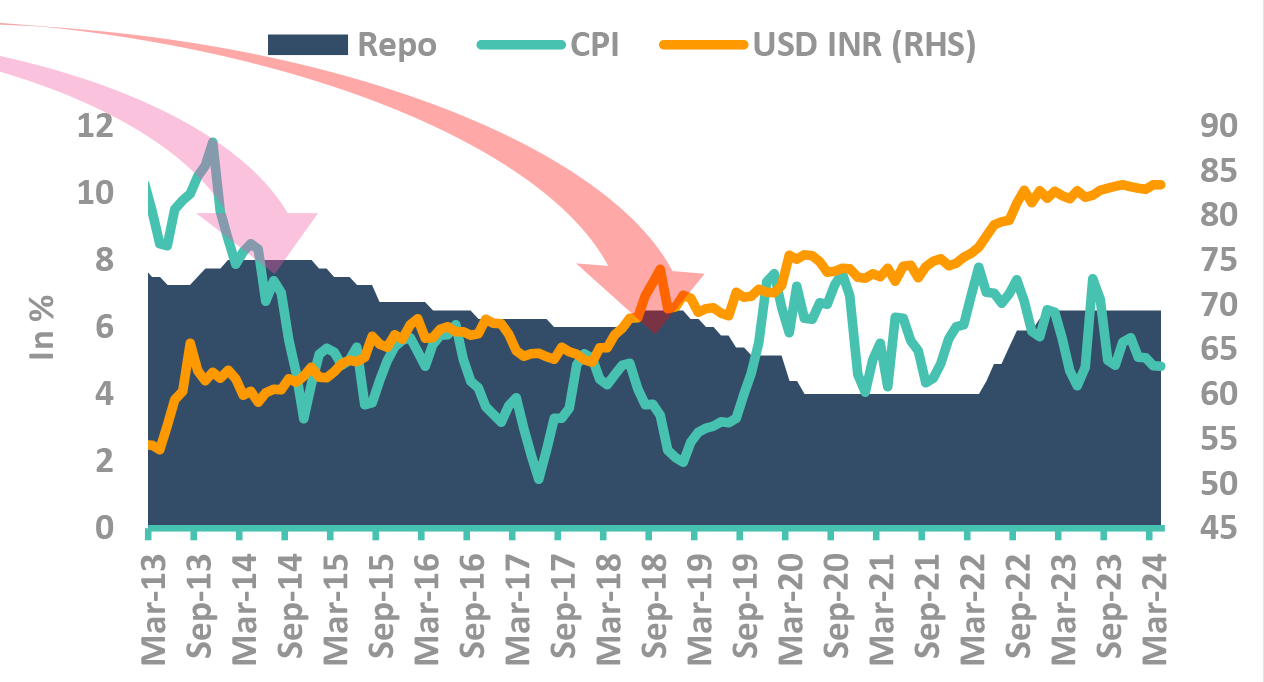
RBI only hiked rates twice in past 10 years, barring now
- Increased rates to control rupee, not inflation
RBI has tolerance for inflation, not rupee fall
- In 2018, inflation was within RBI’s target levels
- In 2013, inflation was high for long yet RBI cut
When RBI FX reserve fall
- RBI avoids using reserves and does rate hikes to control rupee.
Takeaway:
Foreign exchange reserves at record high levels
Source – Bloomberg, Reserve RBI: Reserve Bank of India; IMF: International Monetary Fund; US FED: US Federal Reserve; FX: Forex; CPI: Consumer Price Inflation
Core CPI moderates further
Growth remains resilient
FPI flows to support INR
Low risk in general elections
Let’s turn to Fiscal policy
Generally, it drives the long bond yields
It is reflected in demand/supply equation
Fiscal policy is favouring bonds right now
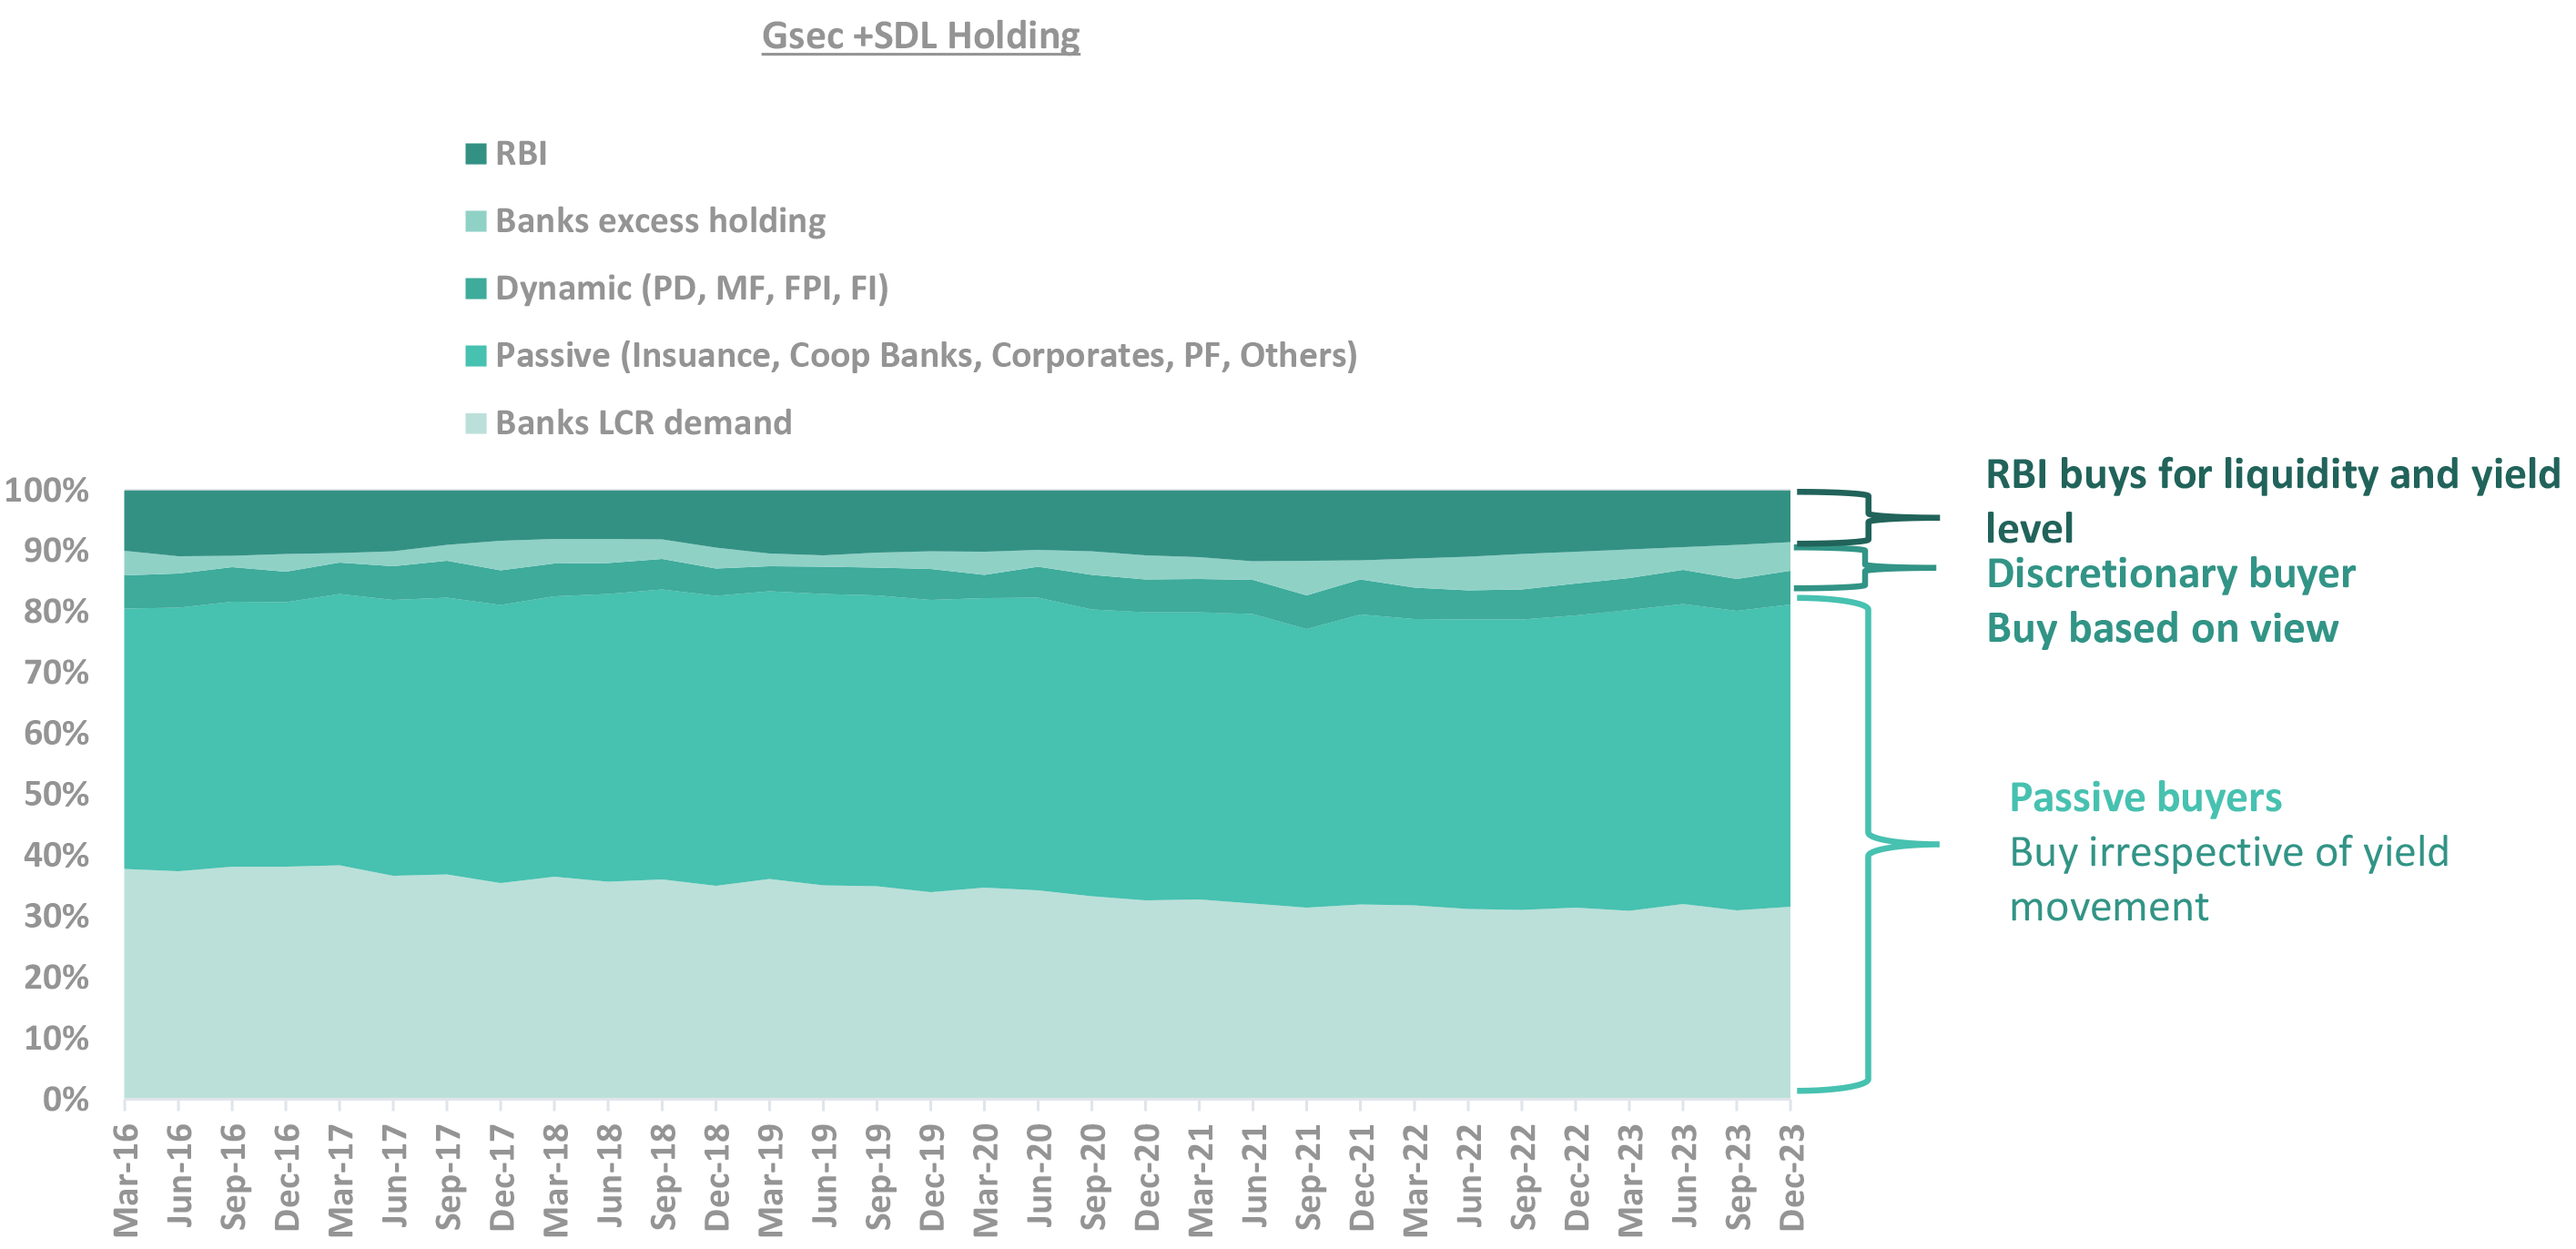
Only a small part of bond buyers are discretionary buyers
They drive yields
Supply fluctuation is borne by these buyers
Gsec market is still driven by lumpy institution purchases
Takeaway:
Increase in supply impacts the discretionary buying. Banks excess holding, passive buyers have been absorbing the supply
Source – DBIE LCR – Liquidity Coverage Ratio; SDL – State Development Loans; PF – Provident Funds; PD – Primary Dealerships; MF – Mutual Funds; FPI – Foreign Portfolio Investors; FI – Financial Institutions; RBI: Reserve Bank of India; GSec: Government Securities
Comfortable supply/demand dynamics for FY25
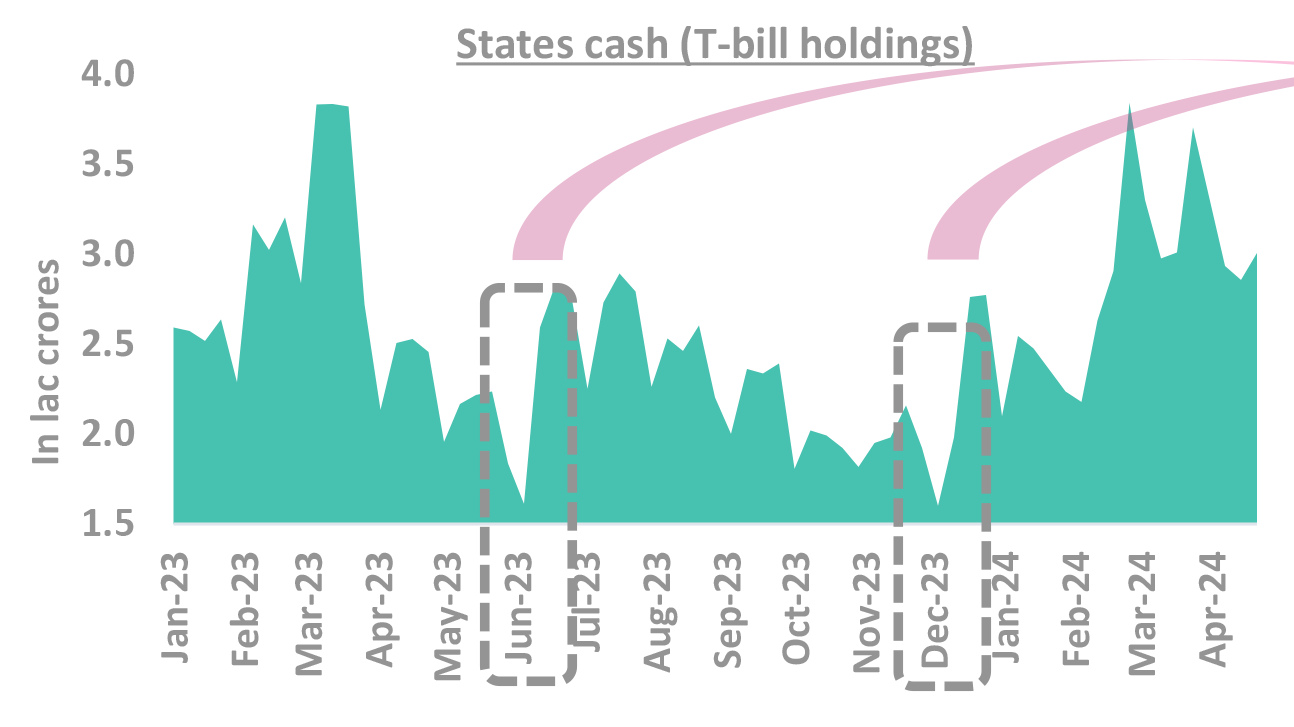
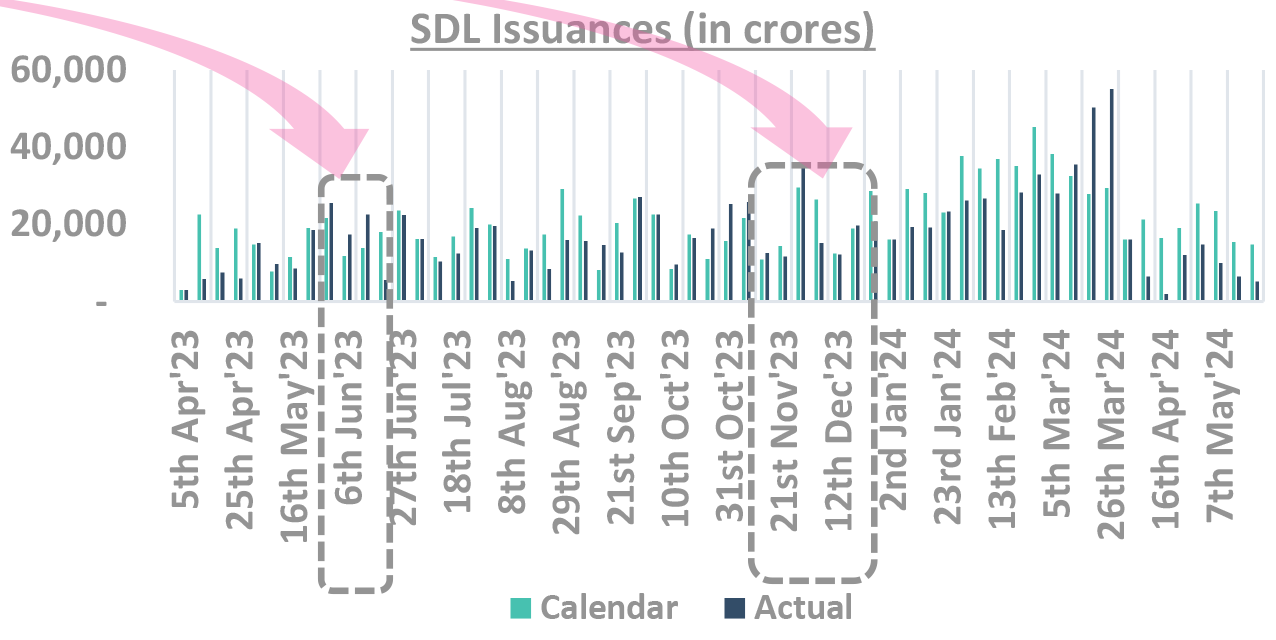
SDL supply only increases when states cash dip
Takeaway:
SDL demand-supply to remain well-matched in FY25
Source – DBIE, RBI T-bill: Treasury Bill; SDL: State Development Loans
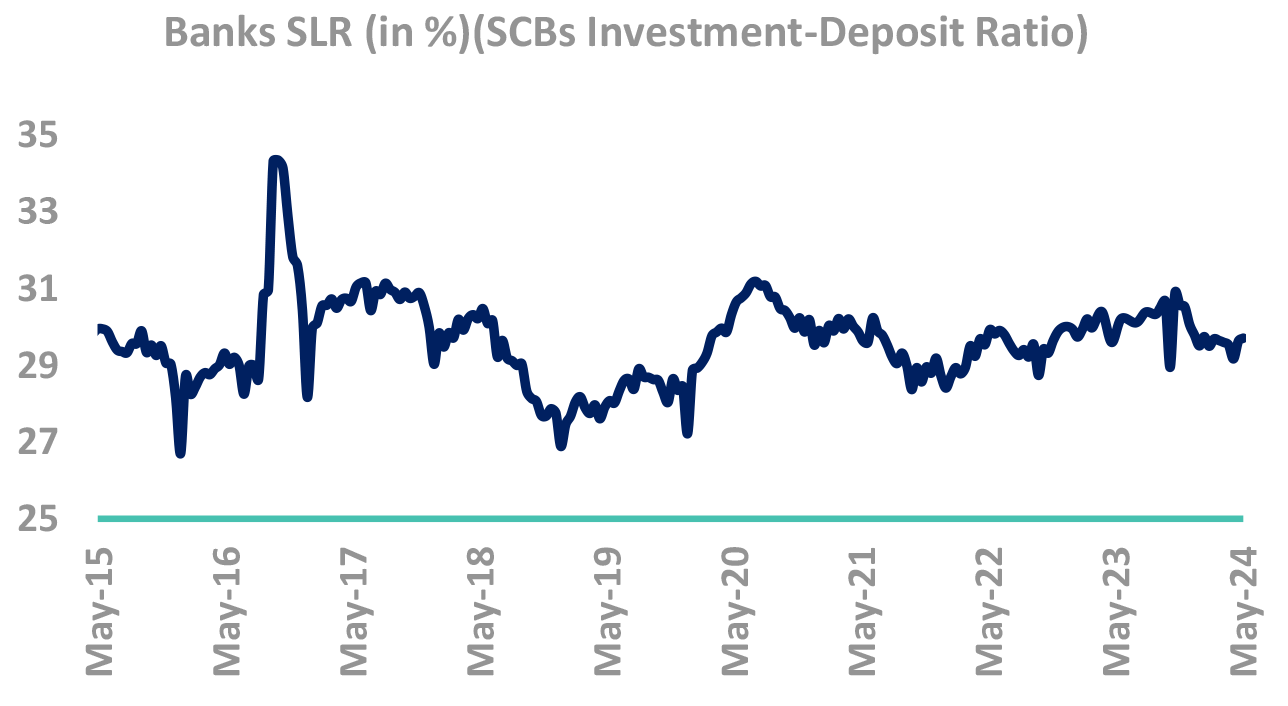
Banks have reduced holding
-
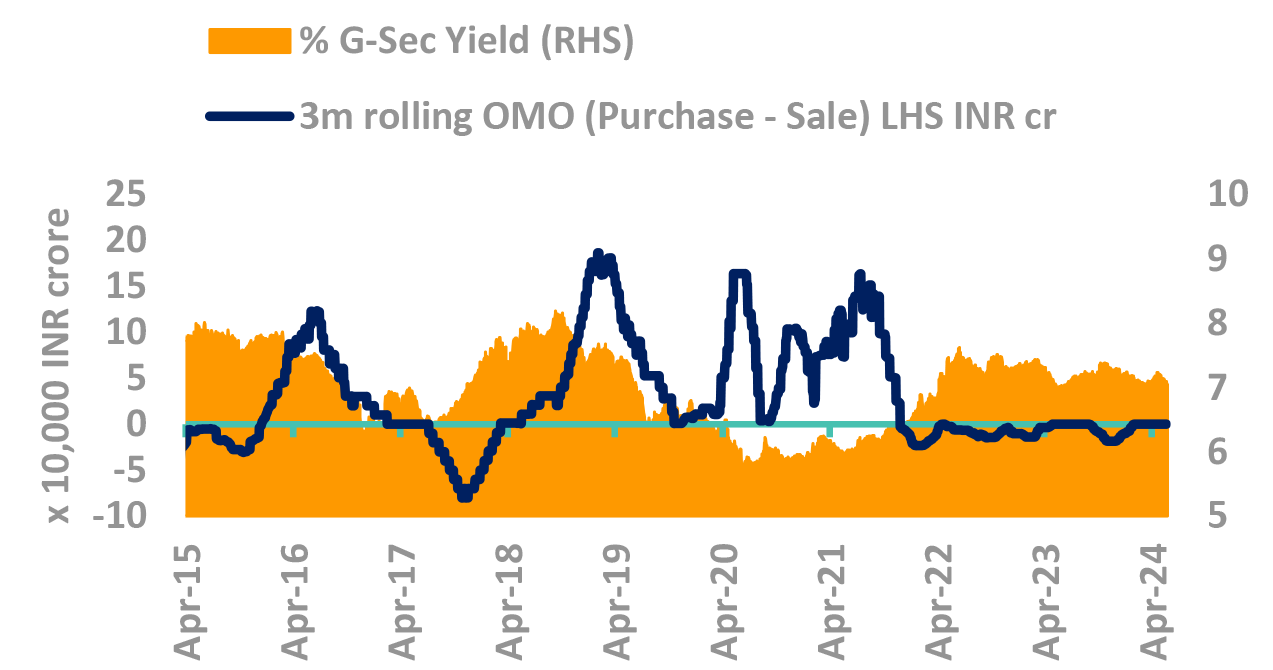
Yields usually track RBI OMO purchases
- Yields have strong correlation with RBI OMO
- Demand/Supply mismatch is filled in by RBI
-
RBI softened its liquidity management stance. However,
- Liquidity continues to remain tight despite VRR operation by RBI
- Further intervention necessary to bring liquidity to neutral
Takeaway:
Bank’s demand could shift to carry assets like SDLs and Corporate Bonds with the change in HTM regulations
Source – Bloomberg, DBIE, Internal OMO – Open Market Operations, SLR – Statutory Liquidity Ratio; G-Sec – Government Securities; RBI: Reserve Bank of India; SCB: Scheduled Commercial Bank; CIC: Currency in Circulation
FPI buying to drive excess demand in FY25
Takeaway:
Estimated excess demand of ₹ 0.75 lac crores.
Source – Internal, CGA G-Sec: Government Securities; OMO: Open Market Operation; RBI: Reserve Bank of India; FPI: Foreign Portfolio Investment; NPS: National Pension System; MF: Mutual Fund; SDL: State Development Loans; SLR: Statutory Liquidity Ratio; PF: Provident Fund; EPFO: Employees’ Provident Fund Organisation; NSSF: National Small Savings Fund
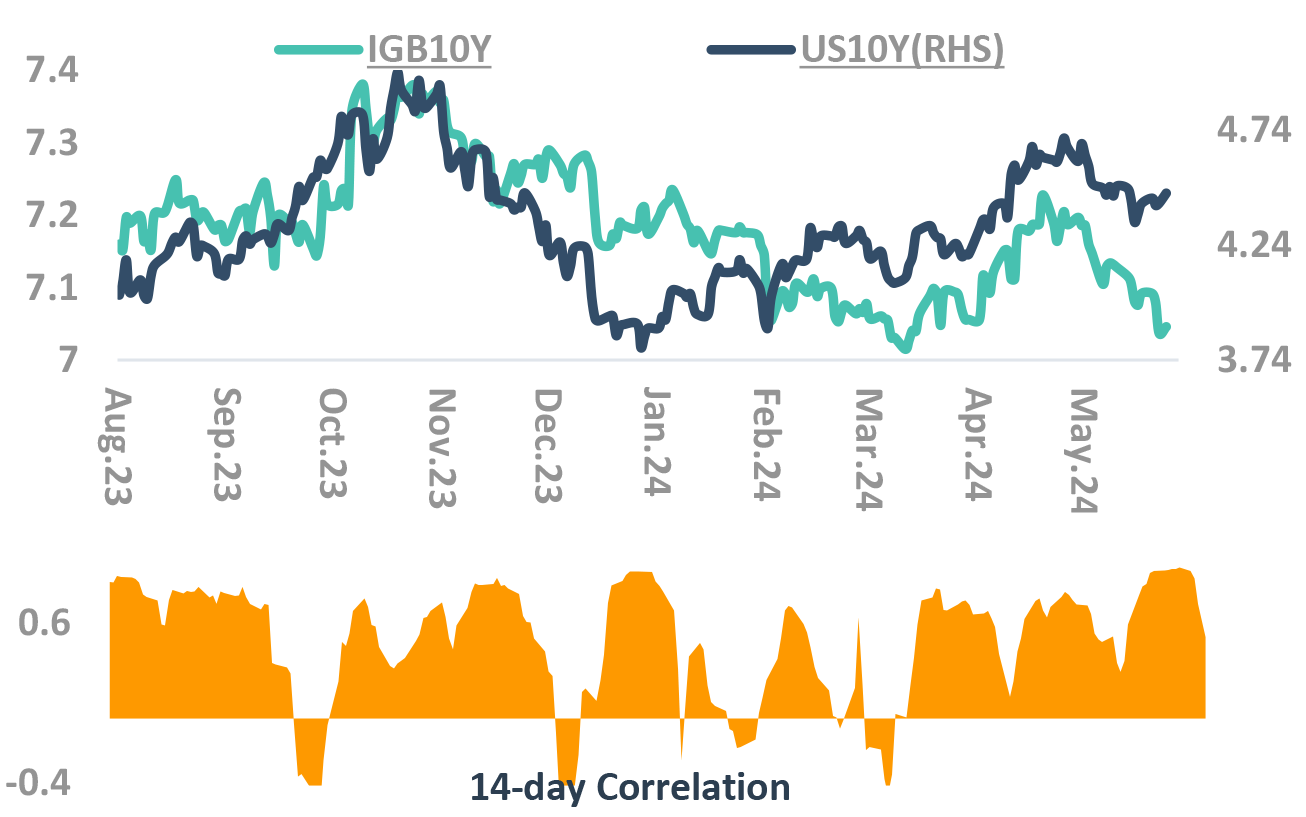
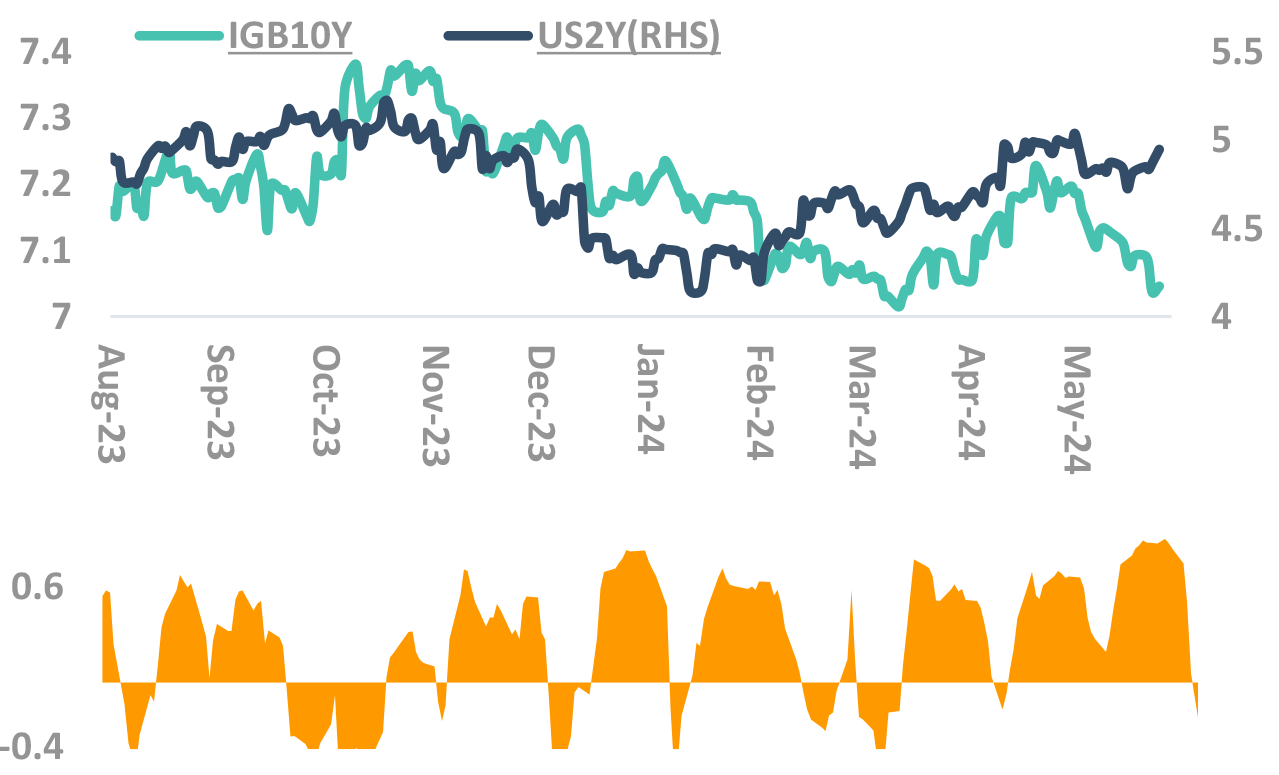
Indian yields tracking Global yields
But with lopsided beta
Impact of US yields on Indian yields
Takeaway:
Expect correlation to reduce further
Source – Bloomberg, Internal Fed: Federal Reserve; CPI: Consumer Price Inflation; RBI: Reserve Bank of India; IGB: India Government Bond; FOMC: Federal Open Market Committee; UST: US Treasury
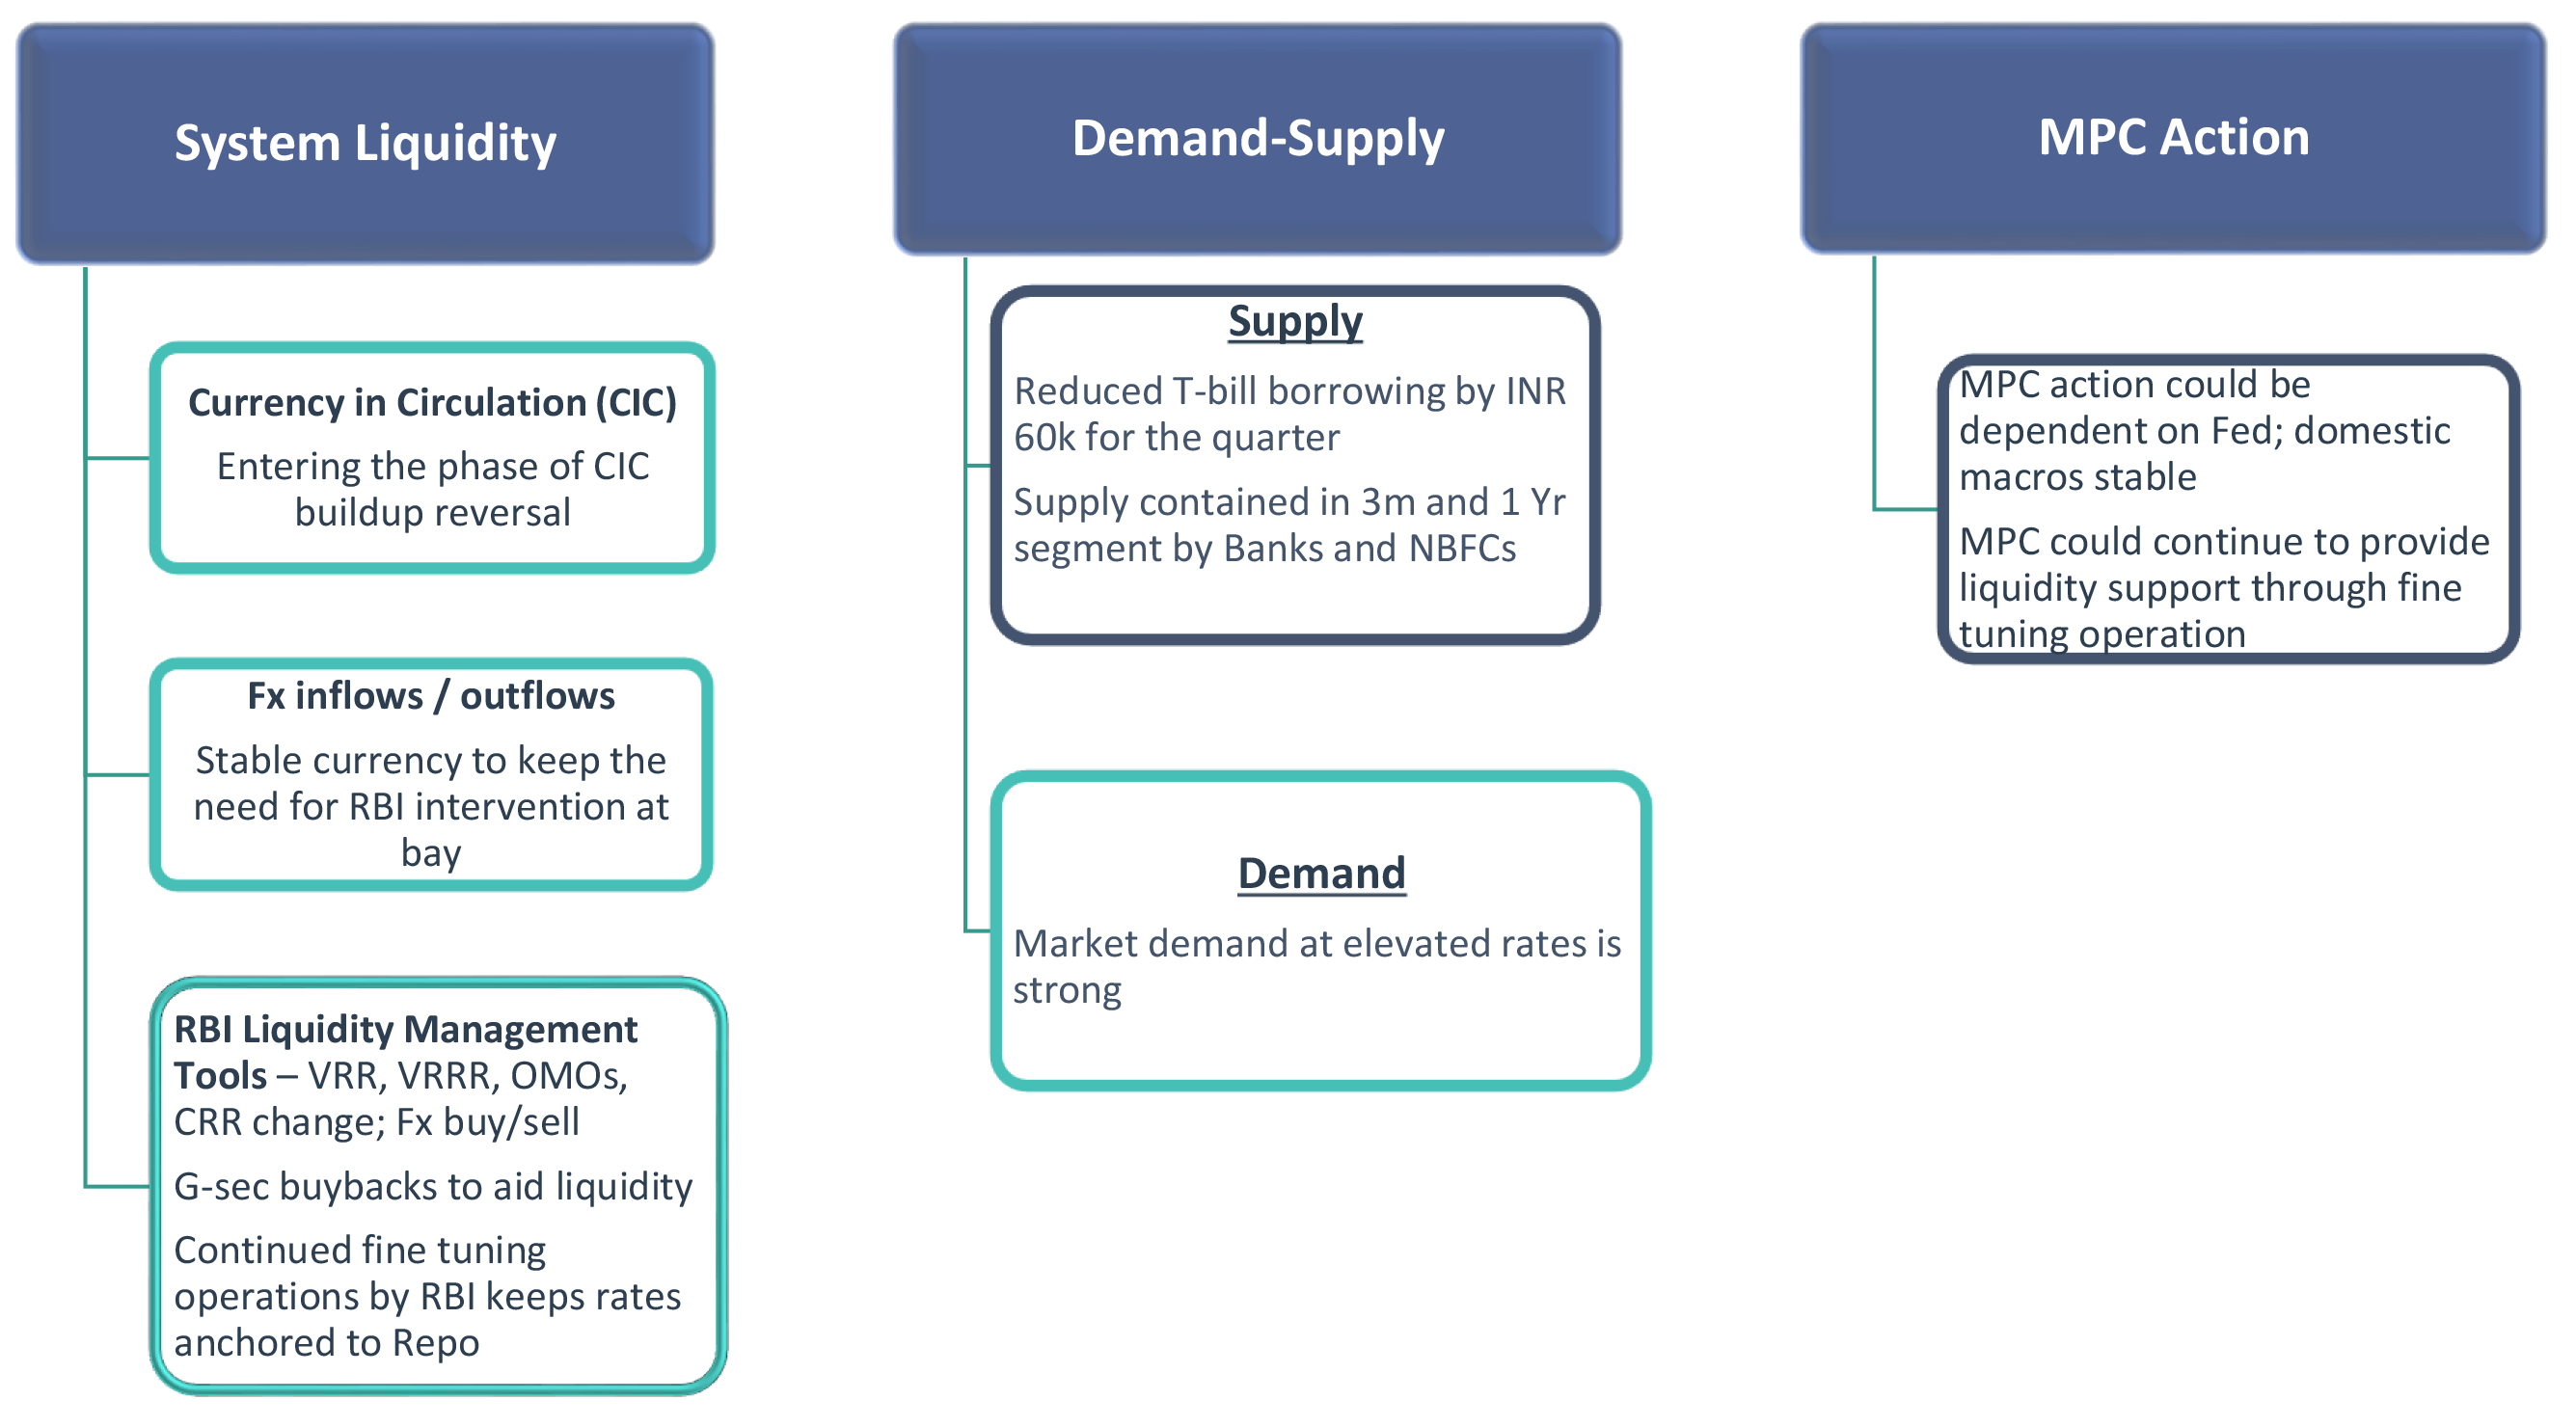
Money Market Assessment Framework
Takeaway:
With lower T-bill borrowing and high expected govt. spending coming in post elections,
money market yield drivers currently are favourable. We remain long across our money market funds.
CIC: Currency in Circulation; CD: Certificate of Deposits; OMO: Open Market Operations; VRR: Variable Rate Repo; VRRR: Variable Rate Reverse Repo; RBI: Reserve Bank of India: GOI: Govt of India
Near term liquidity drivers turn positive
Takeaway:
Liquidity drivers in the near term remain positive, low risk to upward movement in money market rates
G-Sec – Government Securities; CIC: Currency in Circulation Source – Bloomberg, RBI, DBIE, *Internal Estimates
Well matched demand-supply dynamics
-
Reduced T-bill borrowing by INR 60k crore in current quarter, led to spread compression of 10-15bps in upto 3m segment
-
1Y CD spread over policy rate still attractive at ~120bps
- Despite 1YCD-Repo spreads shrinking from highs of 140bps as of March 2024 to ~120bps now
CD Maturities of ~INR 1.1 lakh cr in June to ensure continued supply
- However, demand has matched supply keeping rates anchored
- CD’s outstanding flat vis-s-vis March end at ~INR 3.7 lakh cr

Takeaway:
With well matched demand-supply combined with lower T-bill supply to keep money market rates anchored
CD: Certificate of Deposits *Internal Estimates
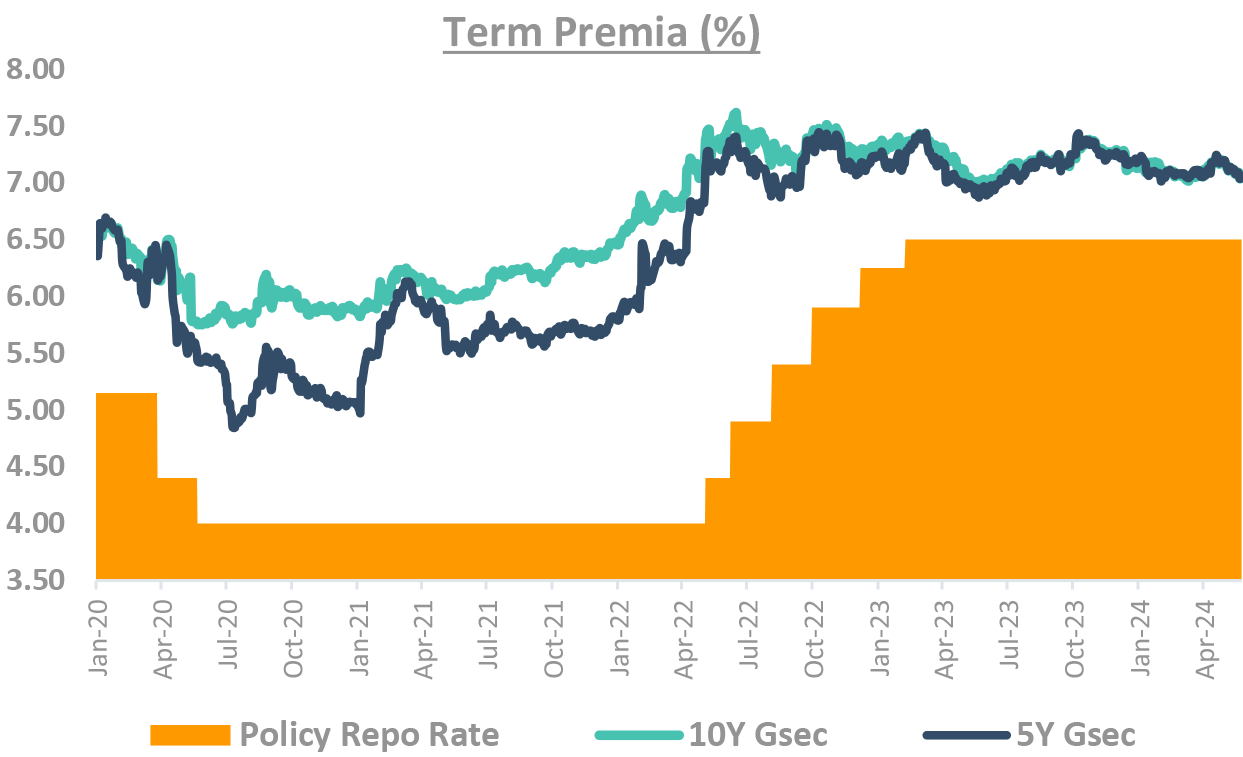
Term premia is still not low
-
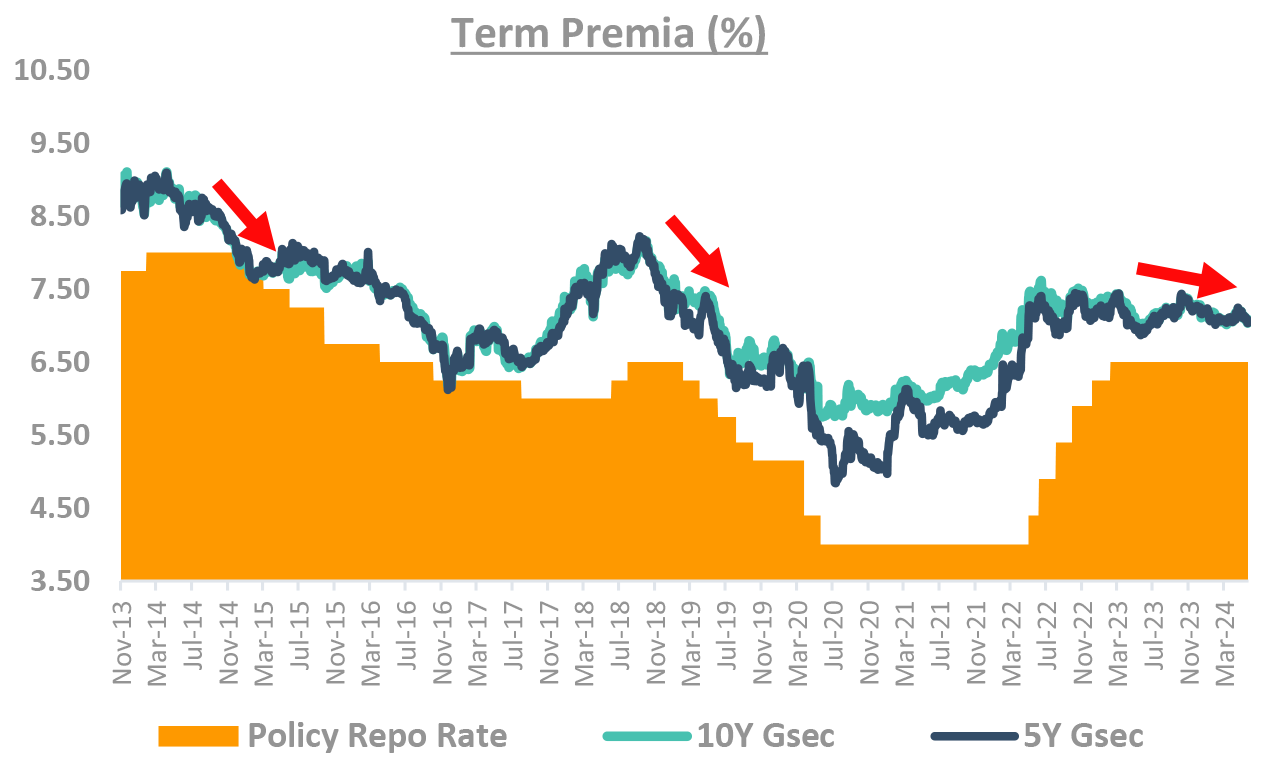
Term premium falls sharply before rate cuts
- This time, the slope of the fall is much less
- If rate cuts get priced, the spread of 70bp will be high
-
Why do we prefer slope, not absolute levels?
- The slope removes the underlying demand/supply dynamics and thus can be compared across time
-
Even absolute levels are attractive
- Even absolute levels are attractive from prior regimes preceding rate cuts
-
Term premia: function of demand/supply and rate expectation
- During covid term premia high
- Supply high: Govt increased fiscal deficit
- Repo rates were expected to rise
- Post covid term premia fall is natural
- Supply low: reduced FY25 supply, FPI flows
- Rates are expected to fall
- During covid term premia high
-
The trend of high demand, low supply strong
- Unlikely that govt will leave fiscal consolidation
Takeaway:
Term premia is still attractive given favorable demand supply dynamics
Source – Bloomberg
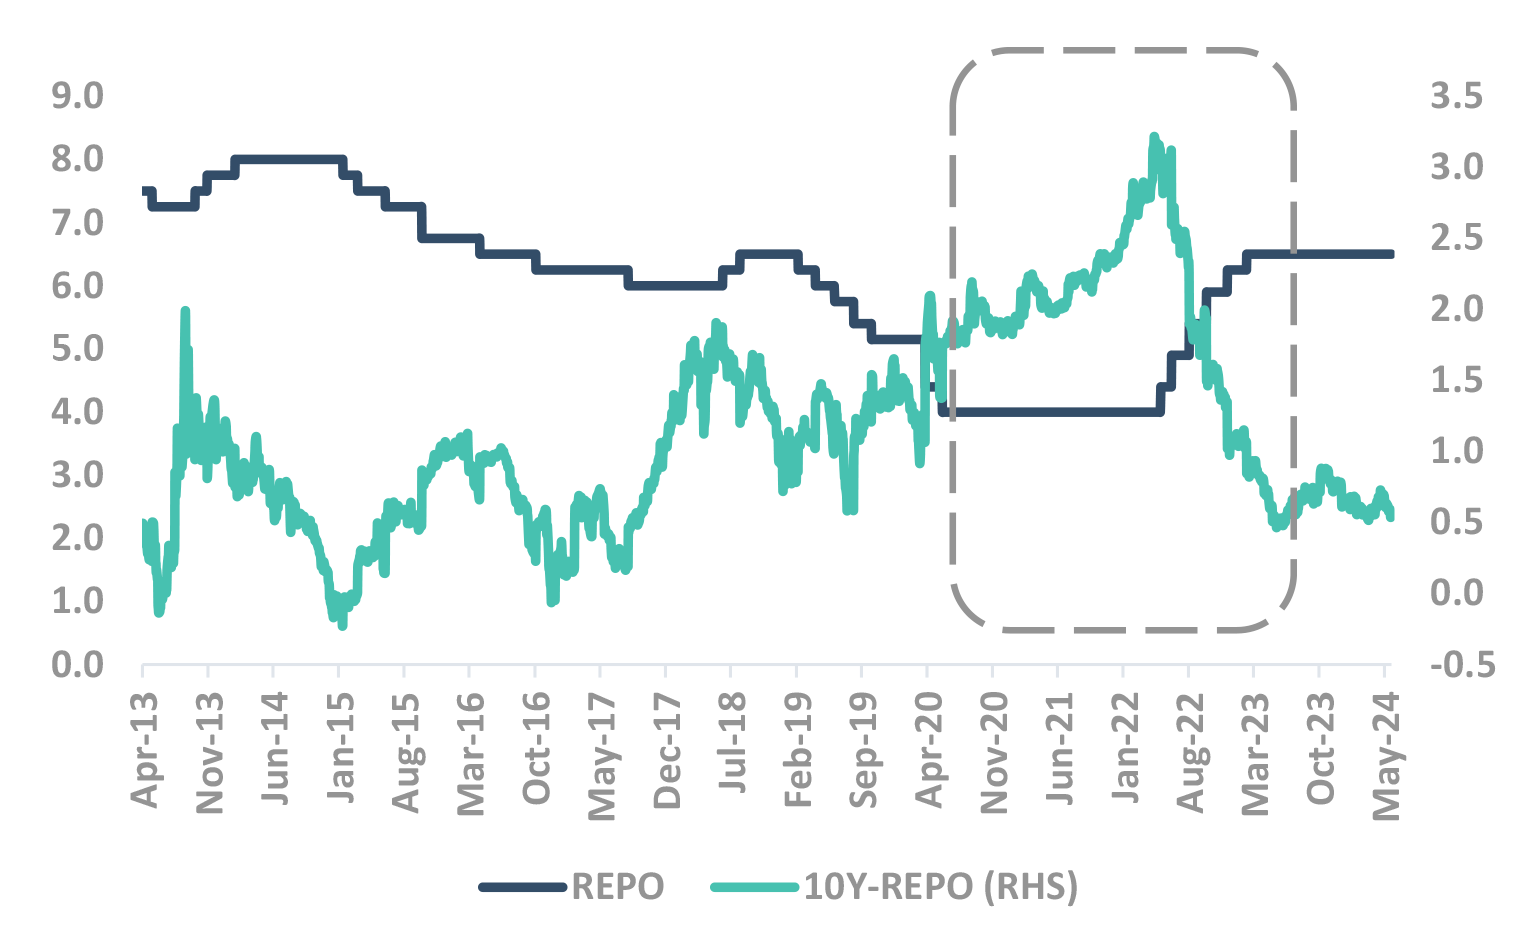
Recency bias: Is 10Y-Repo Spread low?
-
The 10Y yield and repo spreads are not low
-
Incorrect to compare with covid era spreads: Recency bias
-
Covid was exceptional times, and barring covid, the spreads are not low
-
With the govt. borrowing reduced and bond inclusion flows, the spread is not bad.
Takeaway:
While recently spreads have reduced, past data suggests that current yield levels are not extremely low
Source – Internal, Bloomberg
DSP FI Framework checklist
DSP Duration decision:
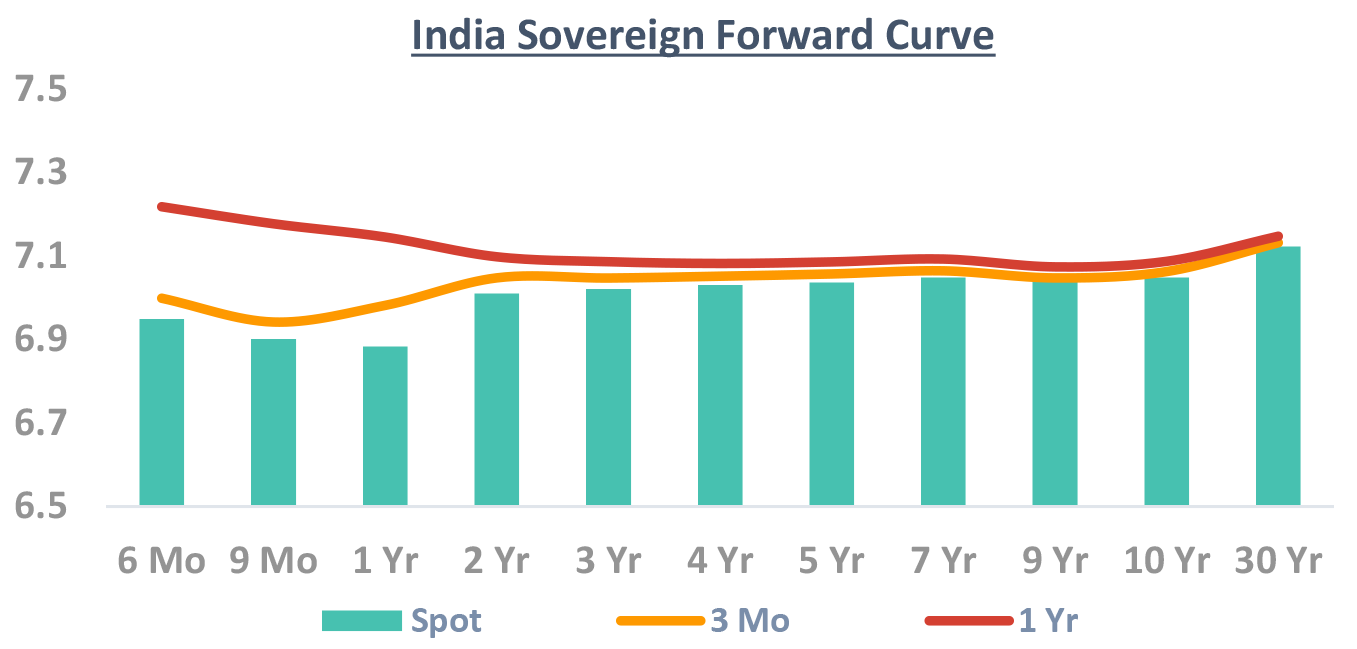
The chart shows how much expected yield fall/rise is already
priced in the current curve.
Large gap between the current yield and forward yield shows
that yield change is priced in – and thus yield change will not
give capital gain/loss.
Similarly small gap means that the market is not pricing change
in yields.
Short-term yields (2Y-5Y) may rally more than long term (7Y+)
- The forward curve is inverted, we think that it is unlikely to realize
Yet, long term yields may end up making more money
- The duration of 30Y is 4x the duration of 4Y bond
- i.e. for every 40bp fall of 4Y, the 30Y bond needs to fall only 10bp
- Even if curve bull steepens by 30bp, long bonds give similar value

Source – Bloomberg; as on 27/May/24
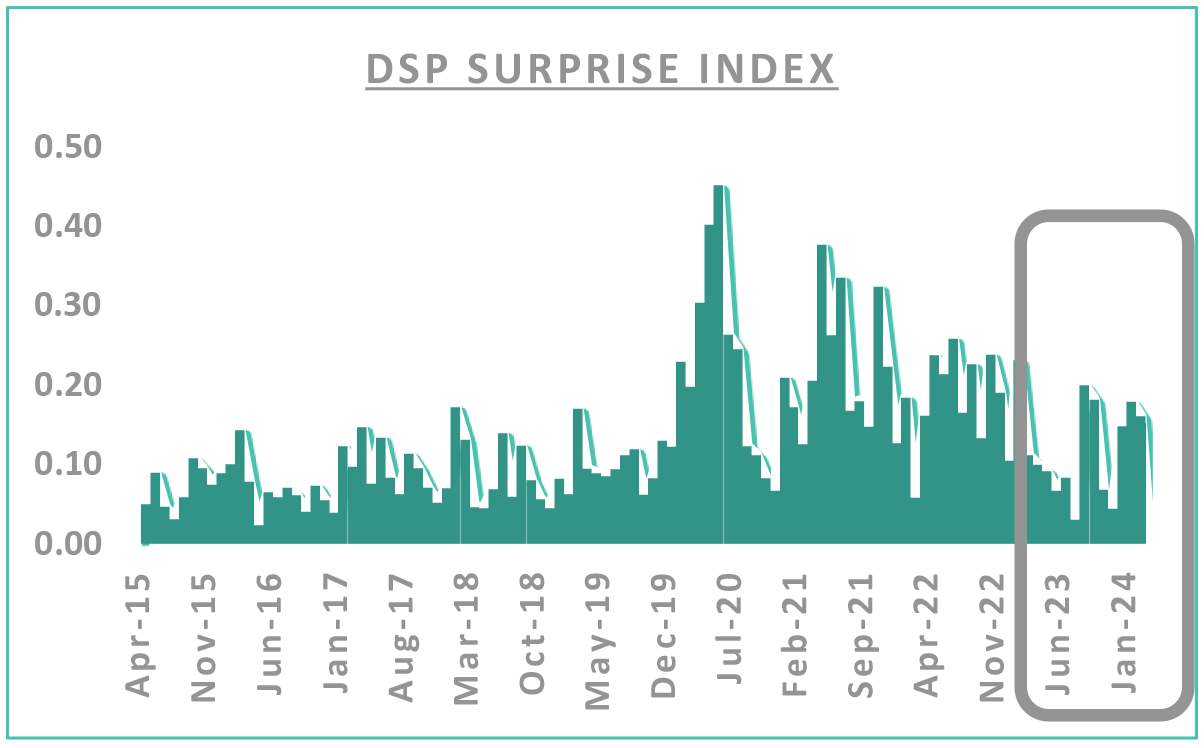
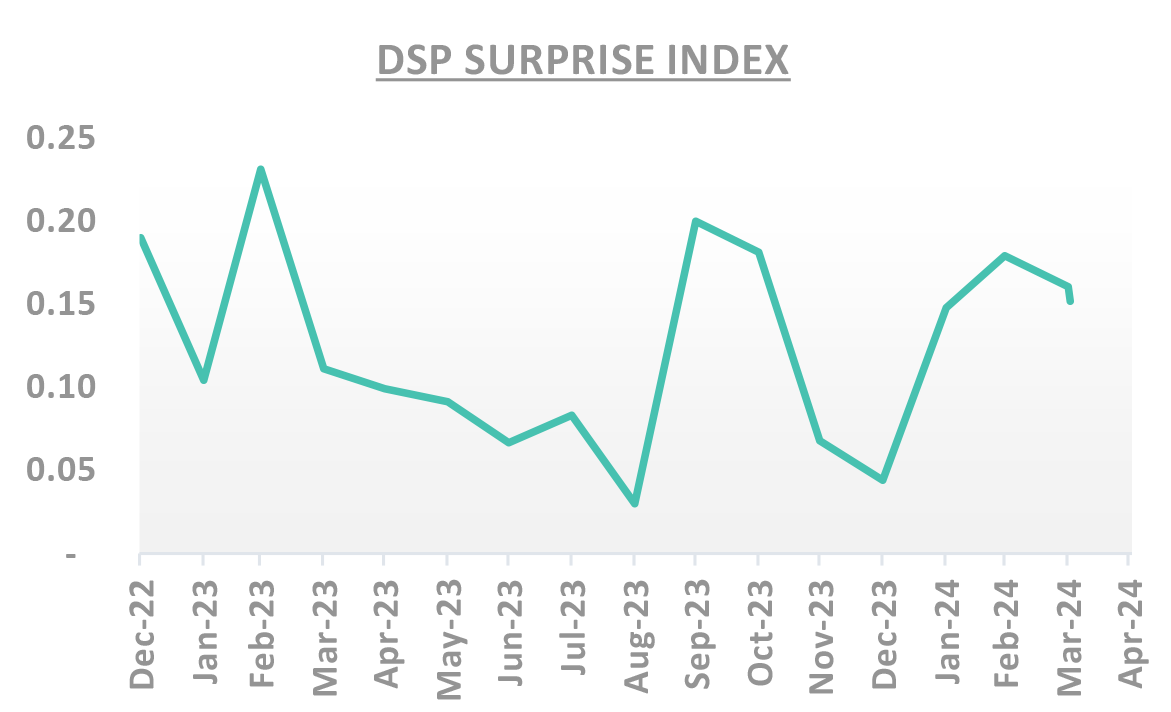
Introducing DSP “SURPRISE” Index
DSP Surprise Index: An alert to manage the risks!
-
In last 1-Year
- The index spiked in Feb 23, Oct 23 and Apr 24
- During these times, the markets were most volatile
- We found our funds had reasonable underperformance
-
Interpretation
- During high DSP Surprise Index times, we would prefer to rationalize our risks.
- During low DSP Surprise Index times, we would prefer to run conviction trades
Takeaway:
When Index high -> cut risks. When Index low-> execute view optimally
We have discussed duration and yield movement.
How do we choose corporates and credit?
DSP Asset Allocation:
-
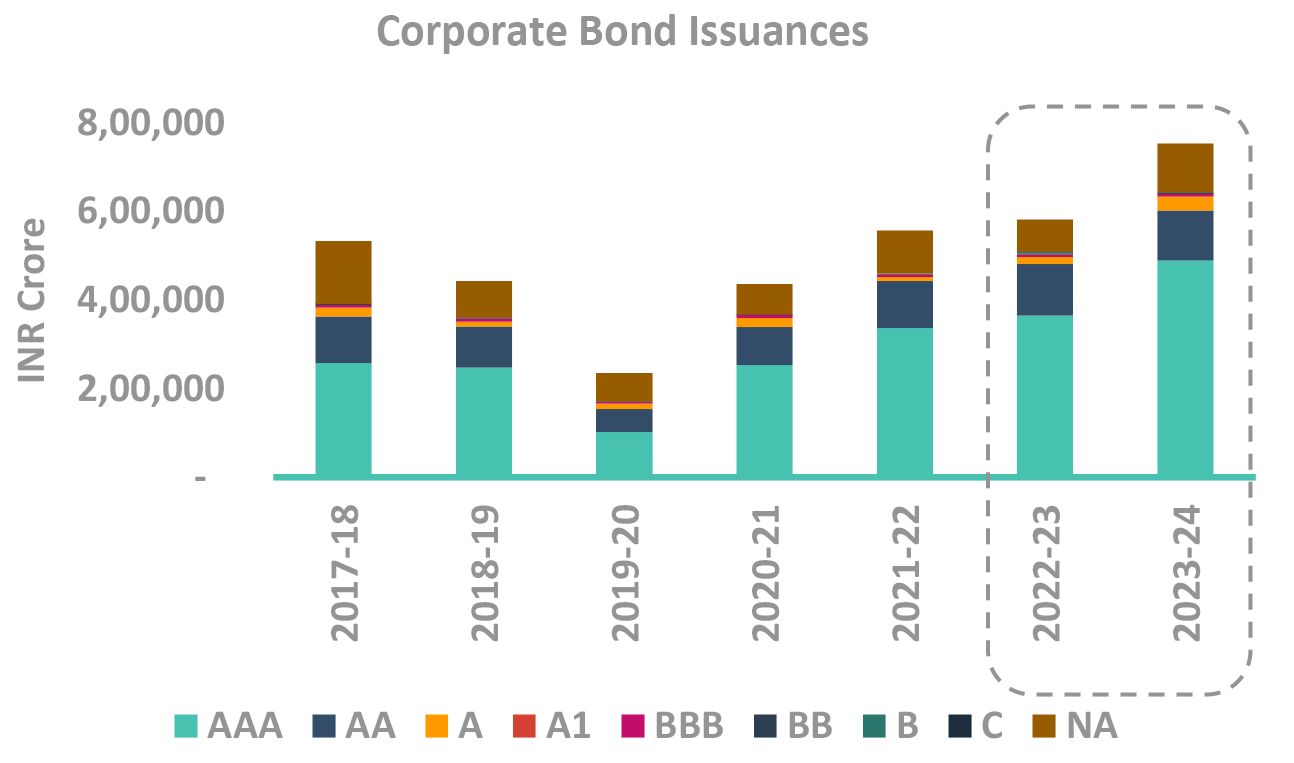
Supply has remained manageable so far
- Issuance has doubled in May to April 2024, it has touched INR 54000 crore compared to April INR 27000 crore as most issuers prefer to stay away from Primary market.
- Issuances were mainly in NBFC and HFC segment and PSU supply has slowly started mainly by REC and NABARD. Going ahead we expect supply to pick up in PSU segment mainly after Election results and RBI policy in first week of June.
-
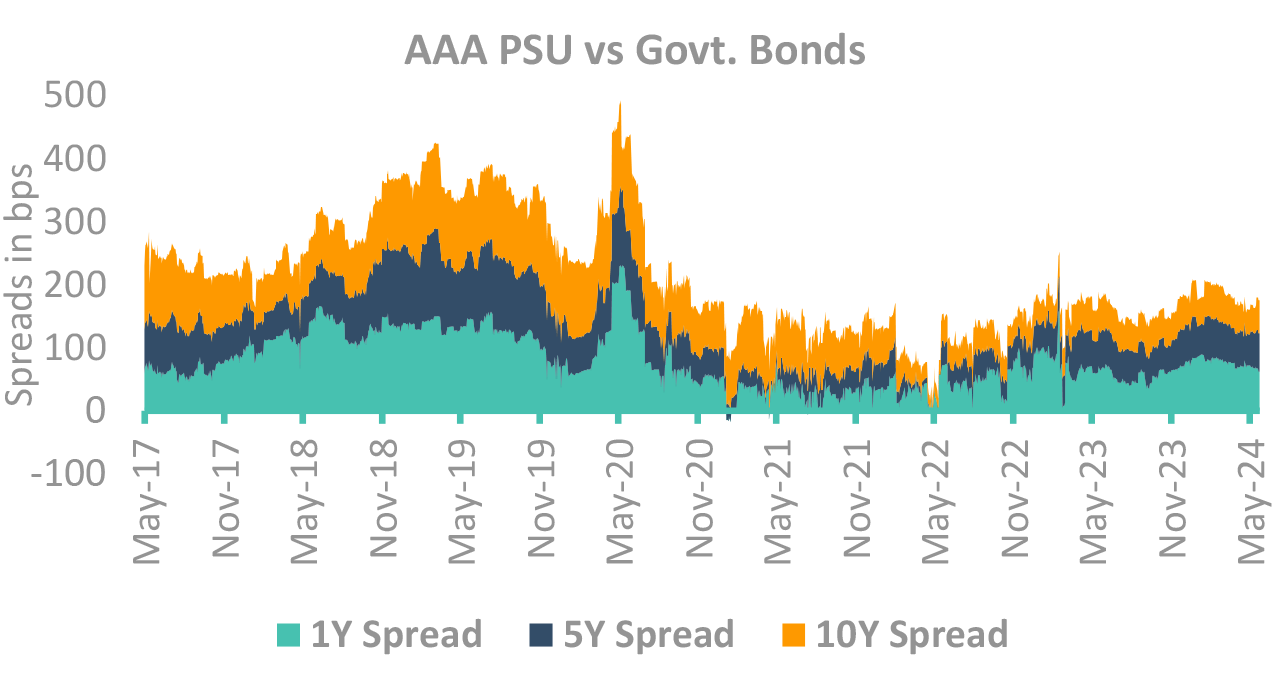
Corporate bond spreads moved up
- AAA PSU Spread has widened to 60bps from earlier 50bps whereby NBFC spreads has touched at 110bps mainly in 3Y segment.
- Issuances are expected in 3-10Y from PSU segment and NBFC/HFC issuances will be mainly in 1-3Y.
- Primary supply has picked up from Mid-May and expected to increase in coming months especially from AAA PSU Segment.
Takeaway:
Corporate bond spreads has widened as expected and closed at 60bps. Comfortable liquidity and high
carry is the only added advantage to remain invested in 1-3Y segment.
Source – Bloomberg, CCIL, Internal, PSU: Public Sector Undertaking, NBFC: Non-Bank Financial Companies
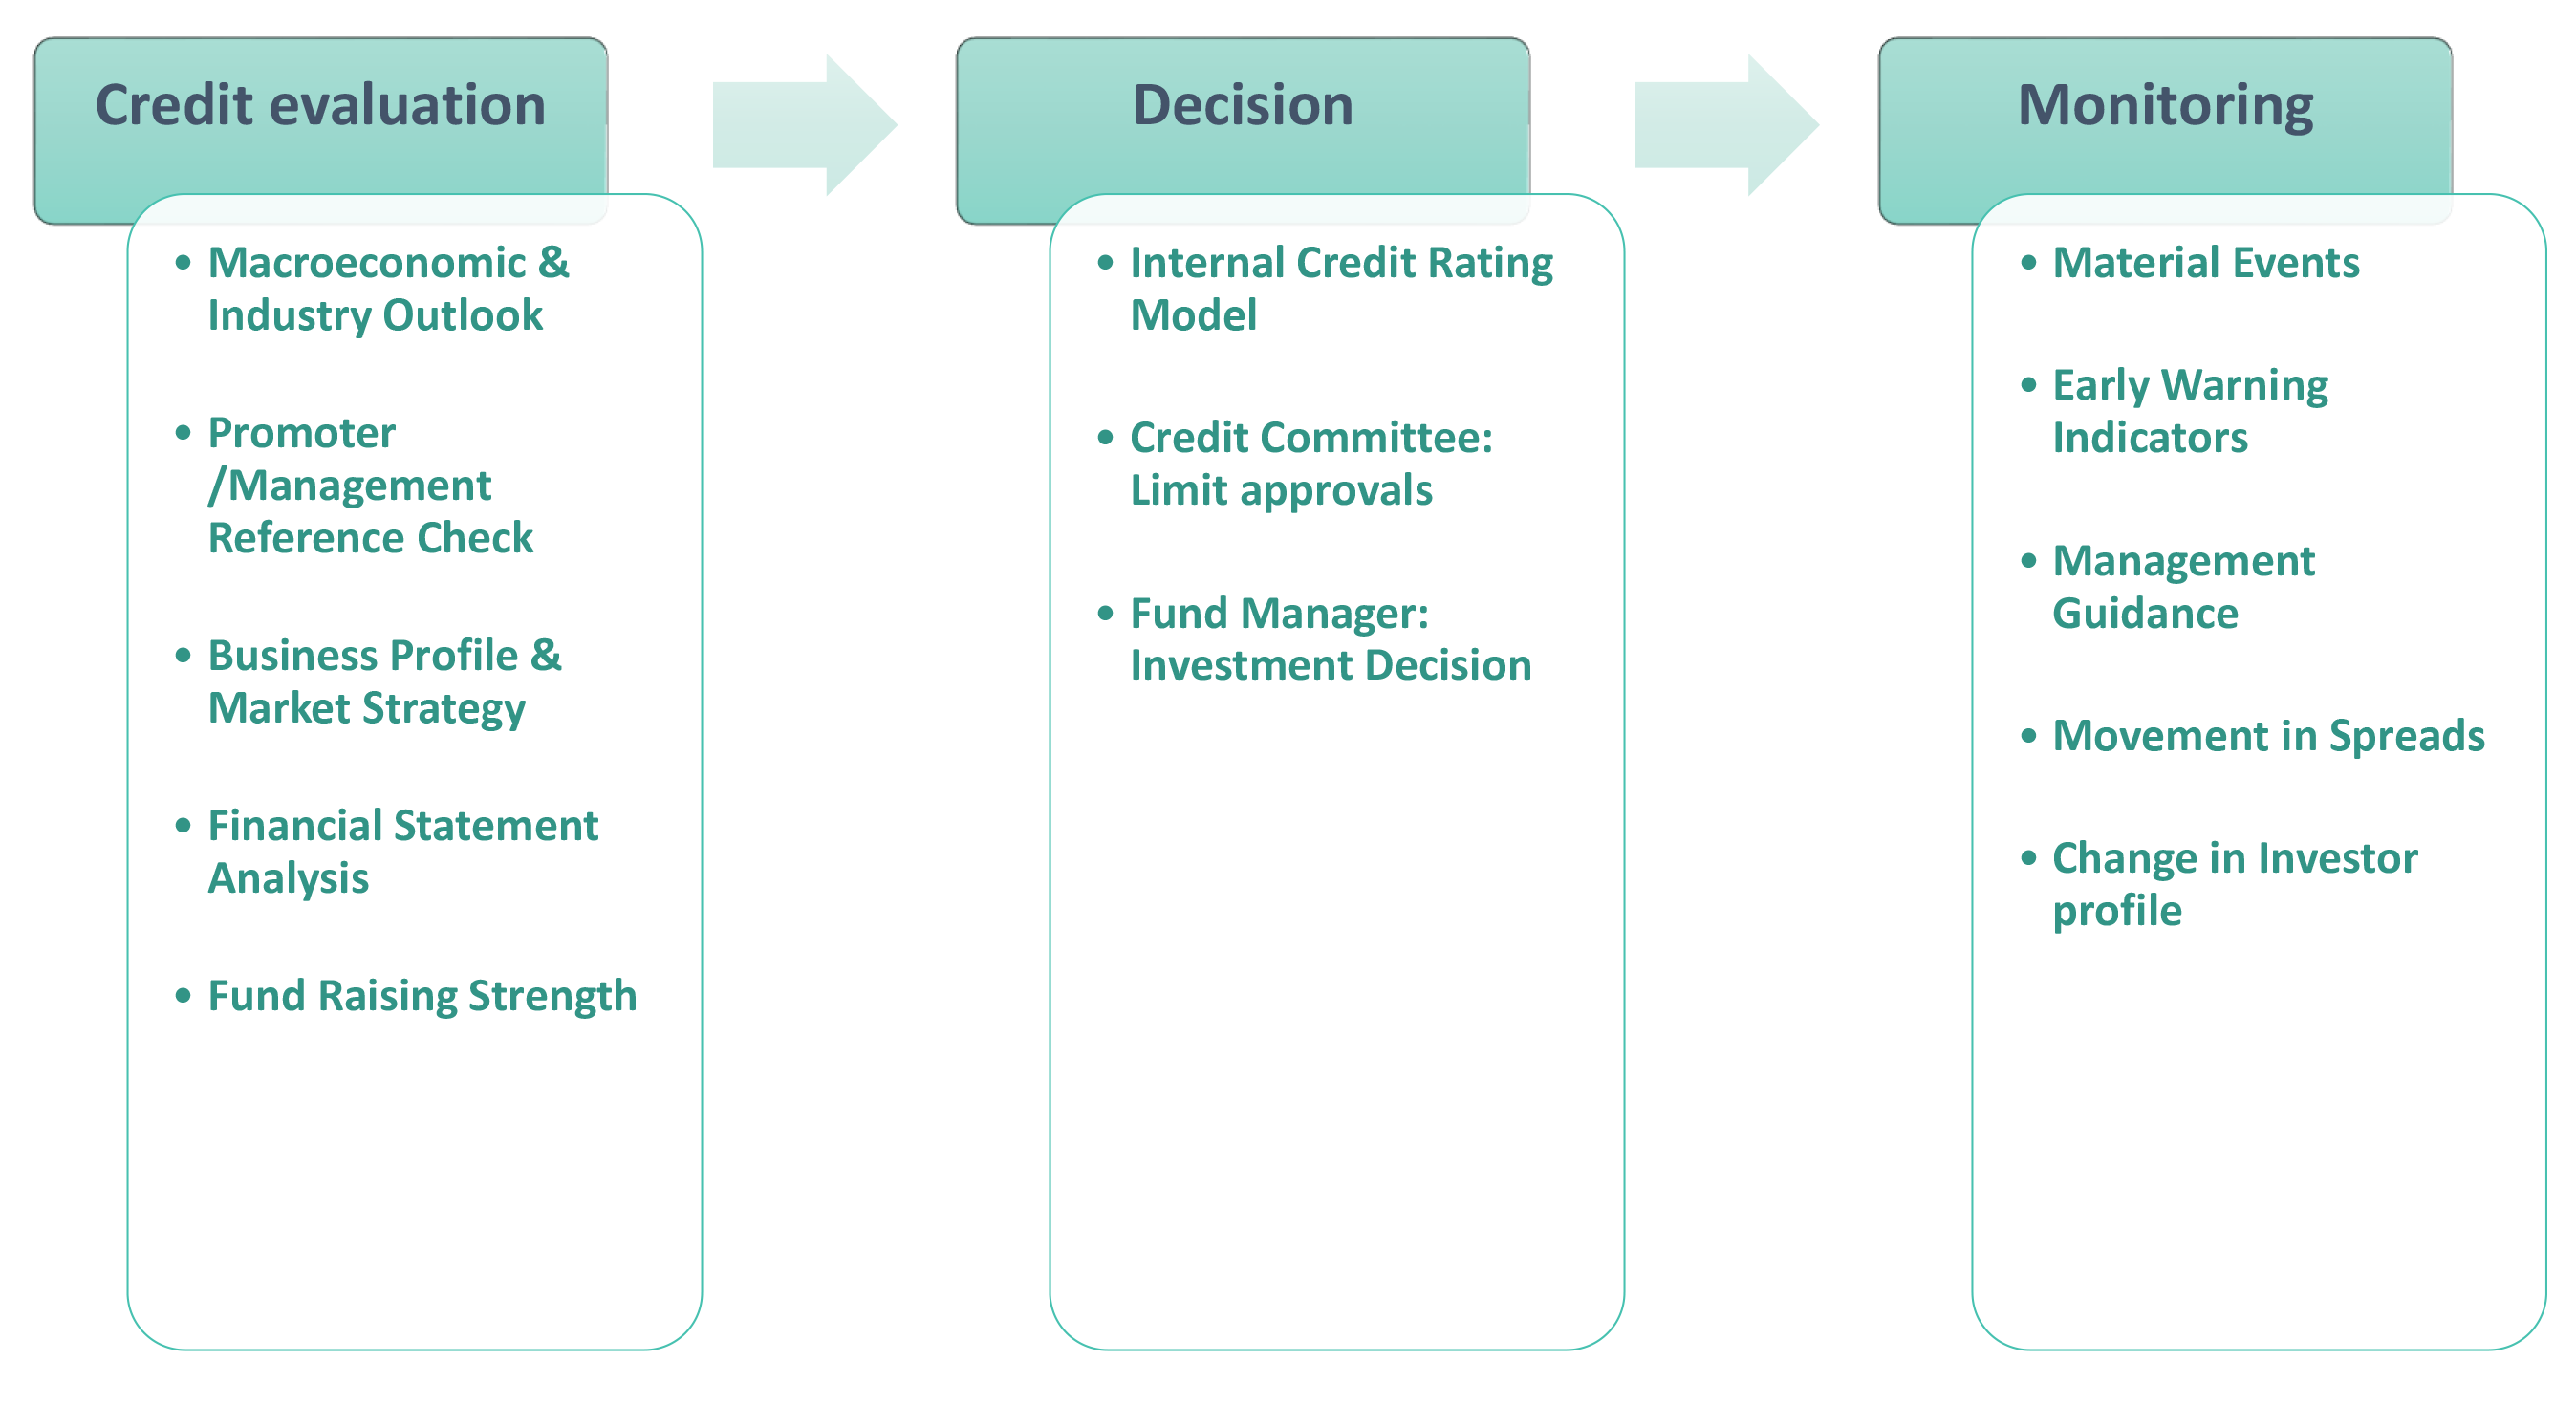
DSP Credit Investment Process – Focus on Governance
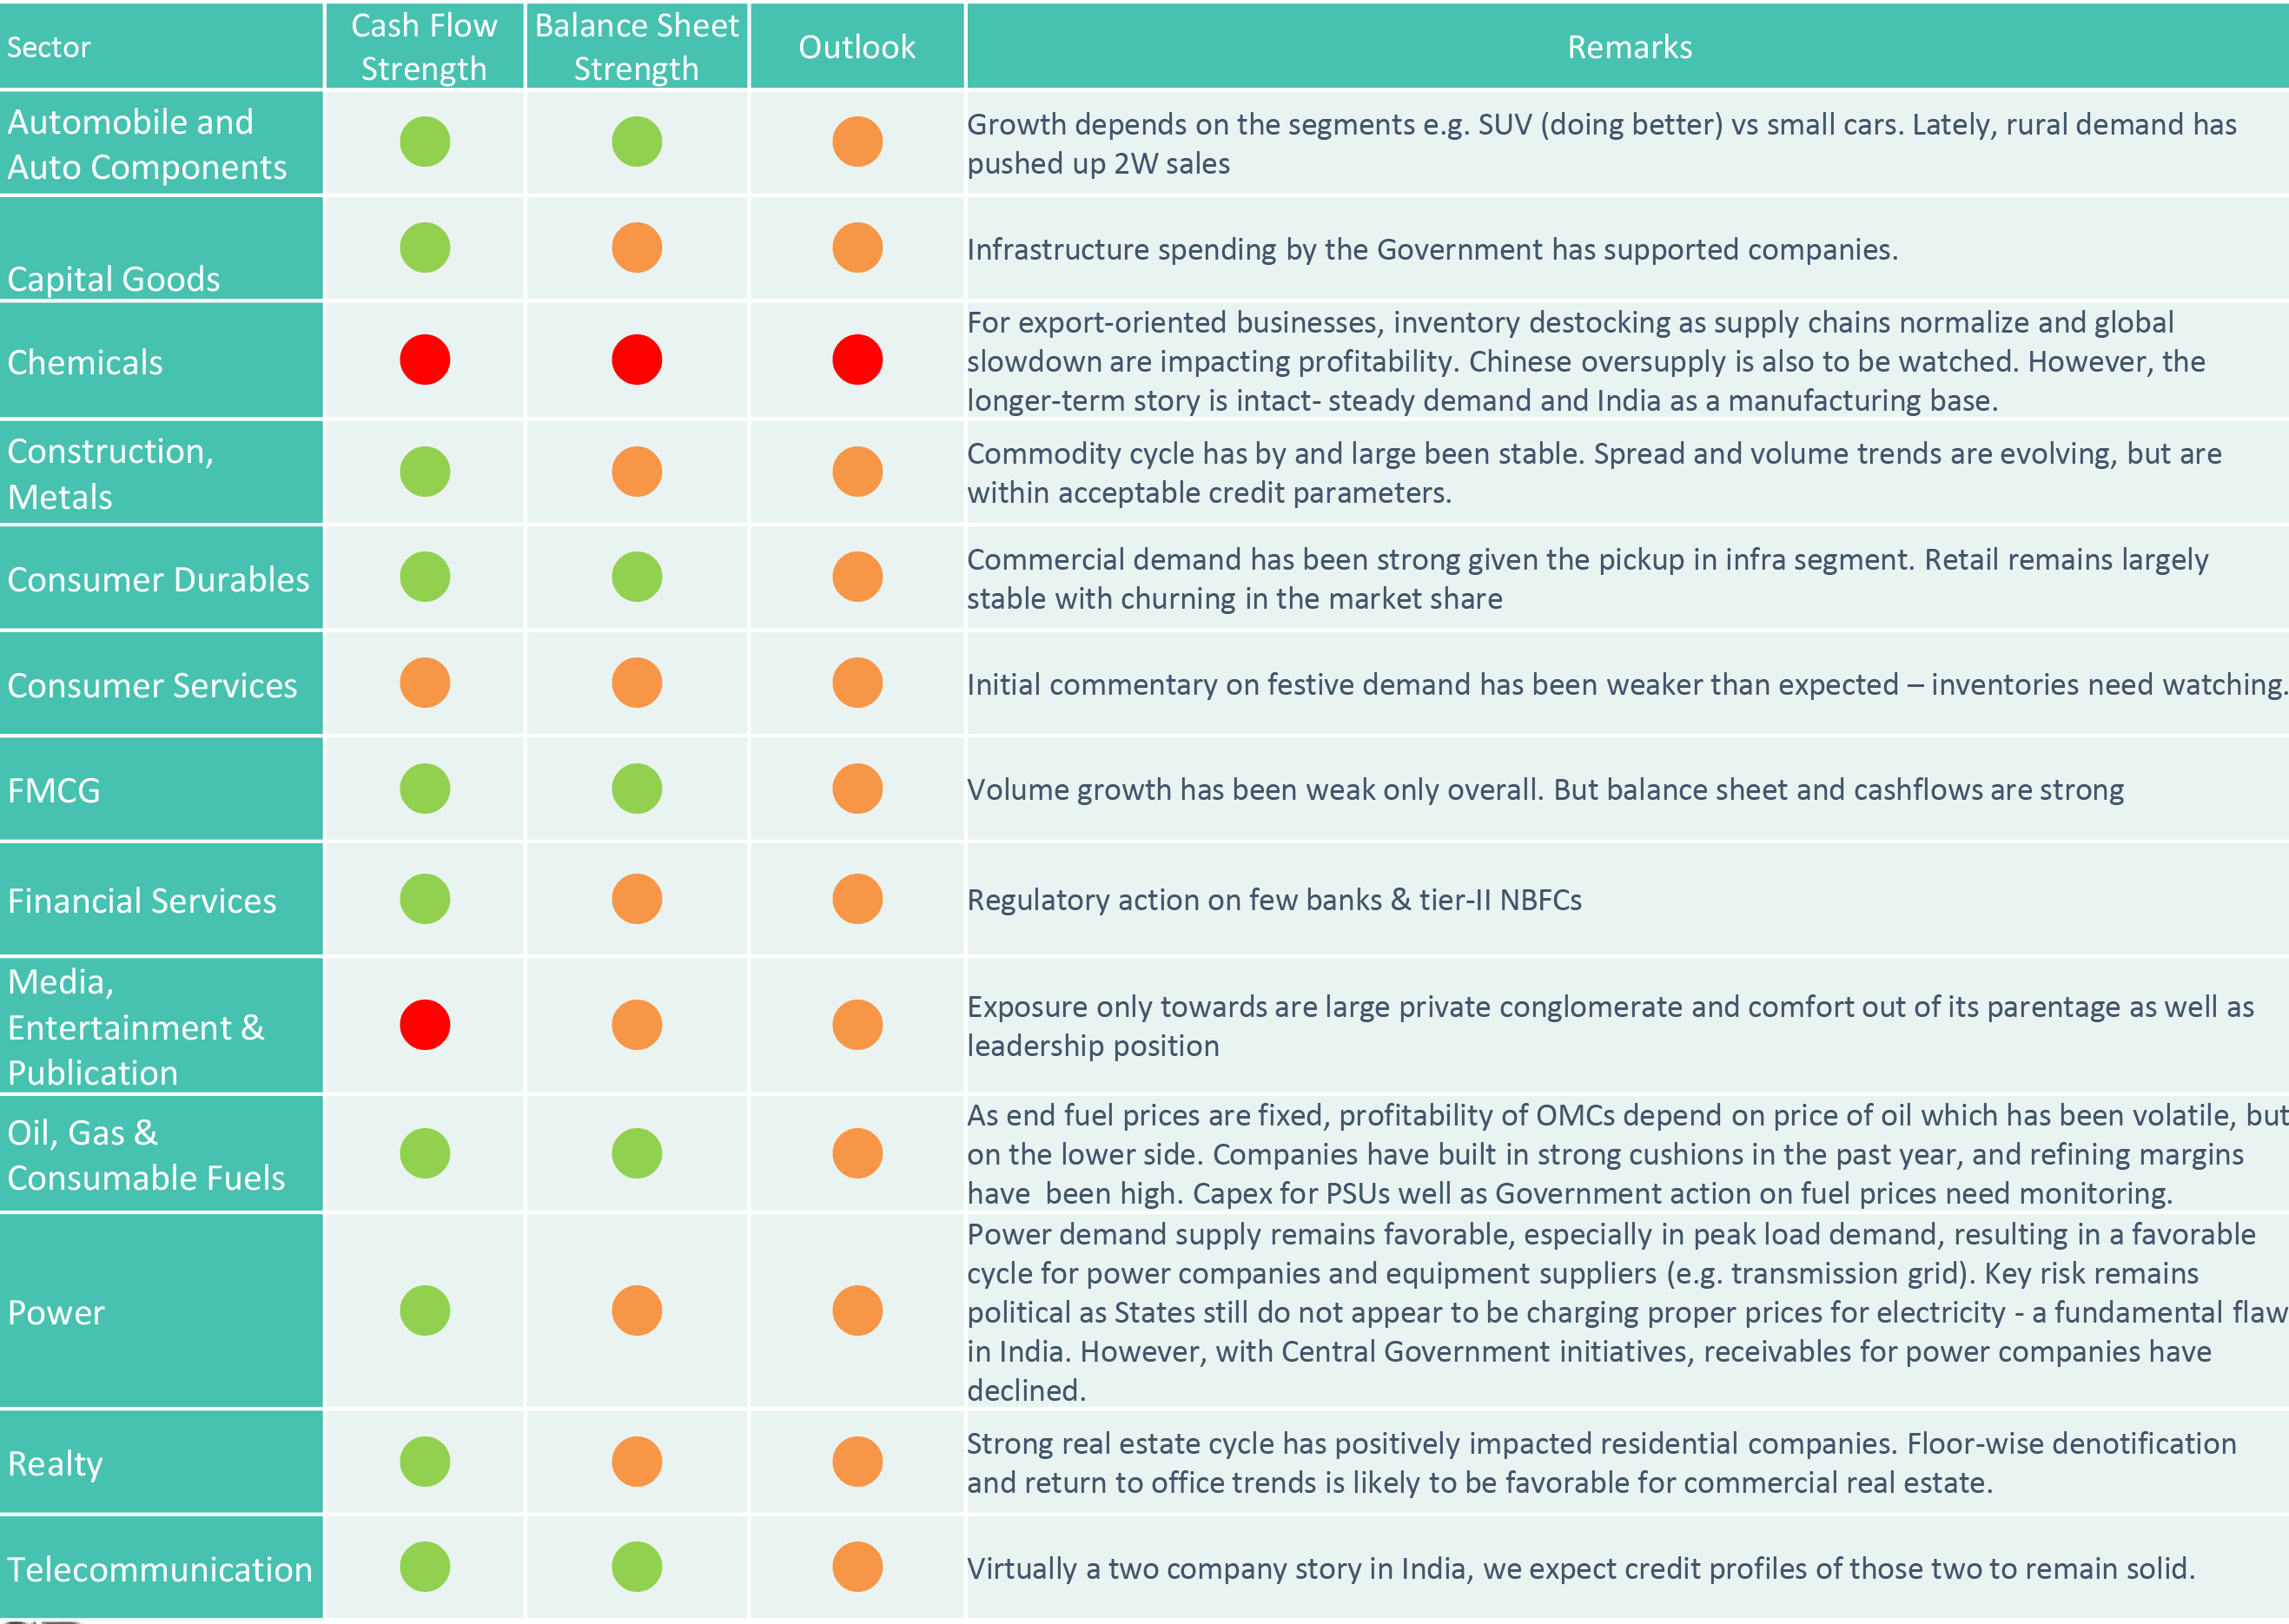
DSP Credit view on sectors
Done with our market view framework?
Now
Our Portfolio creation framework
DSP Portfolio Creation: Multi-step process
DSP Fixed Income Funds follow a defined methodology for fund portfolio construction
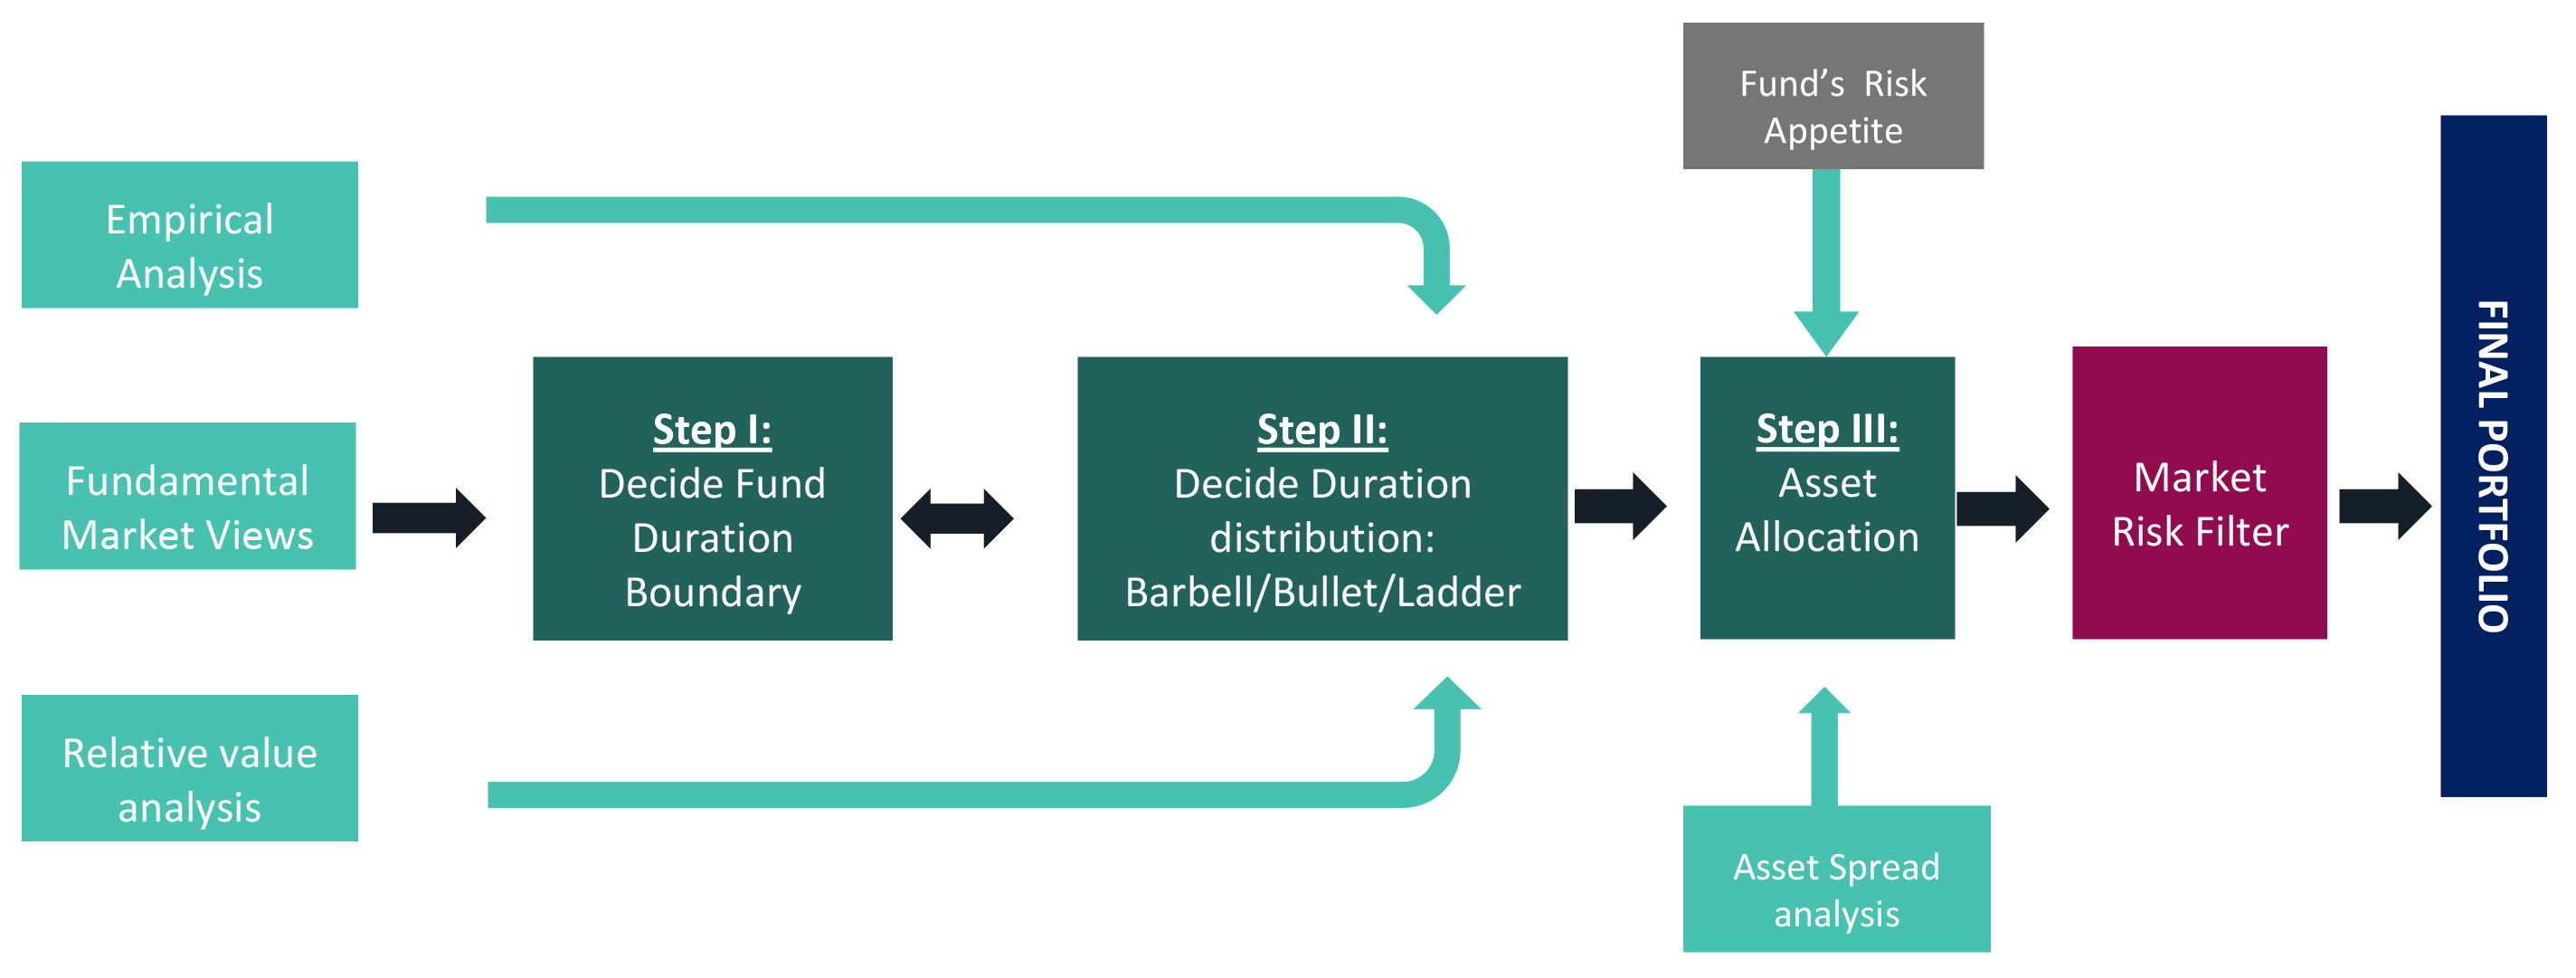
- We apply market risk filter which can help the Fund Managers not to take extreme risks. Thus, Value at Risk is limited by ensuring the positions are balanced.
Investment approach / framework/ strategy mentioned herein is currently followed & same may change in future depending on market conditions & other factors.
Key Risks associated with investing in Fixed Income Schemes
Interest Rate Risk - When interest rates rise, bond prices fall, meaning the bonds you hold lose value. Interest rate movements are the major cause of price volatility in bond markets.
Credit risk - If you invest in corporate bonds, you take on credit risk in addition to interest rate risk. Credit risk is the possibility that an issuer could default on its debt obligation. If this happens, the investor may not receive the full value of their principal investment.
Market Liquidity risk - - Liquidity risk is the chance that an investor might want to sell a fixed income asset, but they’re unable to find a buyer.
Re-investment Risk - If the bonds are callable, the bond issuer reserves the right to “call” the bond before maturity and pay off the debt. That can lead to reinvestment risk especially in a falling interest rate scenario.
Rating Migration Risk - - If the credit rating agencies lower their ratings on a bond, the price of those bonds will fall.
Other Risks
Risk associated with
- floating rate securities
- derivatives
- transaction in units through stock exchange Mechanism
- investments in Securitized Assets
- Overseas Investments
- Real Estate Investment Trust (REIT) and Infrastructure Investment Trust (InvIT)
- investments in repo of corporate debt securities
- Imperfect Hedging using Interest Rate Futures
- investments in Perpetual Debt Instrument (PDI)
 Account Statement
  Capital Gain Statement
  Key Information Memorandum
  PAN Updation
  Register / Modify KYC Online
  Nominee Registration
  Email / Phone Updation
  OTM / eNACH Registration
  Guidelines for Incapacitated Investors
  FAQs
FAQs Reach us


