DSP Converse March 2024
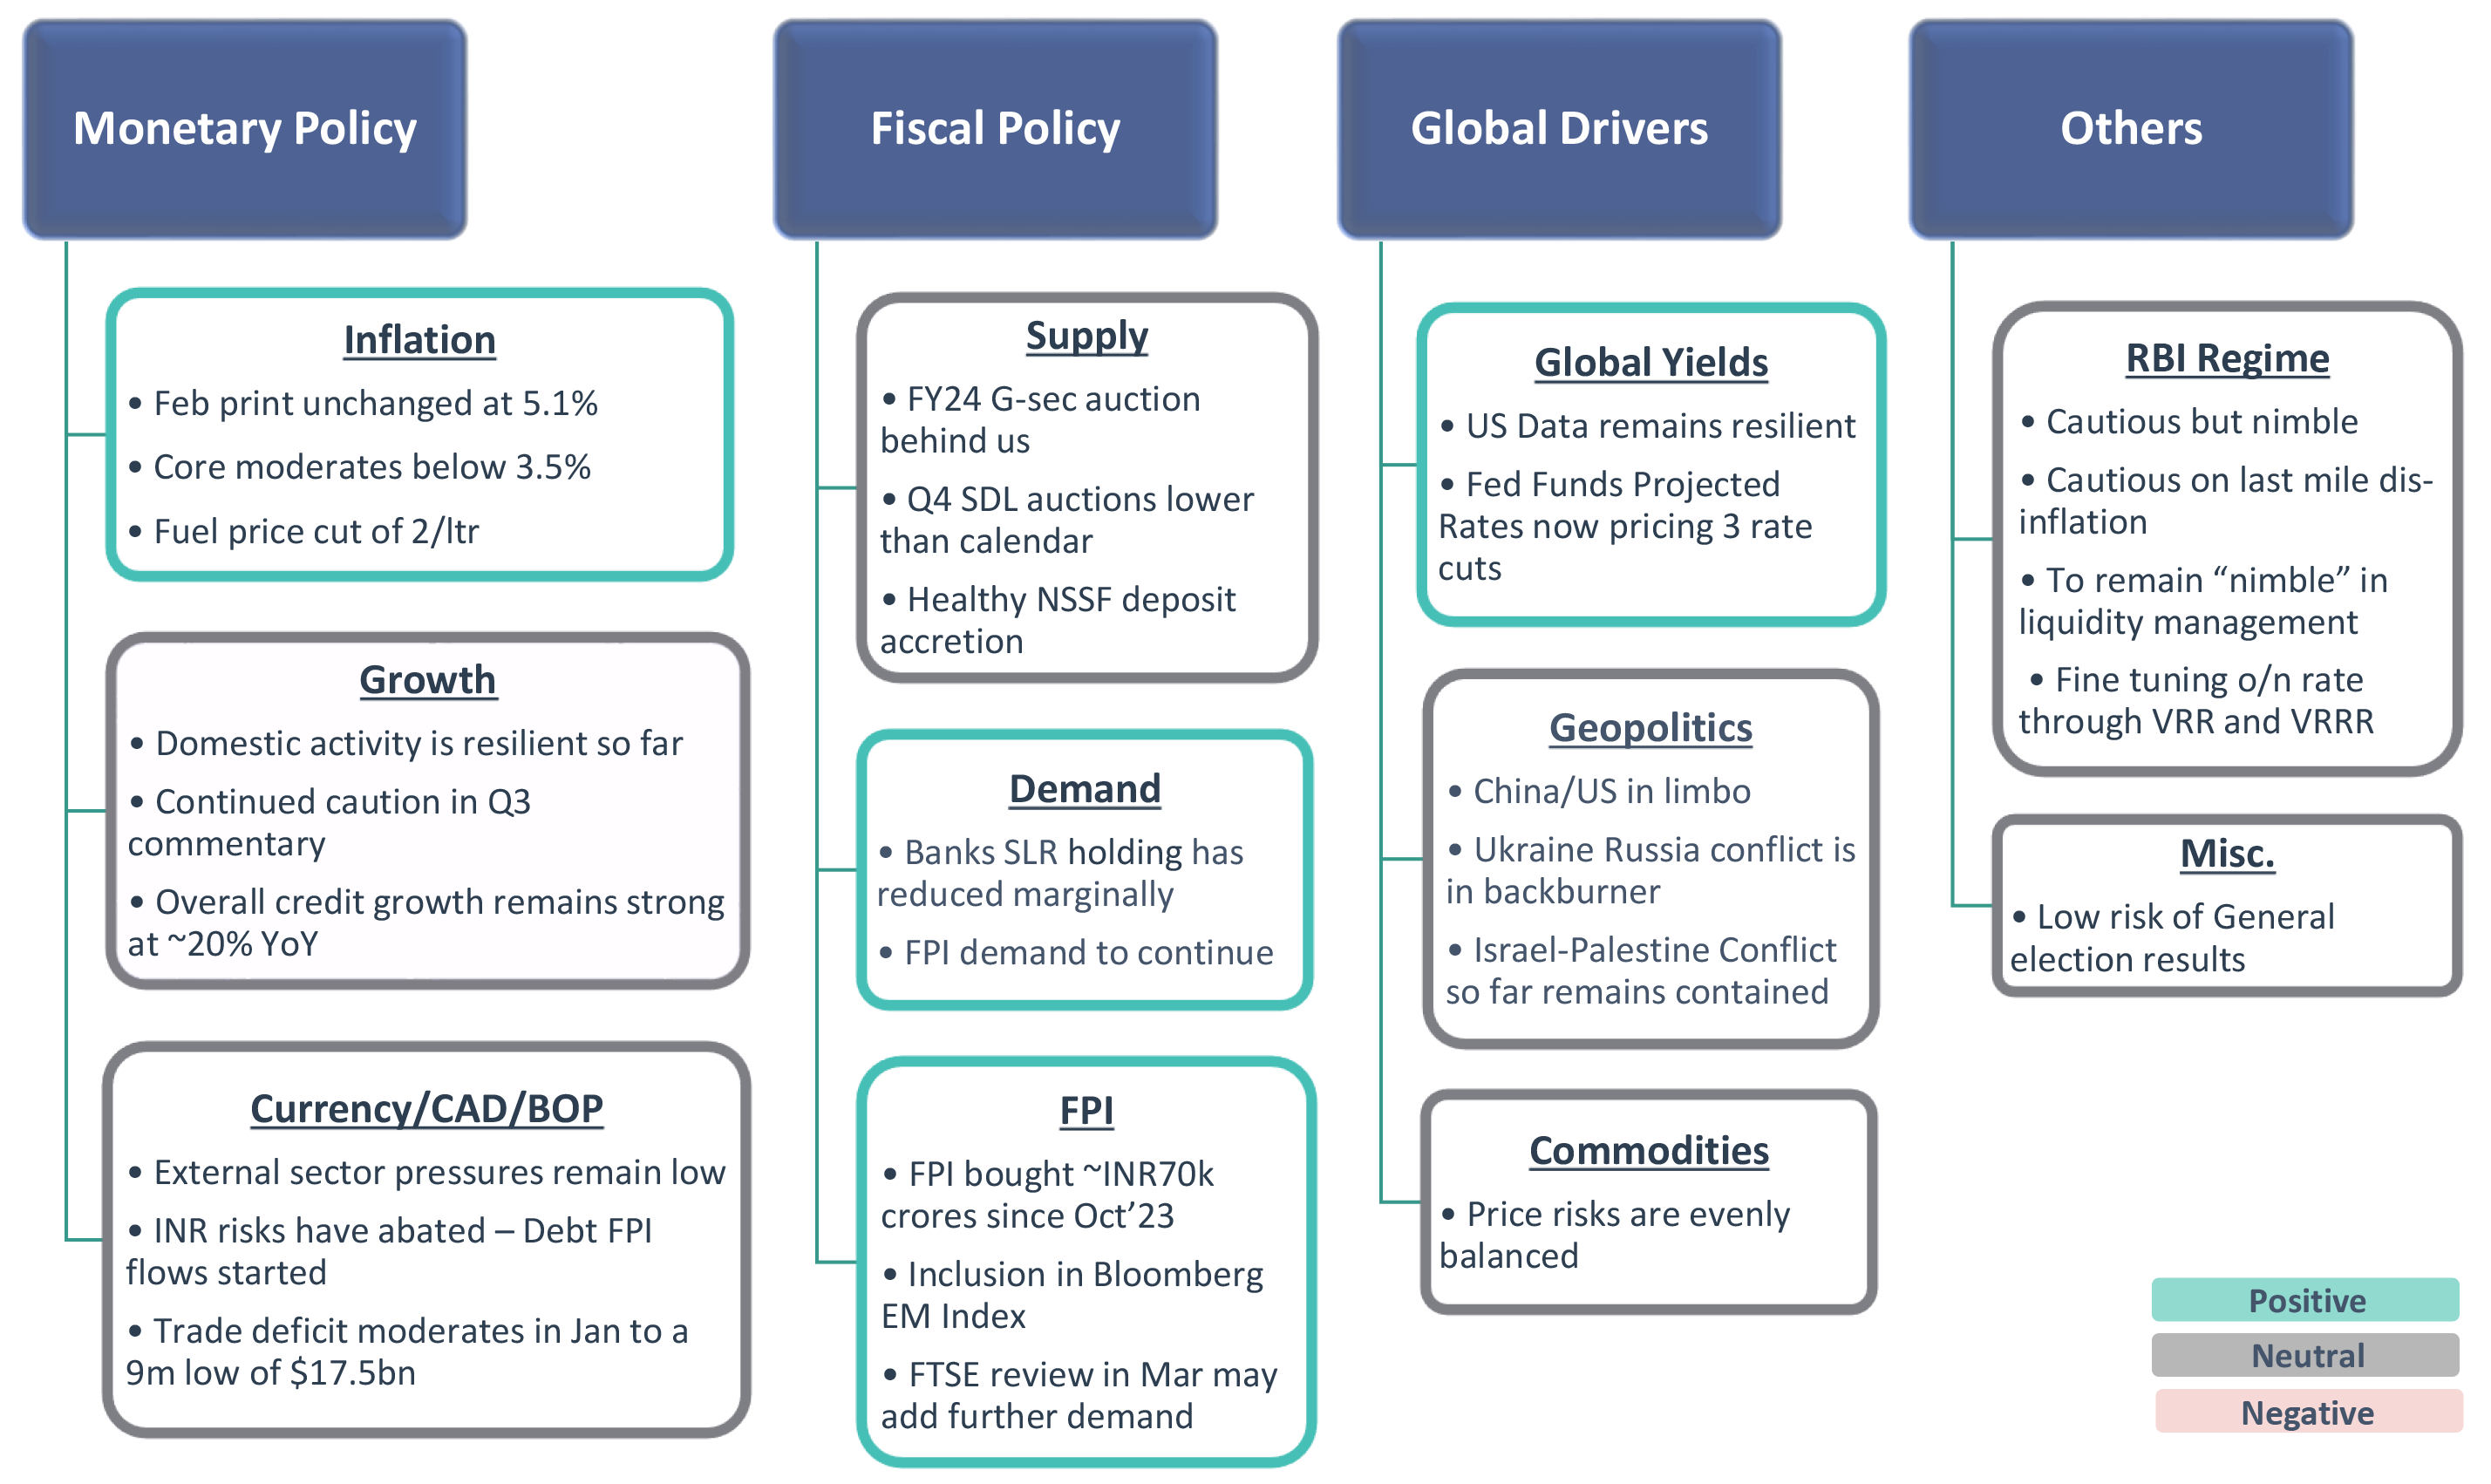
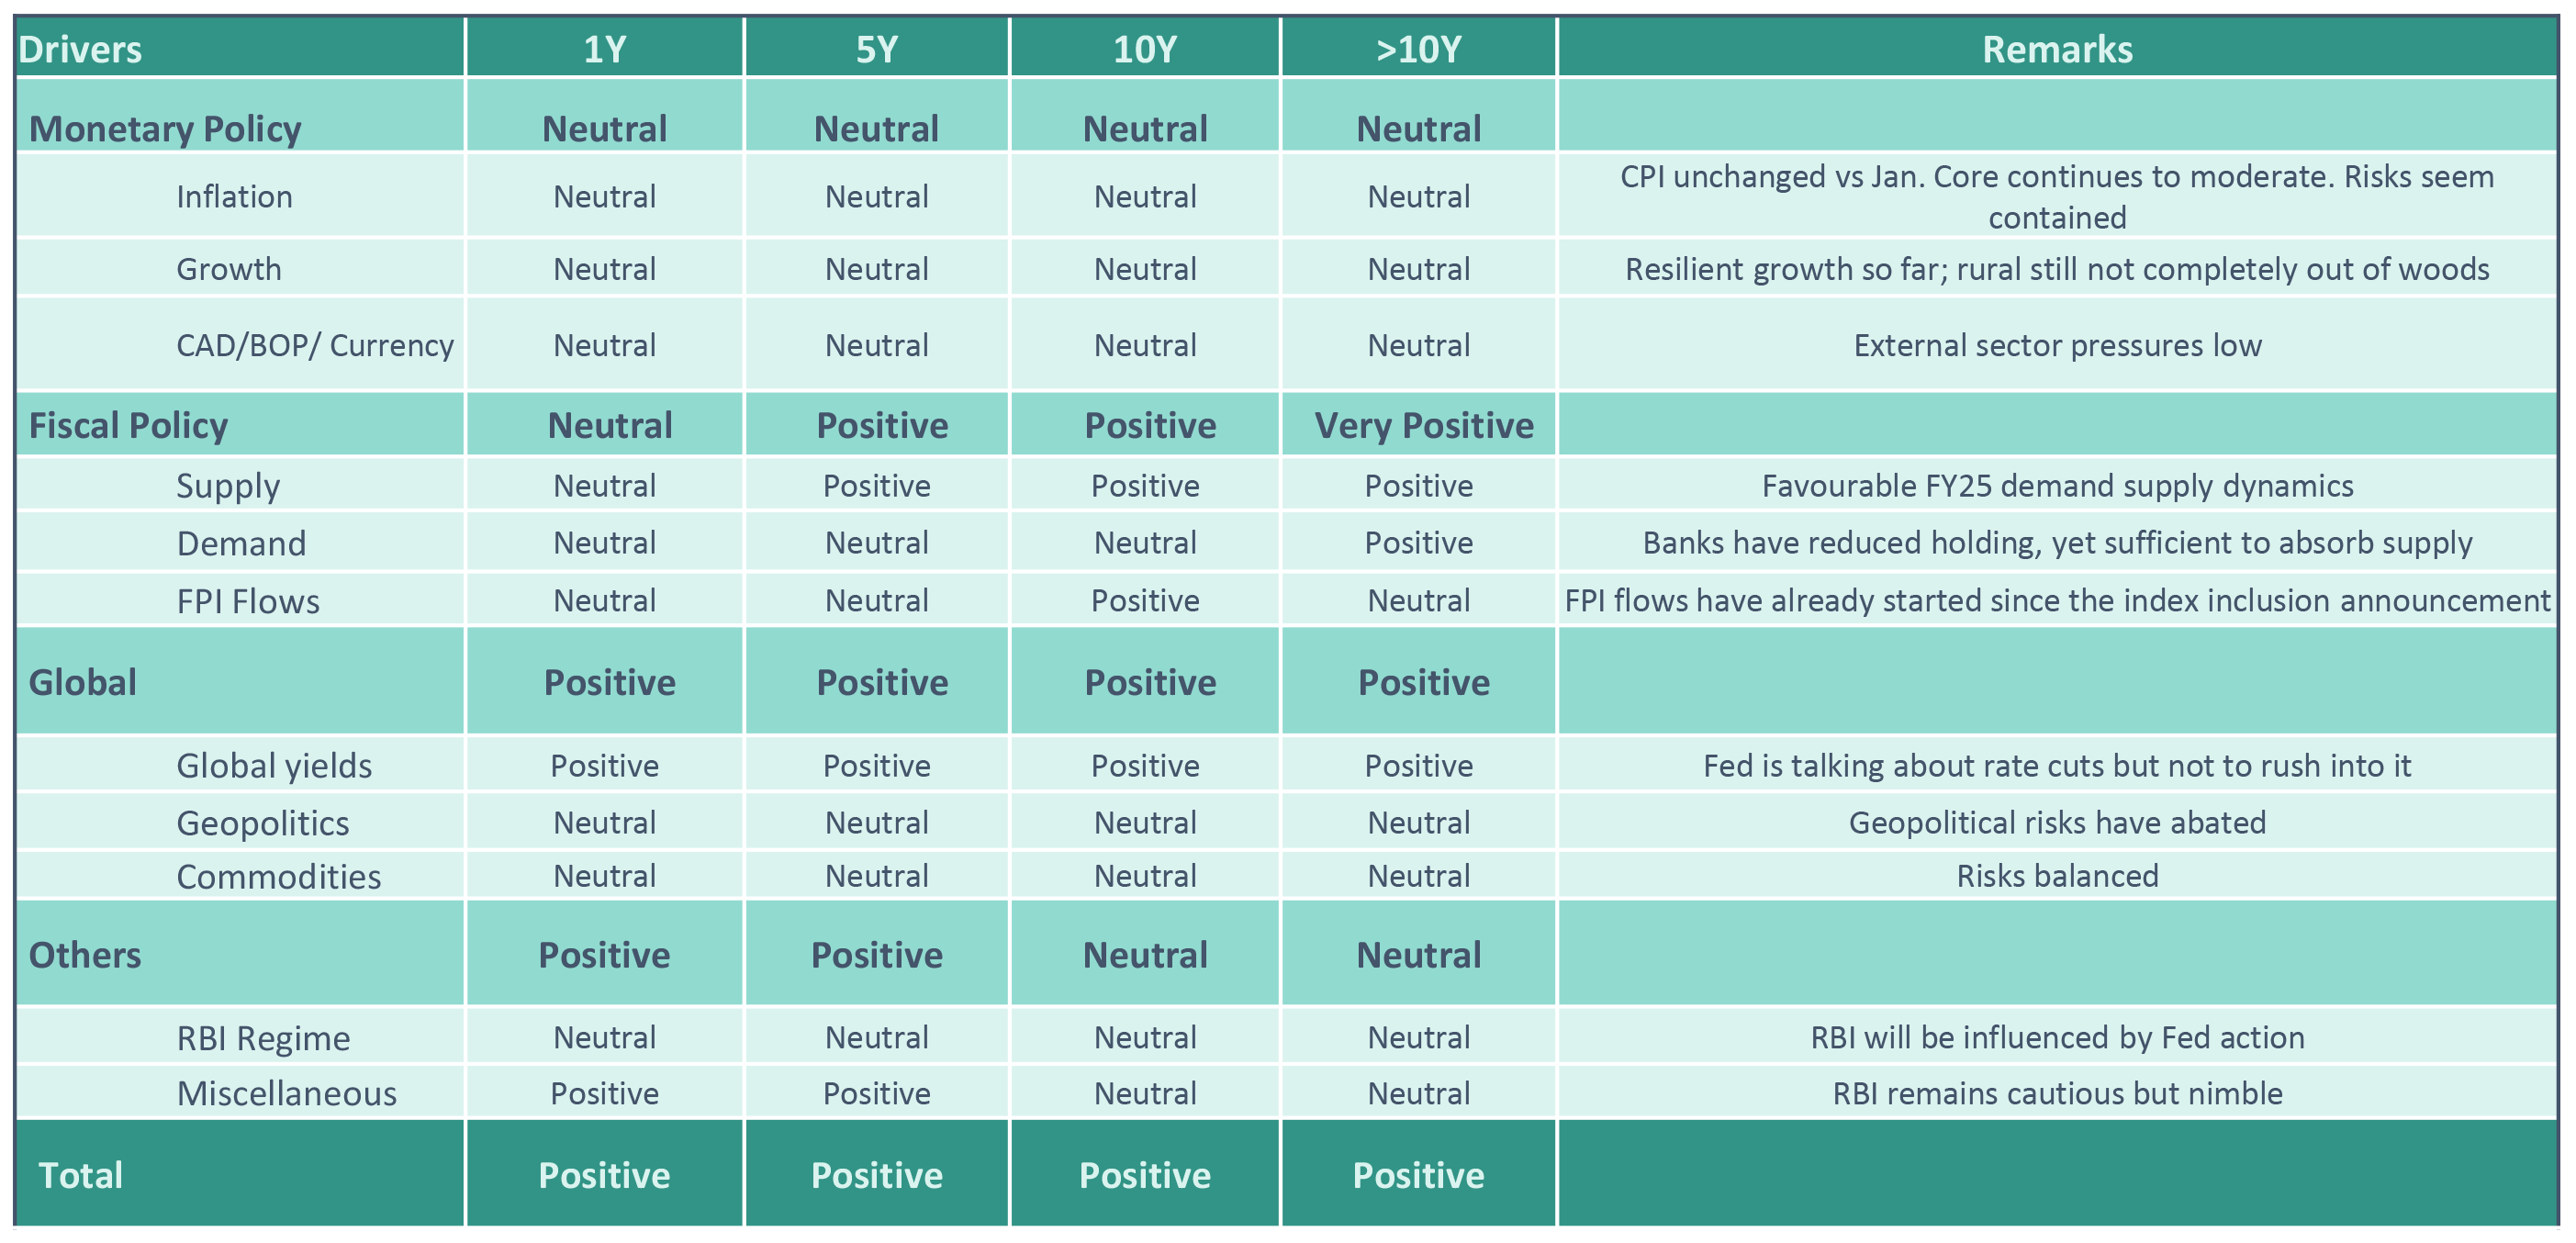
Our Framework
Takeaway:
Domestic environment steady, US pricing of rate cut expectations to drive bond yields
CAD – Current Account Deficit; BoP – Balance of Payment; SLR – Statutory Liquidity Ratio; SDL – State Development Loans; RBI: Reserve Bank of India; G-Sec: Government Securities; FPI: Foreign Portfolio Investment; NSSF: National Small Savings Fund; VRR: Variable Repo Rate; VRRR: Variable Reverse Repo Rate; o/n: Overnight
Be Long! Why?
Domestic macros supportive of lower yields
However, globally data resilient and rate cuts priced in
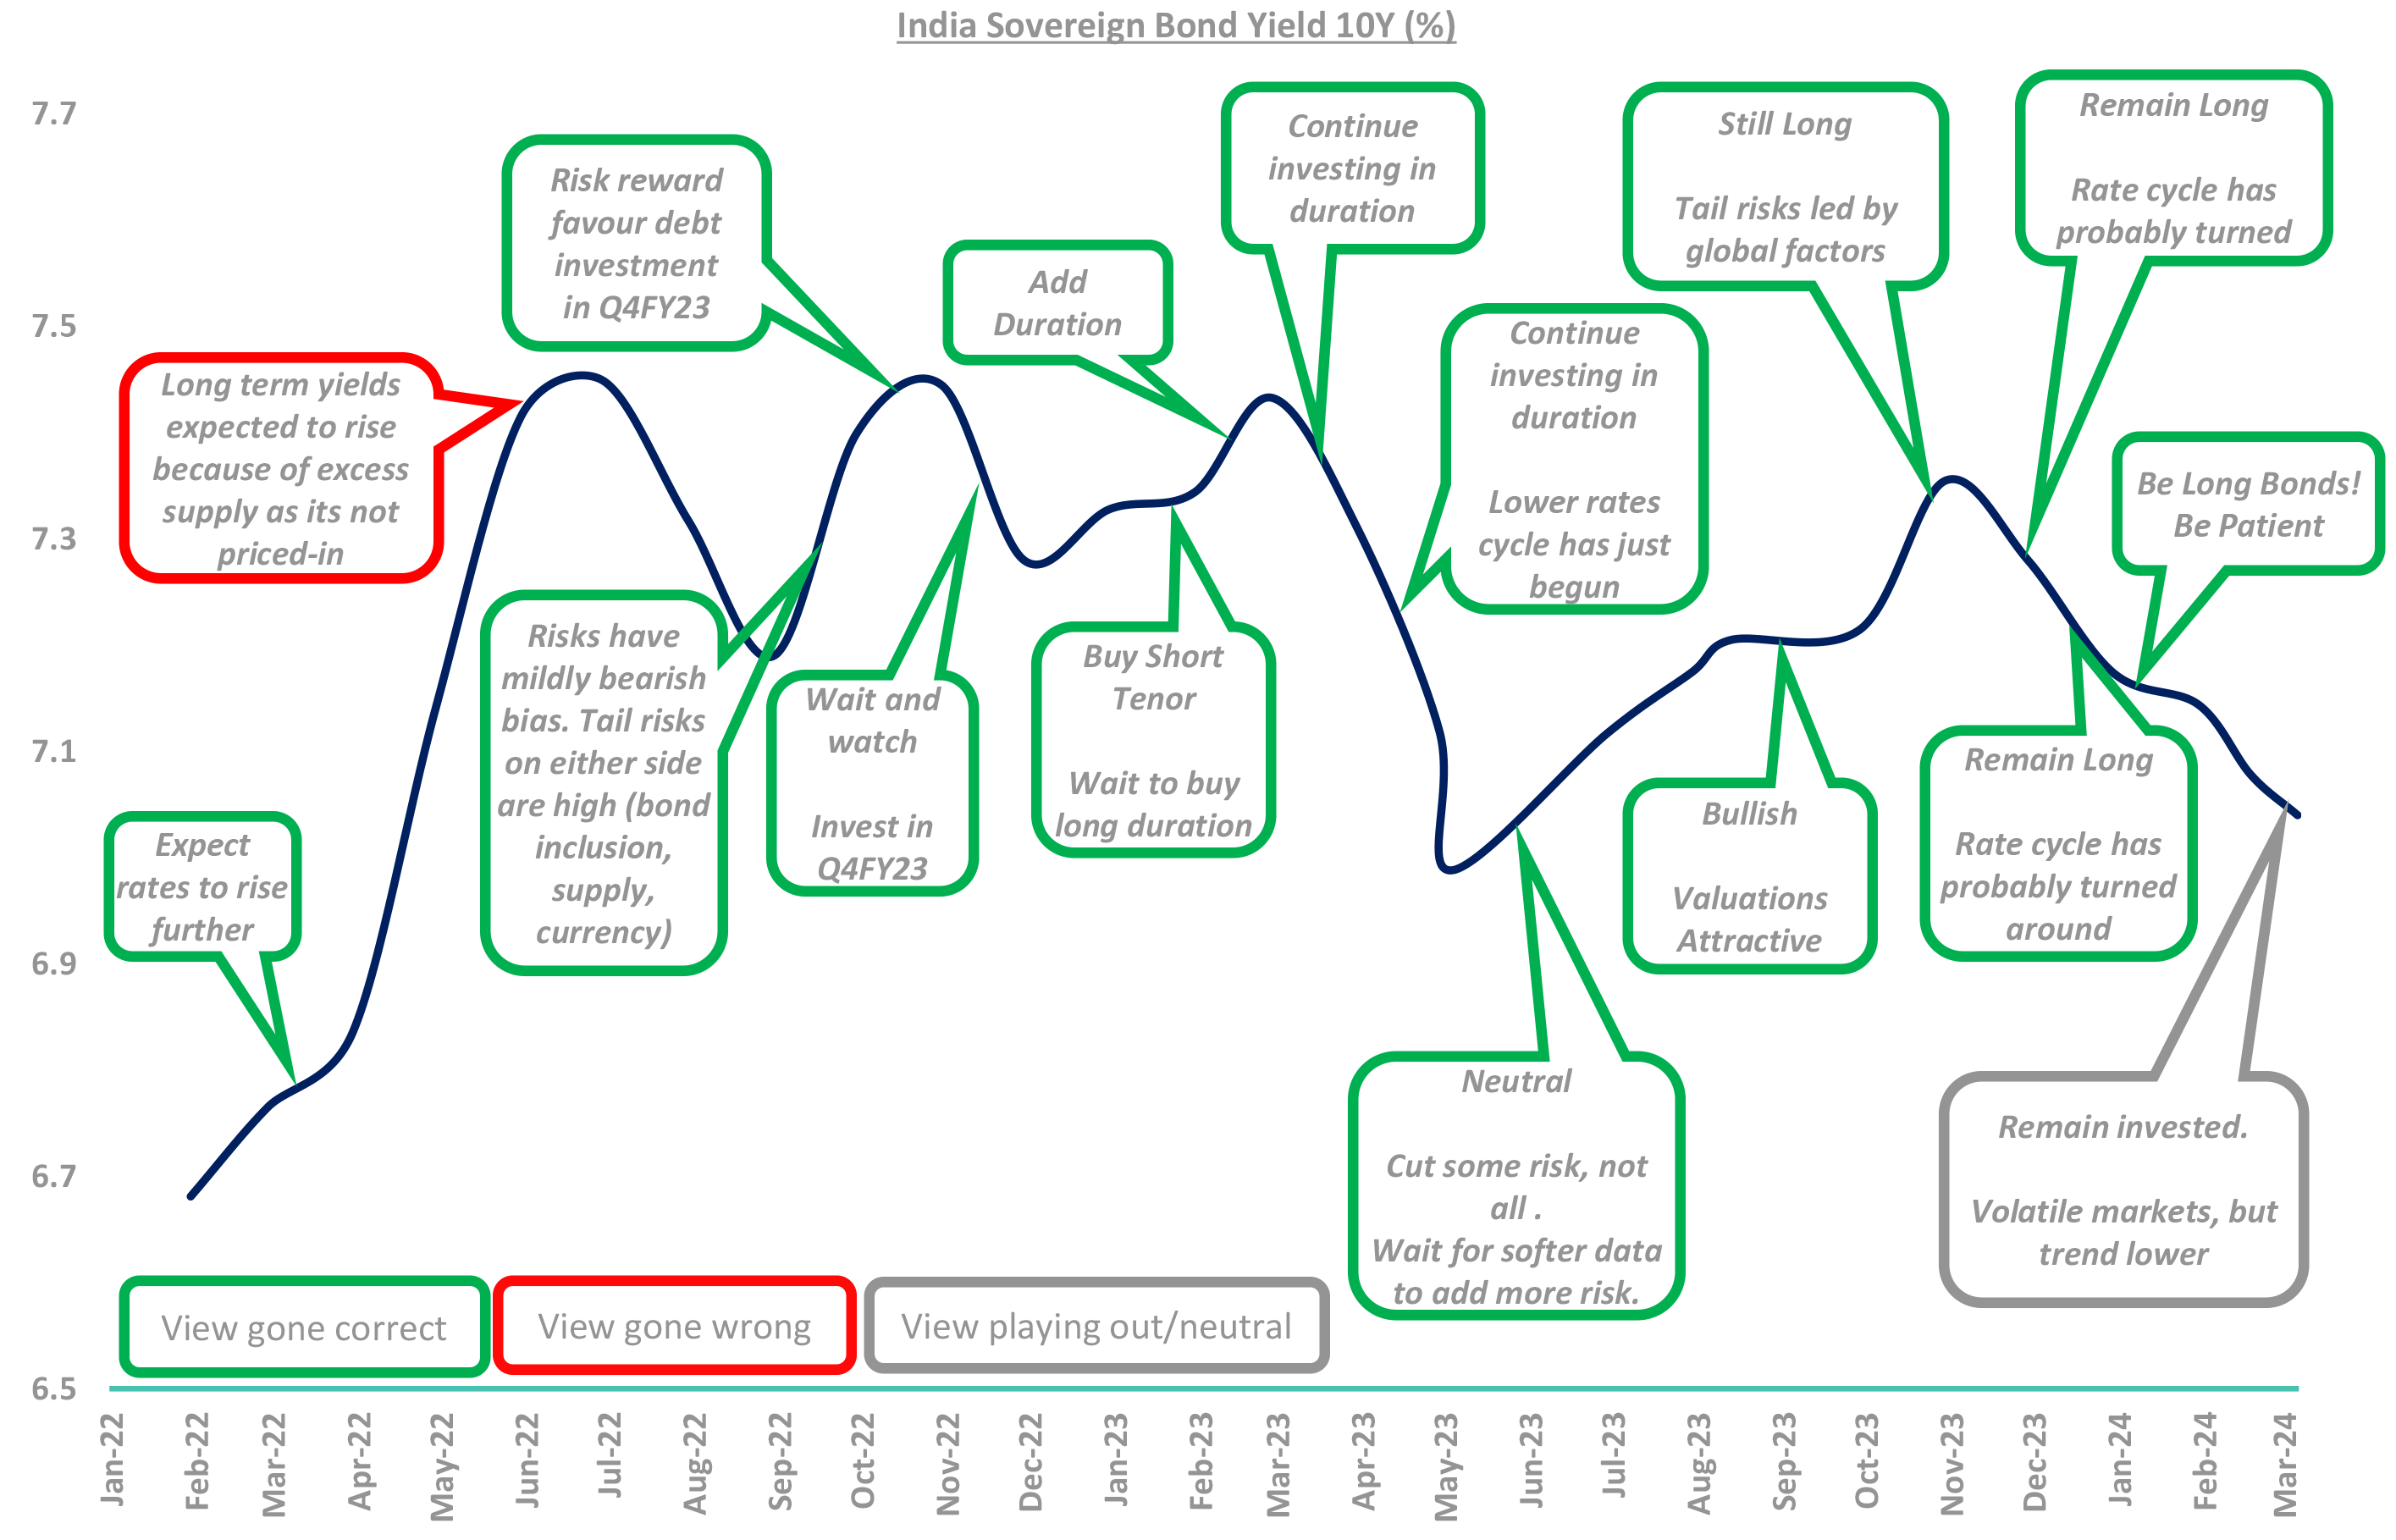
Let’s revisit our rates call trajectory
Source – Bloomberg, Internal
To start with,
Recap of events since last DSP CONVERSE release.
RBI Policy
US Fed removes reference to “additional policy firming” but needs “greater confidence” to cut
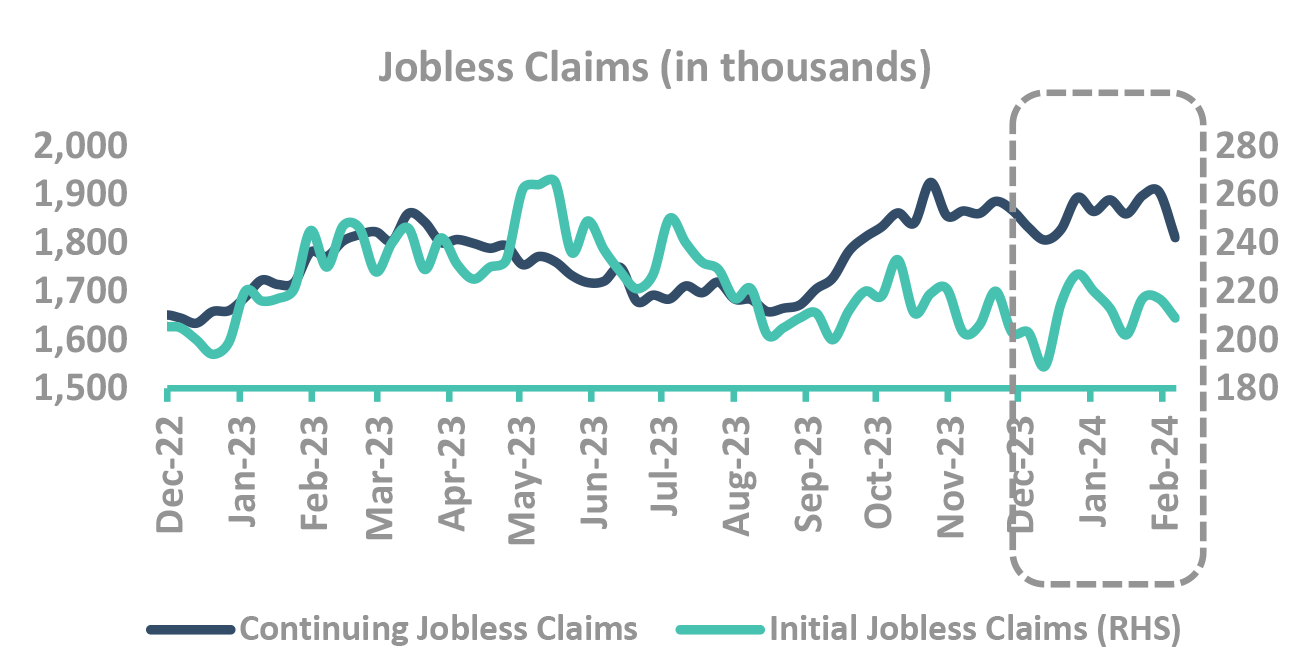
US Data showing resilience
RBI’s maintains status quo
REPO rate unchanged at 6.5%
-
Stance retained at “focused on withdrawal of accommodation”
- ✓ By a majority of 5 out of 6 members
-
Inflation Projections unchanged for FY24 and lower by 20bps for Q4
- ✓ Rabi sowing has surpassed last year’s level
- x Considerable uncertainty prevails on the food price outlook and crude oil prices, however, remain volatile
- x Remain vigilant to ensure that we successfully navigate the last mile of disinflation as 4.0% target yet to be reached
-
FY25 Real GDP projection at 7.0%. Revised up for Q1/Q2/Q3FY25
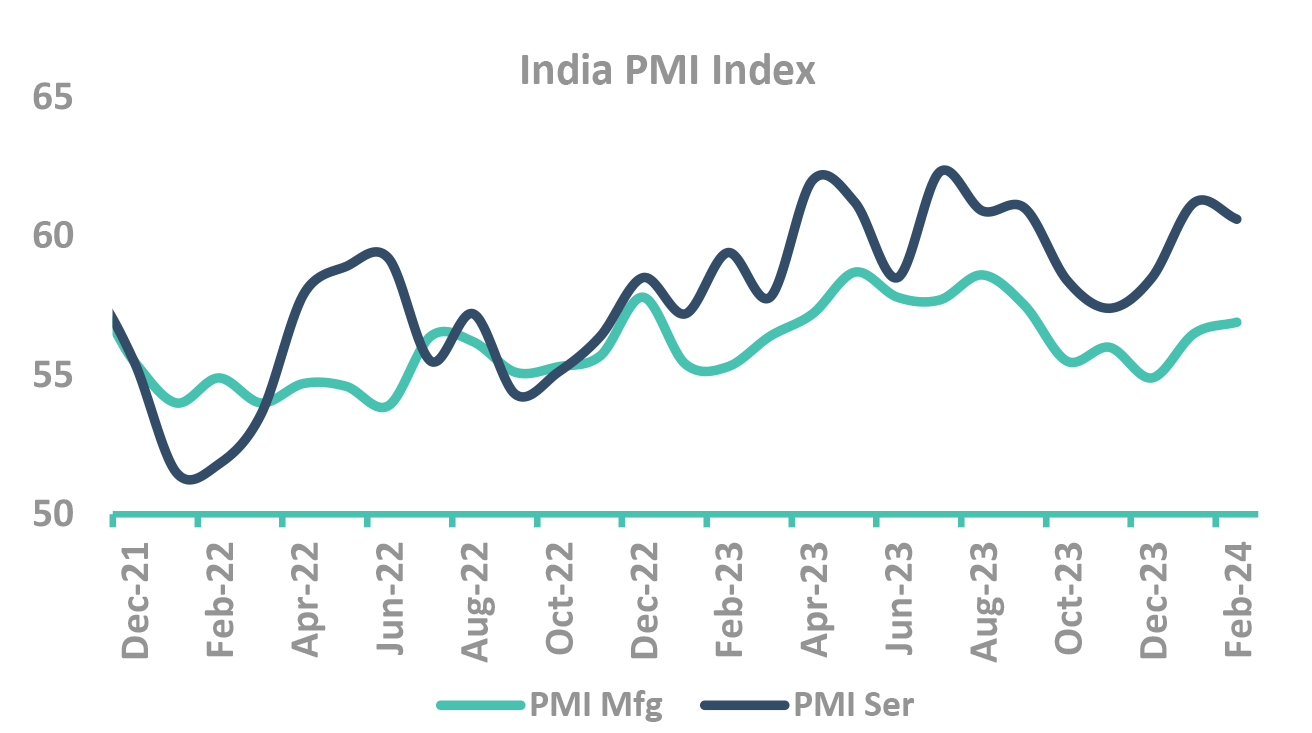
- ✓ Sustained profitability in manufacturing and underlying resilience of services to support growth
- ✓ Household consumption expected to improve and prospects of fixed investment remain bright
- x Headwinds from geopolitical tensions, geo-economic fragmentation and volatile financial markets
RBI: Reserve Bank of India; GDP: Gross Domestic Product
US data shows resilience and Fed not to rush into cutting rates
-
US Fed needs “greater confidence” to cut rates
- Economic activity expanding at solid pace vs concerns around slowdown in previous policy
- Removes reference to “additional policy firming”
- Raised the bar for a March cut
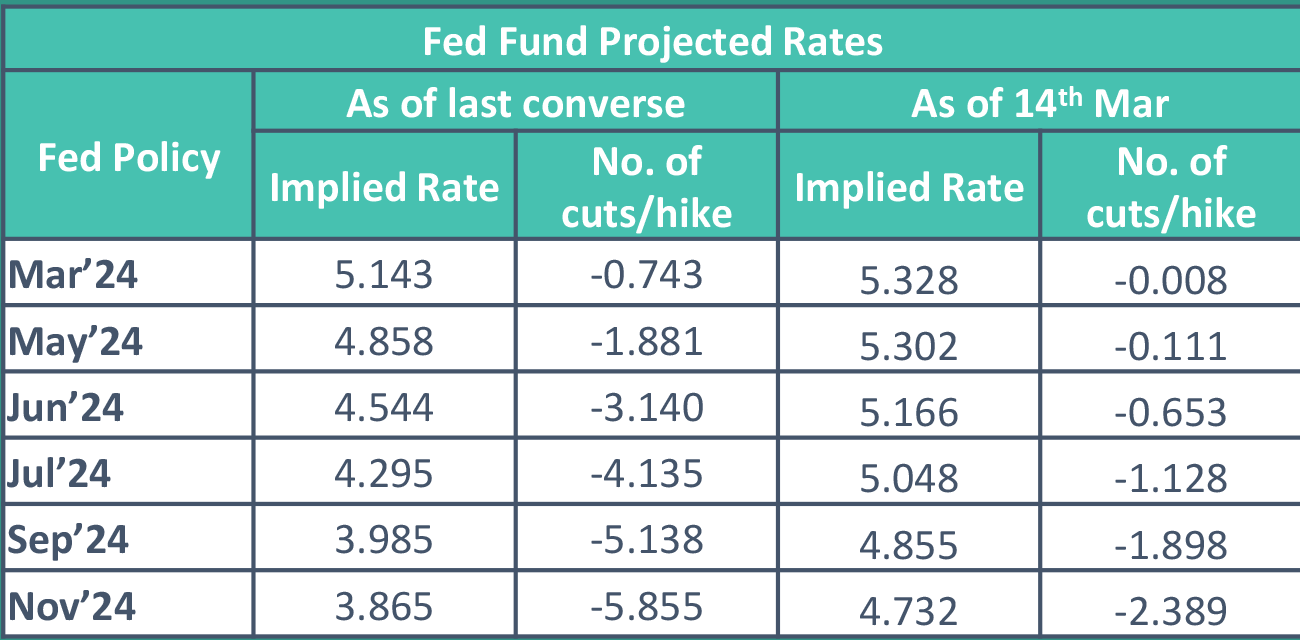
- Fed fund projected rates now pricing-in 3 rate cuts till Nov’24 vs 6 rate cuts during last converse
Takeaway:
Fed not to rush into cutting rates
Source – Bloomberg, Federal Reserve PCE: Personal Consumption Expenditure; FOMC: Federal Open Market Committee
Now our framework
And
What we track
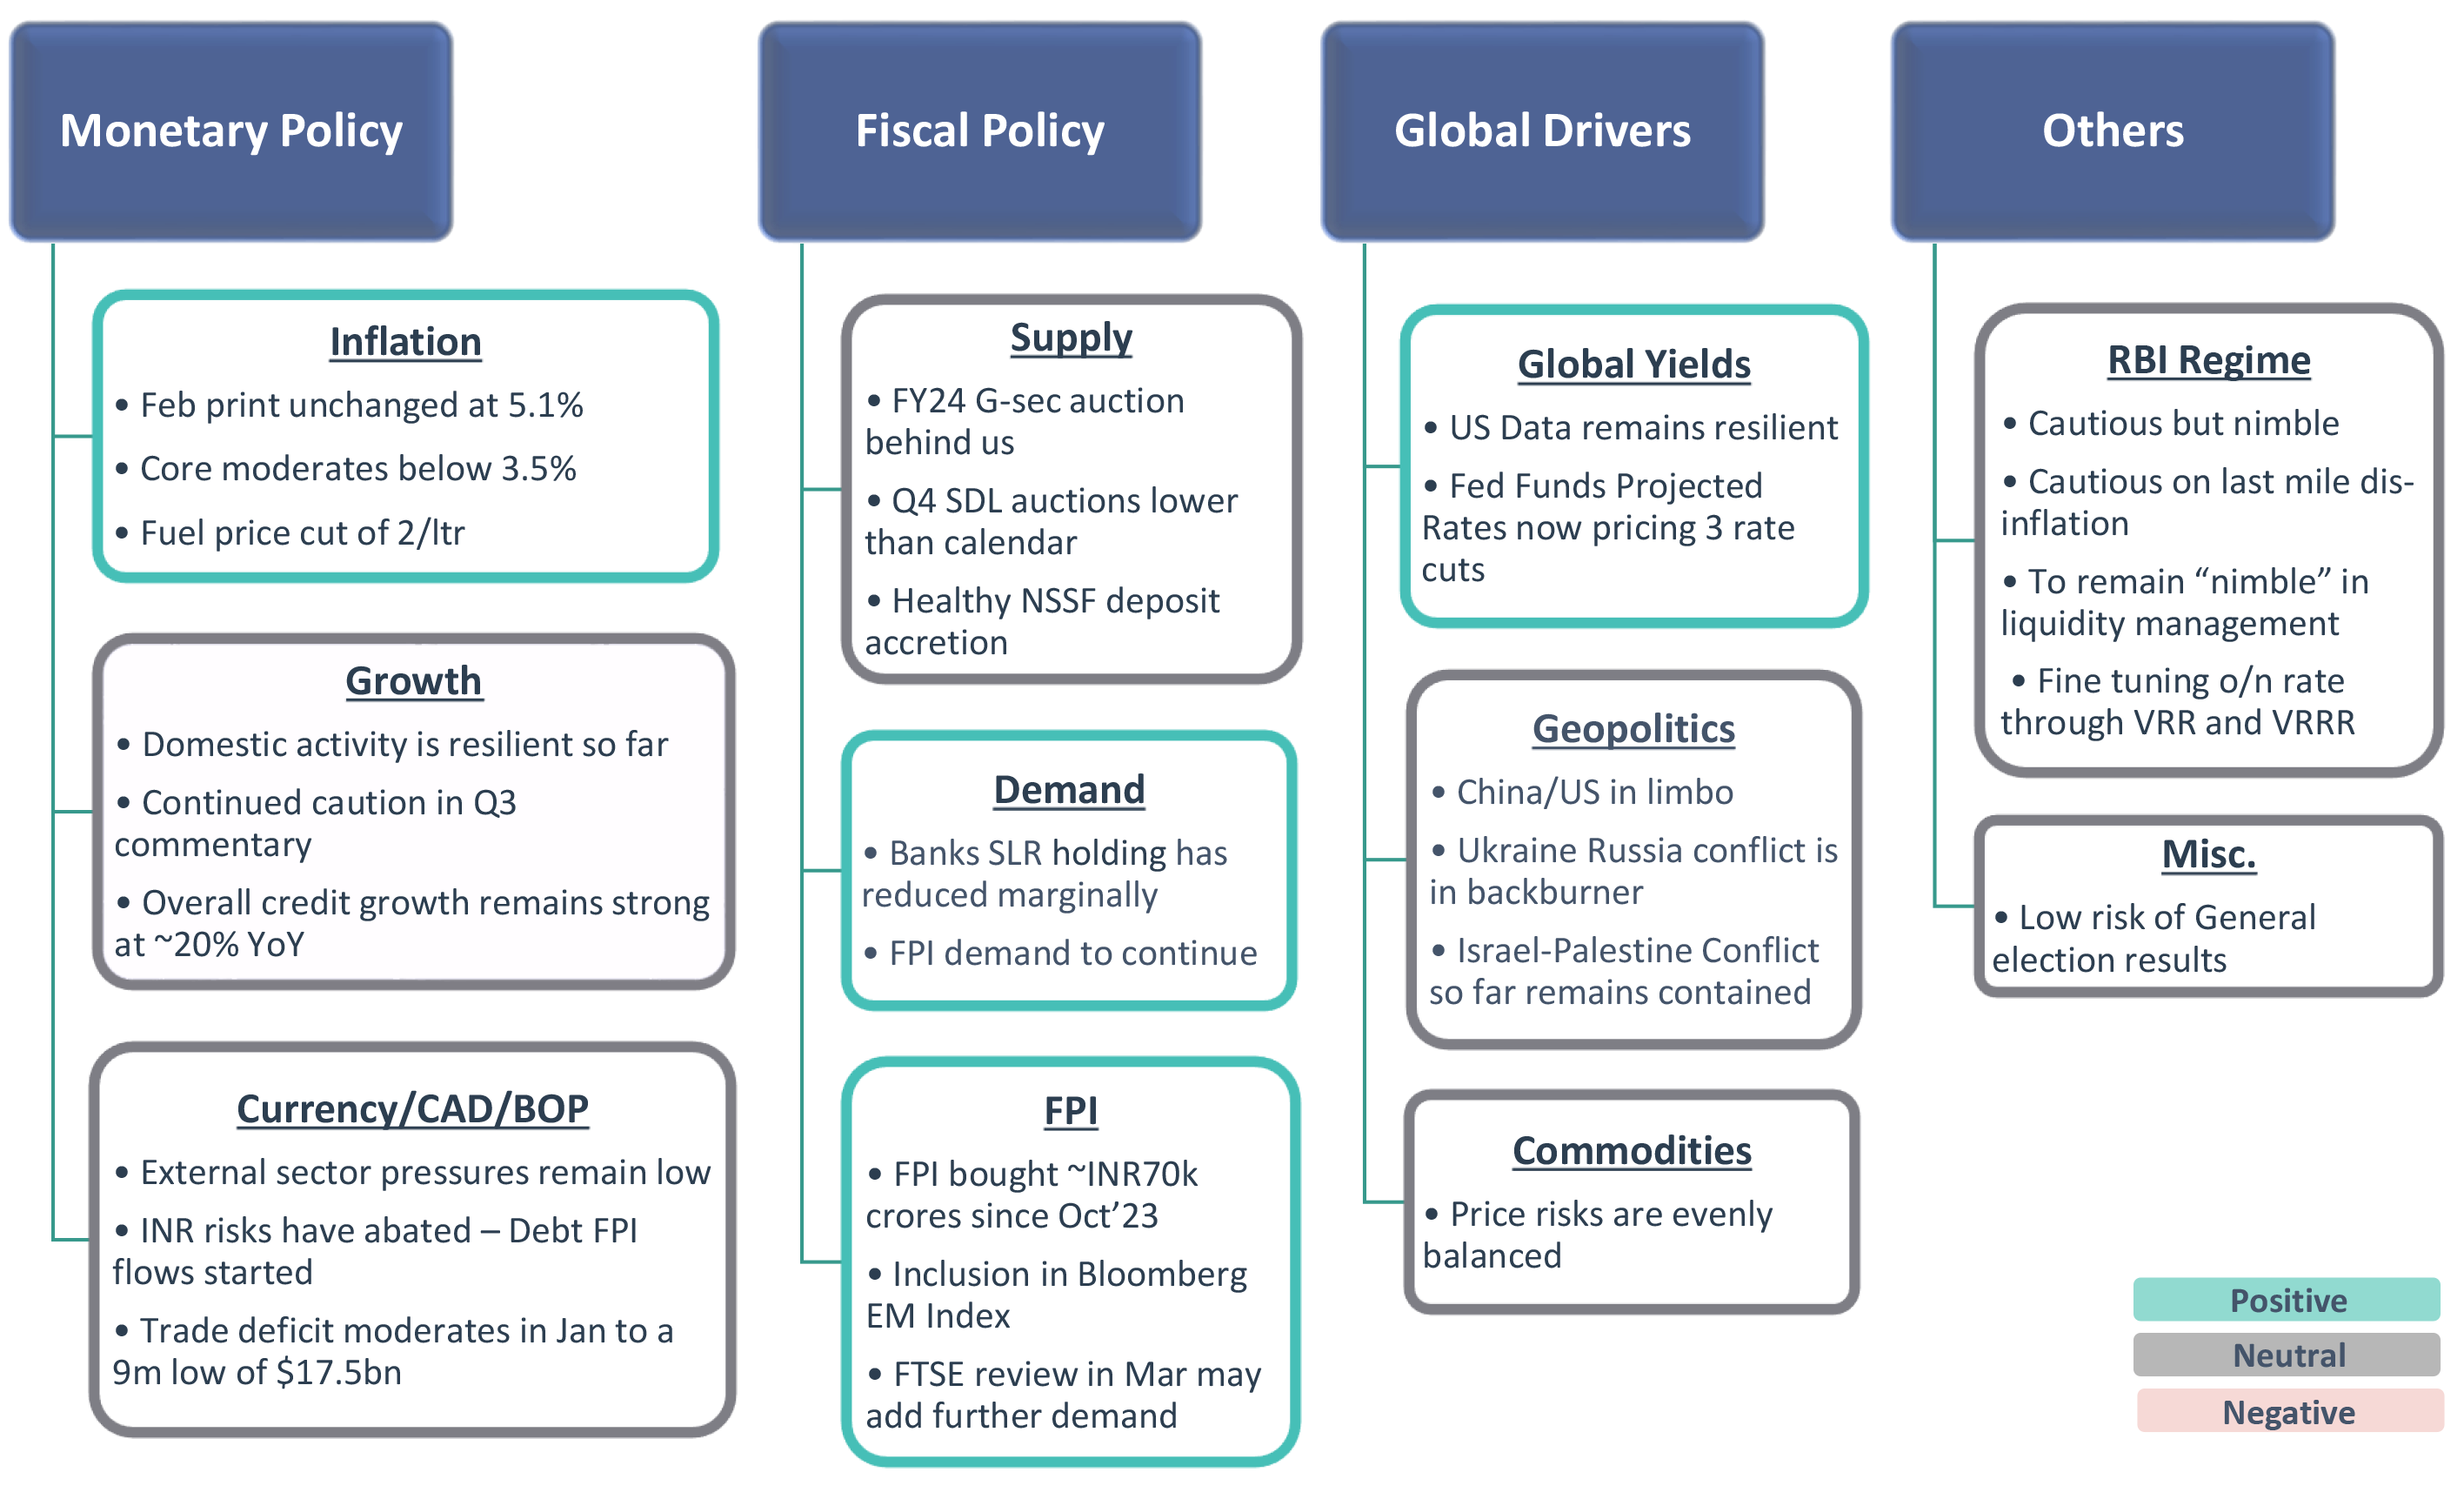
Our Framework
Takeaway:
Domestic environment steady, US pricing of rate cut expectations to drive bond yields
CAD – Current Account Deficit; BoP – Balance of Payment; SLR – Statutory Liquidity Ratio; SDL – State Development Loans; RBI: Reserve Bank of India; G-Sec: Government Securities; FPI: Foreign Portfolio Investment; NSSF: National Small Savings Fund; VRR: Variable Repo Rate; VRRR: Variable Reverse Repo Rate; o/n: Overnight
Resilient domestic economic activity
Expansion in urban demand while rural still not completely out of woods
Inflationary risks seem contained
RBI to be nimble in liquidity management
Core moderates further. Risks seem contained
-
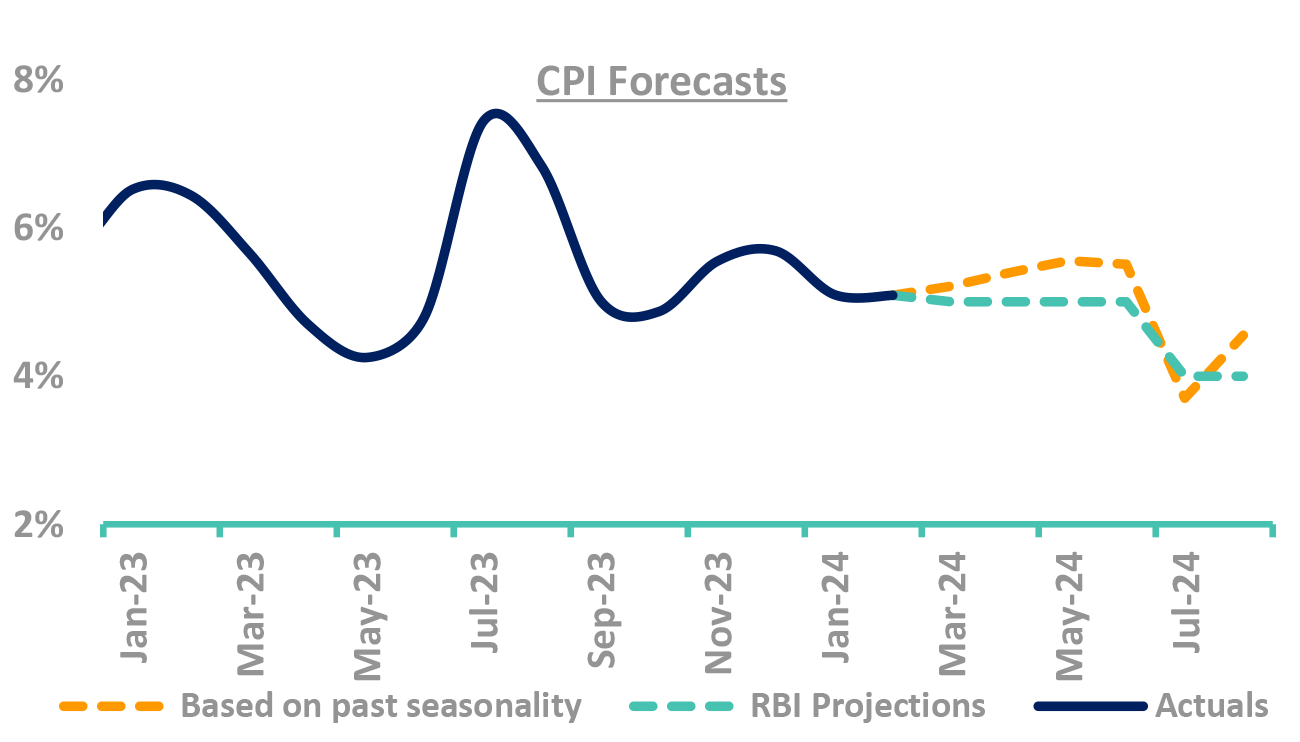
Do yields track inflation projection? No.
- Orange area (chart) is 10Y yields, Blue line is CPI
Can forecasters predict Indian CPI? No.
- Green line is forecasters CPI 1-Yr ahead prediction
- Blue line is where inflation actually came
- Guess the error of margin!
CPI forecast corelated (not causality) to yields
- Low predictive power, high current corelation
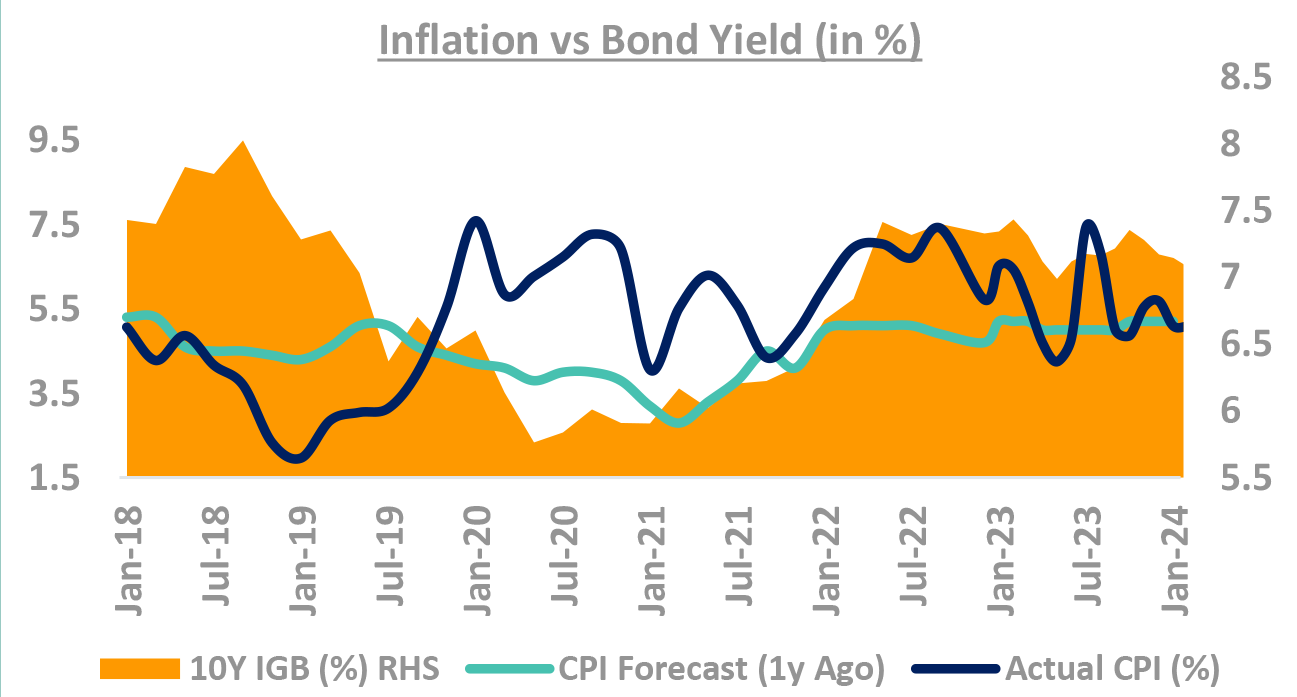
Takeaway:
Domestic inflation risks seem contained. Volatility in CPI has not impacted yields (especially in 2023)
Source – Bloomberg, RBI, Internal CPI: Consumer Price Inflation; RBI: Reserve Bank of India; IGB: India Government Bond
Domestic growth resilient so far: But watch out for trends
-
How closely do yields track growth?
- Yields have usually tracked GDP growth, with
correlation stronger when growth slows, barring
- ✓ 2013, rupee depreciation and debt outflows
- ✓ 2017, during demonetization
- Yields have usually tracked GDP growth, with
correlation stronger when growth slows, barring
FY24, growth may not be big driver for yields
- FY23 GDP growth at 7.2% -in line with RBI projections.
- Q3FY24 GDP Growth came in at 8.4%.
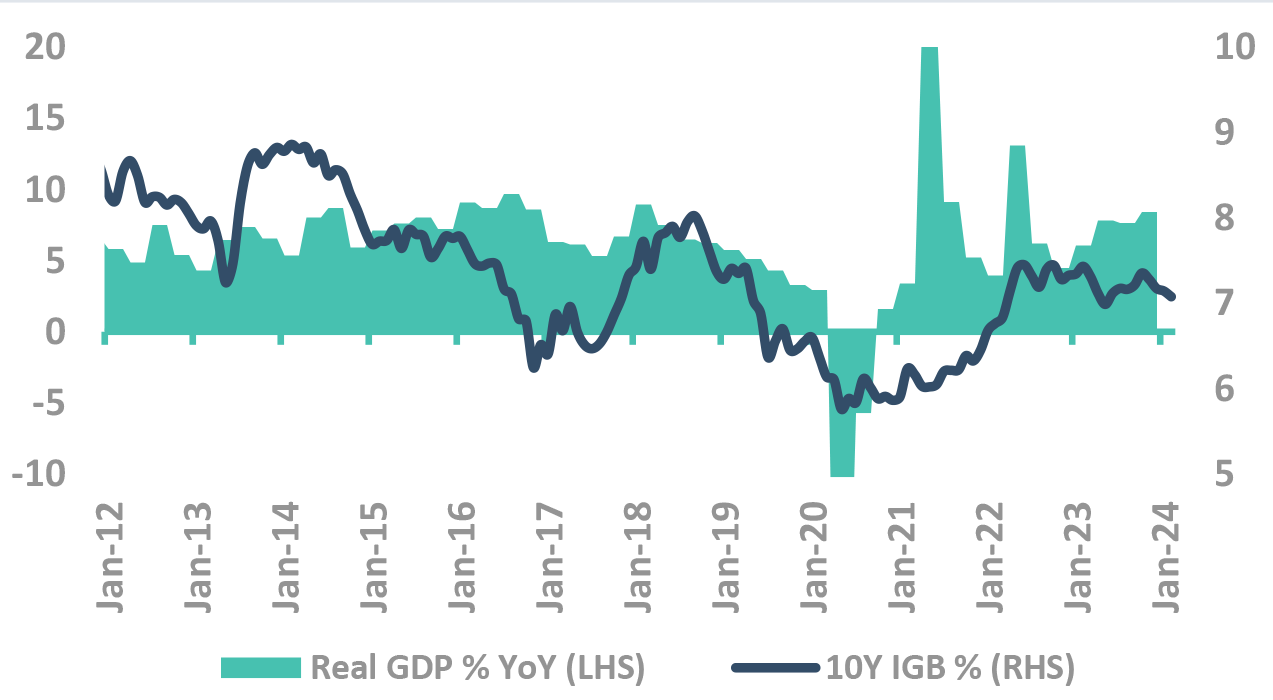
Takeaway:
Domestic growth seems to be resilient so far but watch out for emerging trends
Source – Bloomberg, PIB, Internal GDP: Gross Domestic Product; PMI: Purchasing Managers’ Index; GST: Goods and Service Tax; IGB: India Government Bond
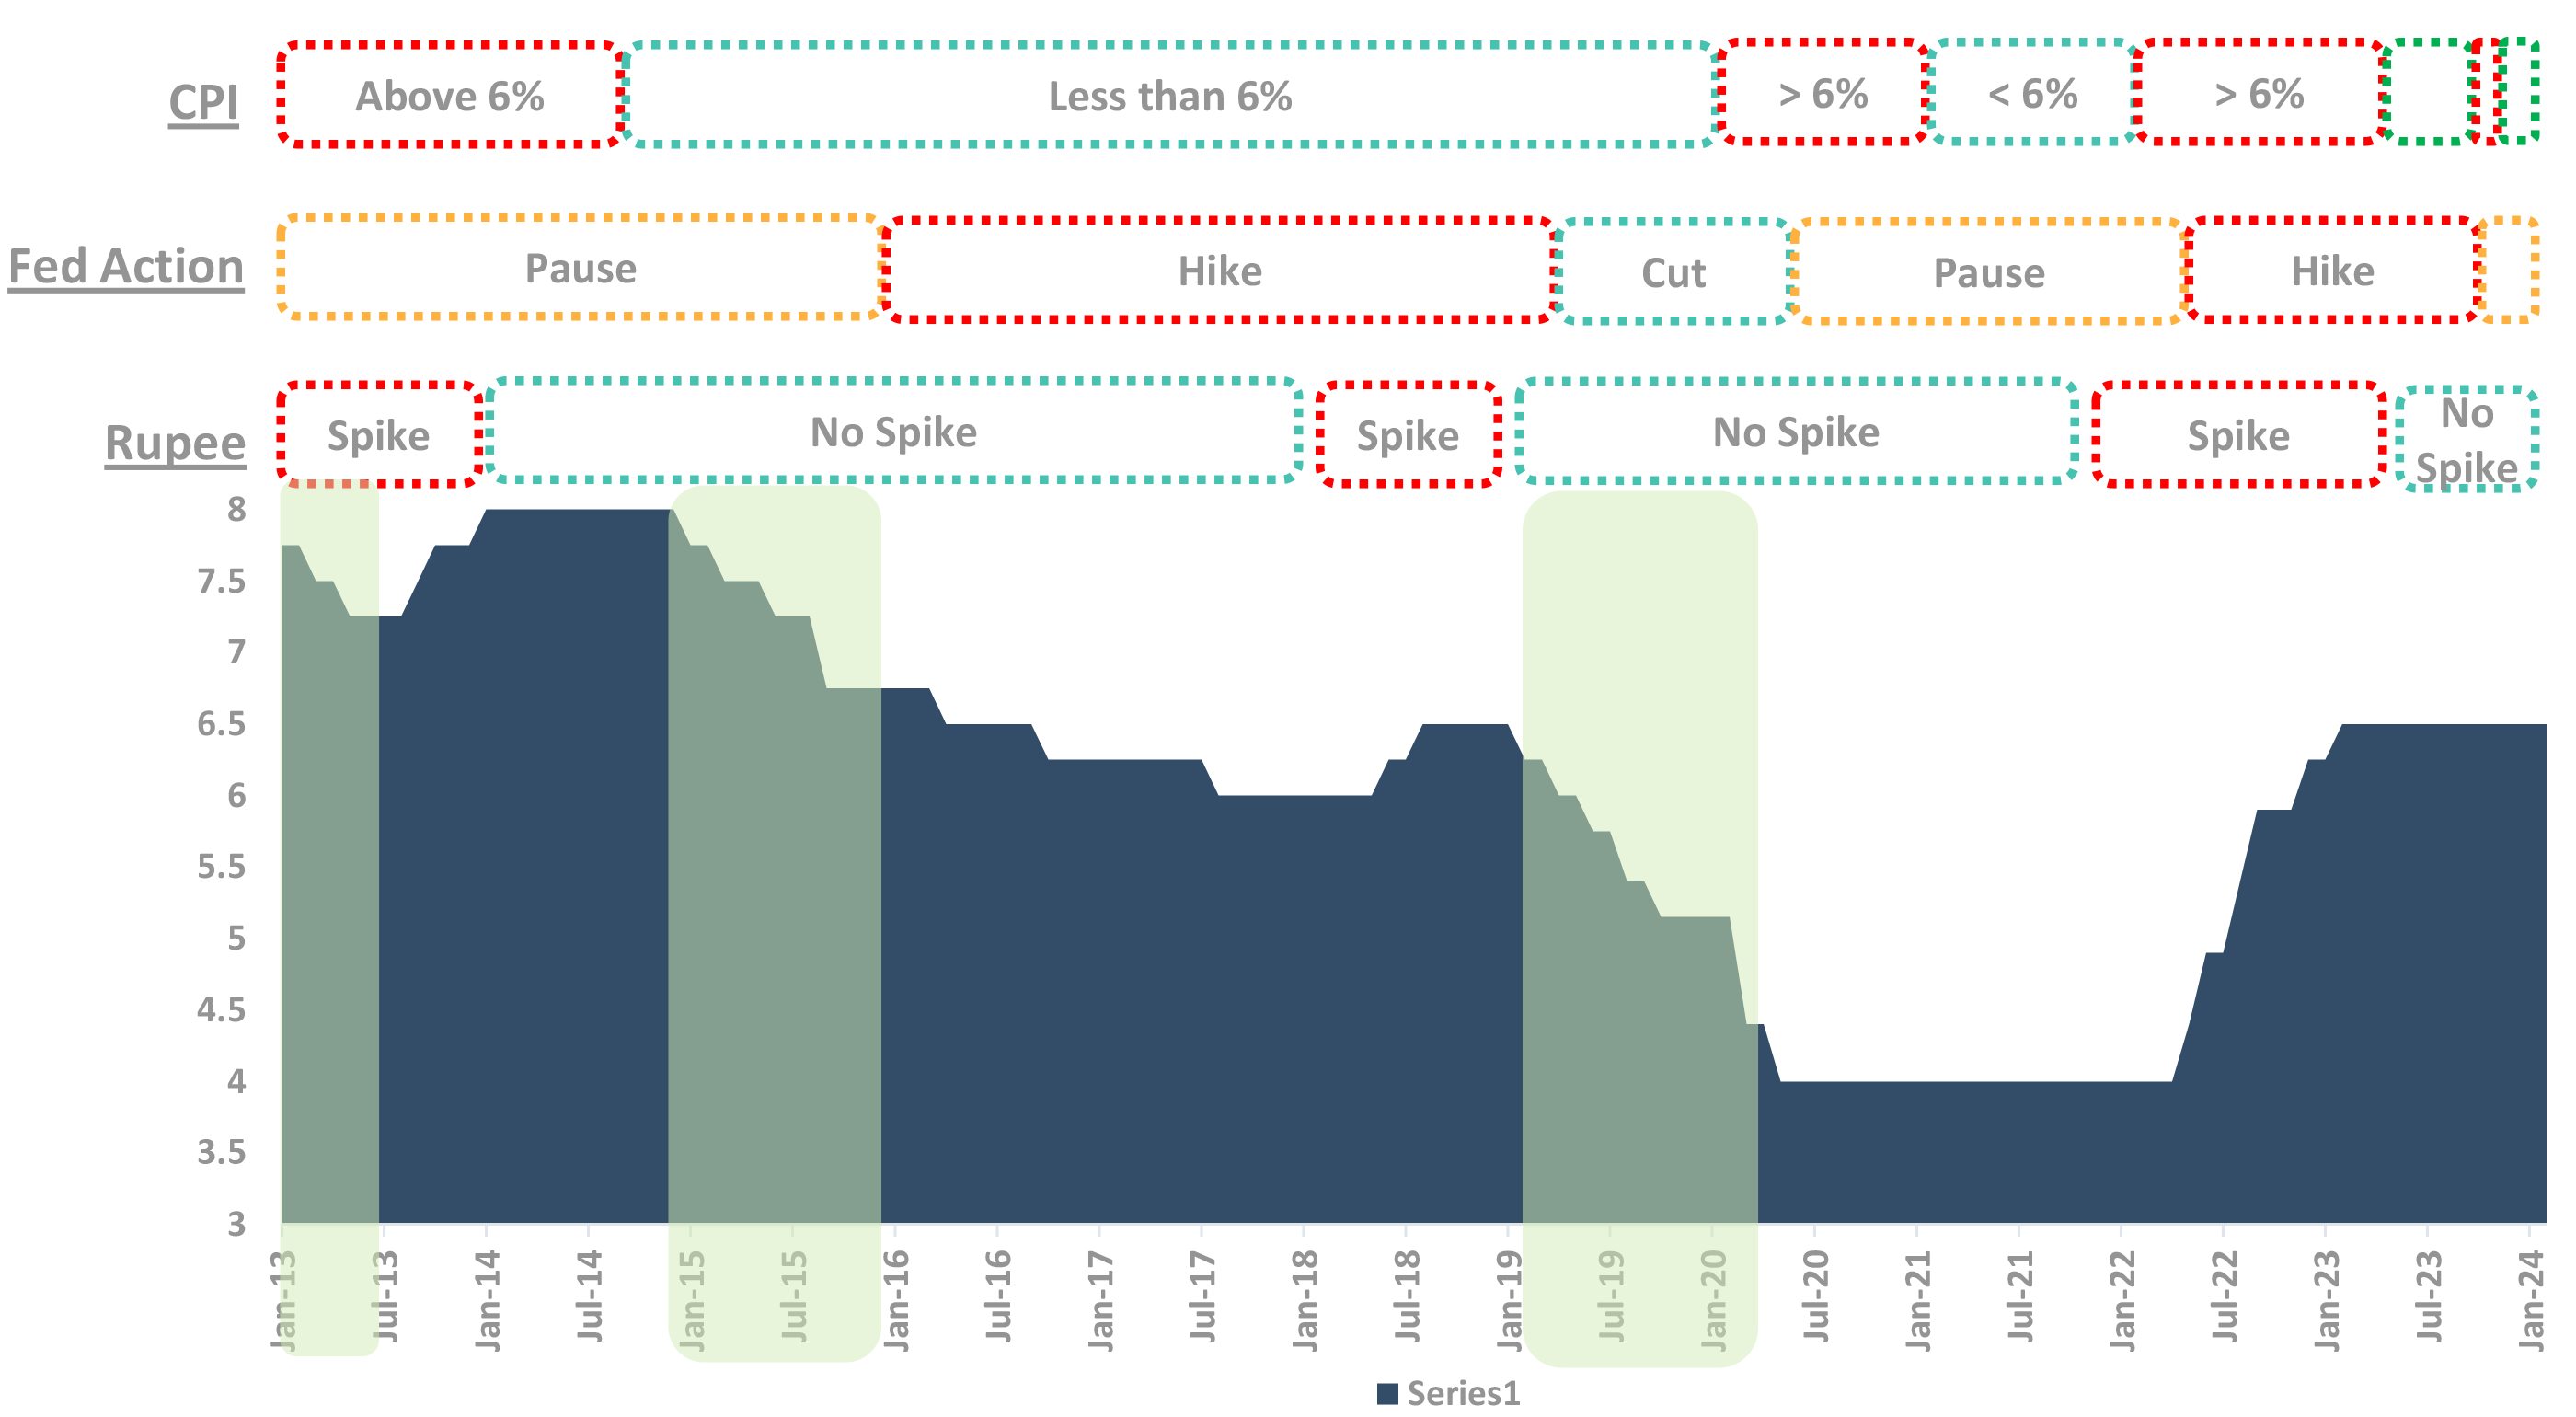
What makes RBI Cut Rates?
Rate cuts: Waiting for evidence from Fed cuts
-
Checklist for cut:
- Fed Pause/Cut
- Stable Rupee
- CPI less than 6% (except in 2013 when RBI didn’t have 6% target)
-
How is the Checklist now:
- Fed has turned dovish, yet we await cuts
- Given the FPI flows, forex reserves at $600bn+ and normalization of trade deficit, rupee to remain stable
- Inflation (although expected to remain volatile), RBI to look-through one-off shocks
Core moderates further
Growth remains resilient
FPI flows to support INR
After state election results, low risk in general elections
Let’s turn to Fiscal policy
Generally, it drives the long bond yields
It is reflected in demand/supply equation
Fiscal policy is favouring bonds right now
Only a small part of bond buyers are discretionary buyers
They drive yields
Supply fluctuation is borne by these buyers
Gsec market is still driven by lumpy institution purchases
Takeaway:
Increase in supply impacts the discretionary buying. Banks excess holding, passive buyers have been absorbing the supply
Source – DBIE LCR – Liquidity Coverage Ratio; SDL – State Development Loans; PF – Provident Funds; PD – Primary Dealerships; MF – Mutual Funds; FPI – Foreign Portfolio Investors; FI – Financial Institutions; RBI: Reserve Bank of India; GSec: Government Securities
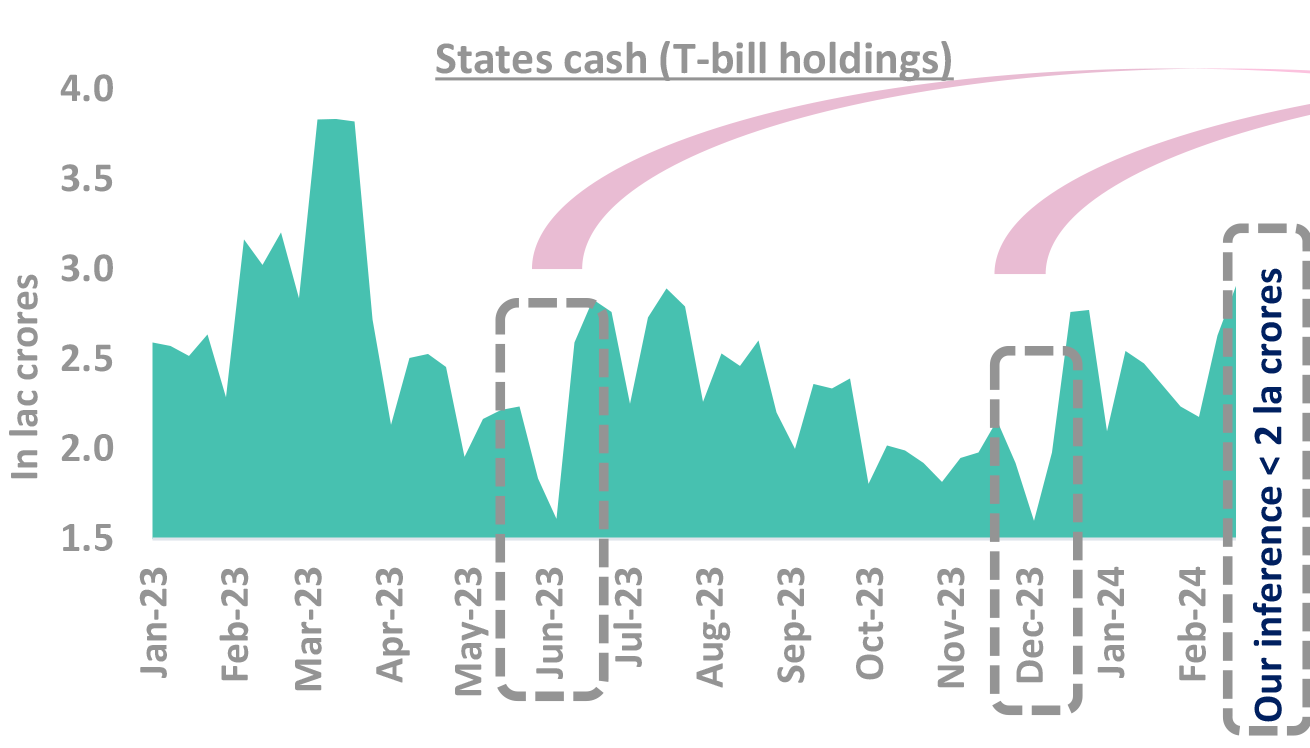
Comfortable supply/demand dynamics for FY25
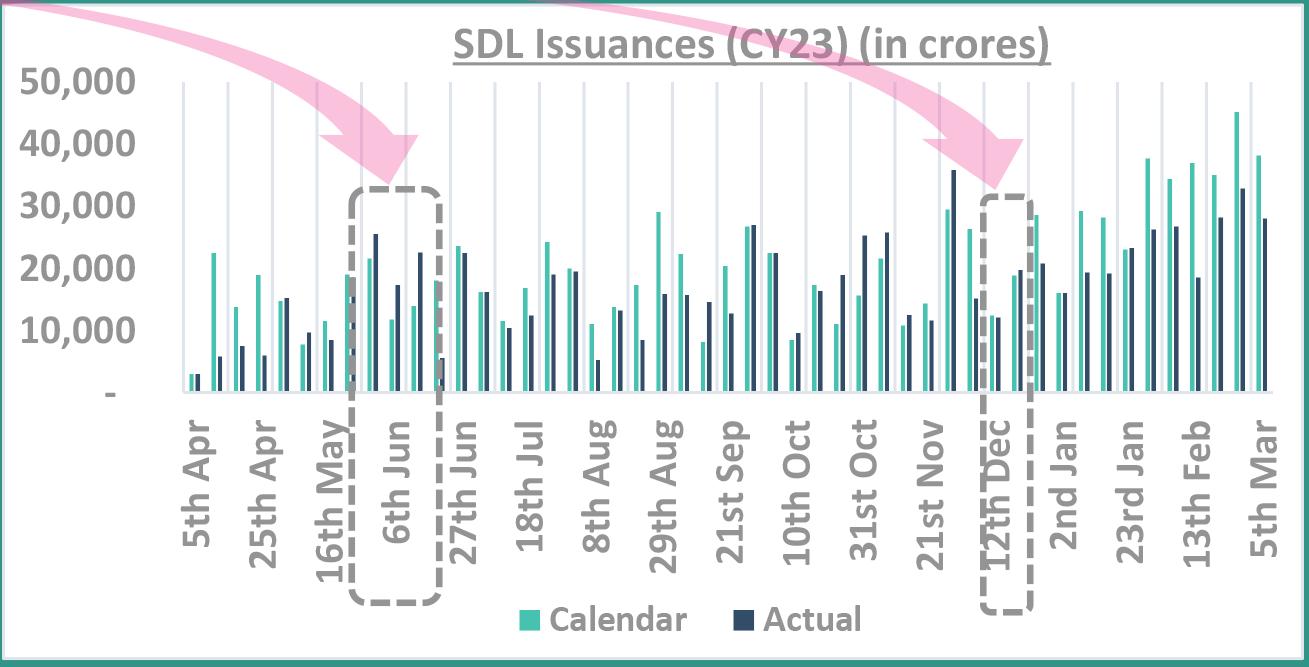
SDL supply only increases when states cash dip
Takeaway:
SDL supply may remain muted in FY24
Source – DBIE, RBI T-bill: Treasury Bill; SDL: State Development Loans
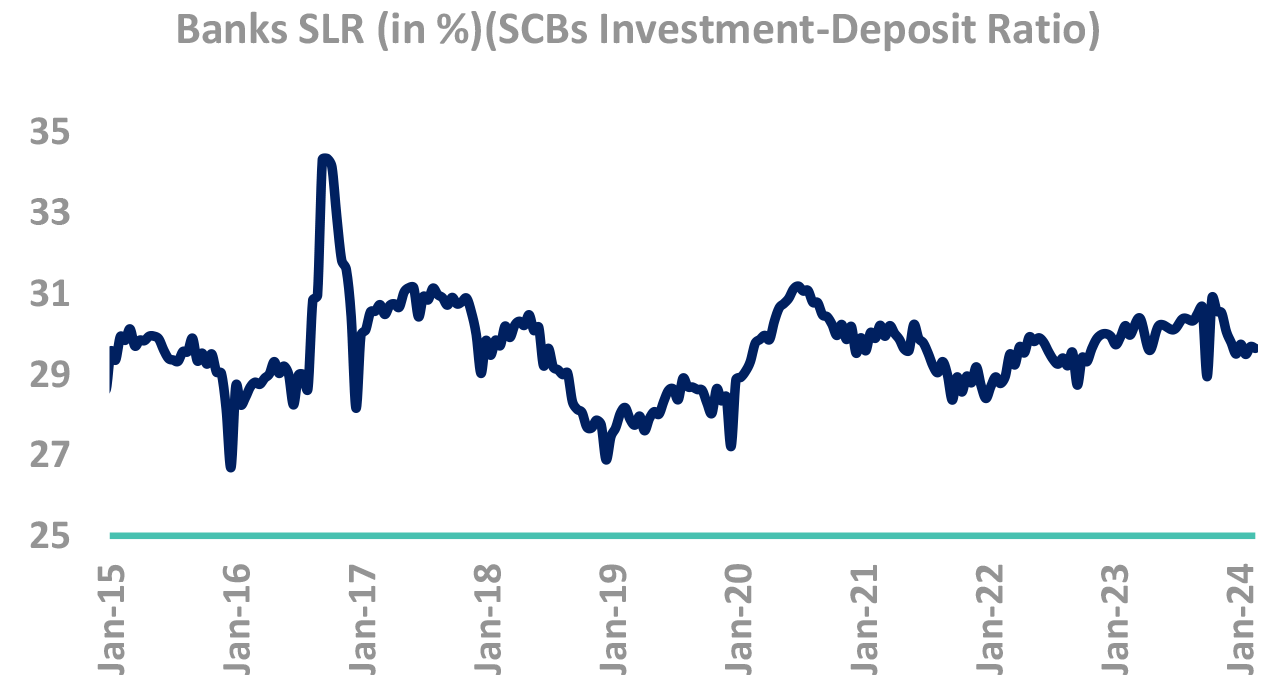
Banks have reduced holding
-
Yields usually track RBI OMO purchases
- Yields have strong correlation with RBI OMO
- Demand/Supply mismatch is filled in by RBI
-
RBI softened its liquidity management stance. However,
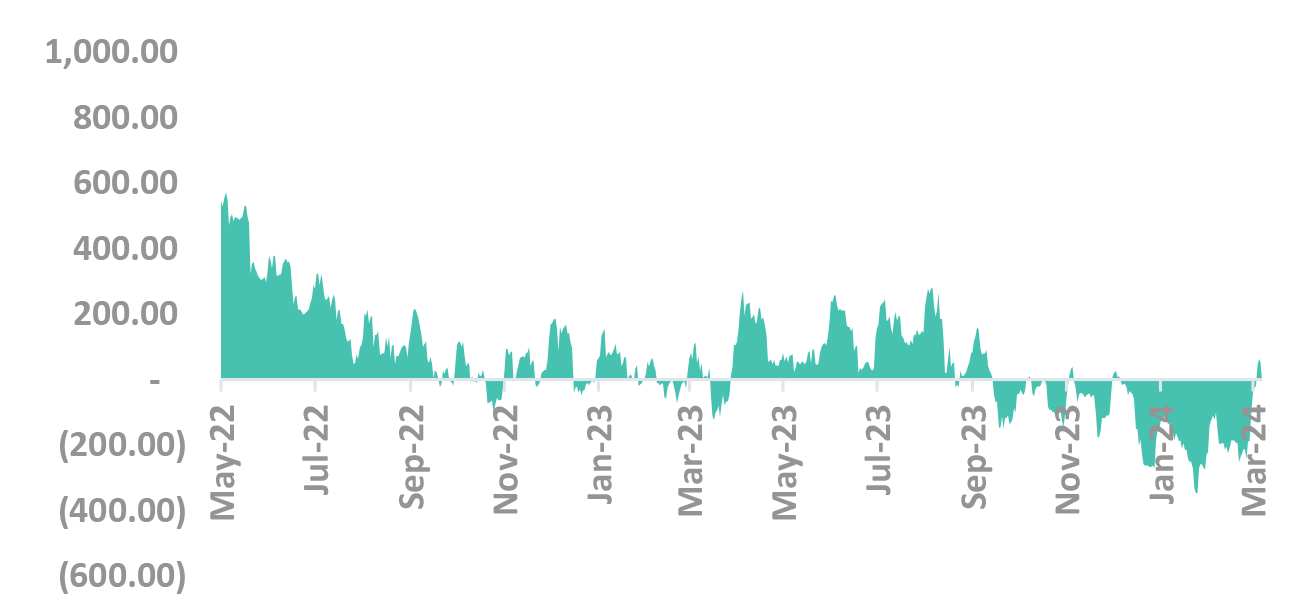
- Liquidity continues to remain tight despite VRR operation by RBI
- Further intervention necessary to bring liquidity to neutral
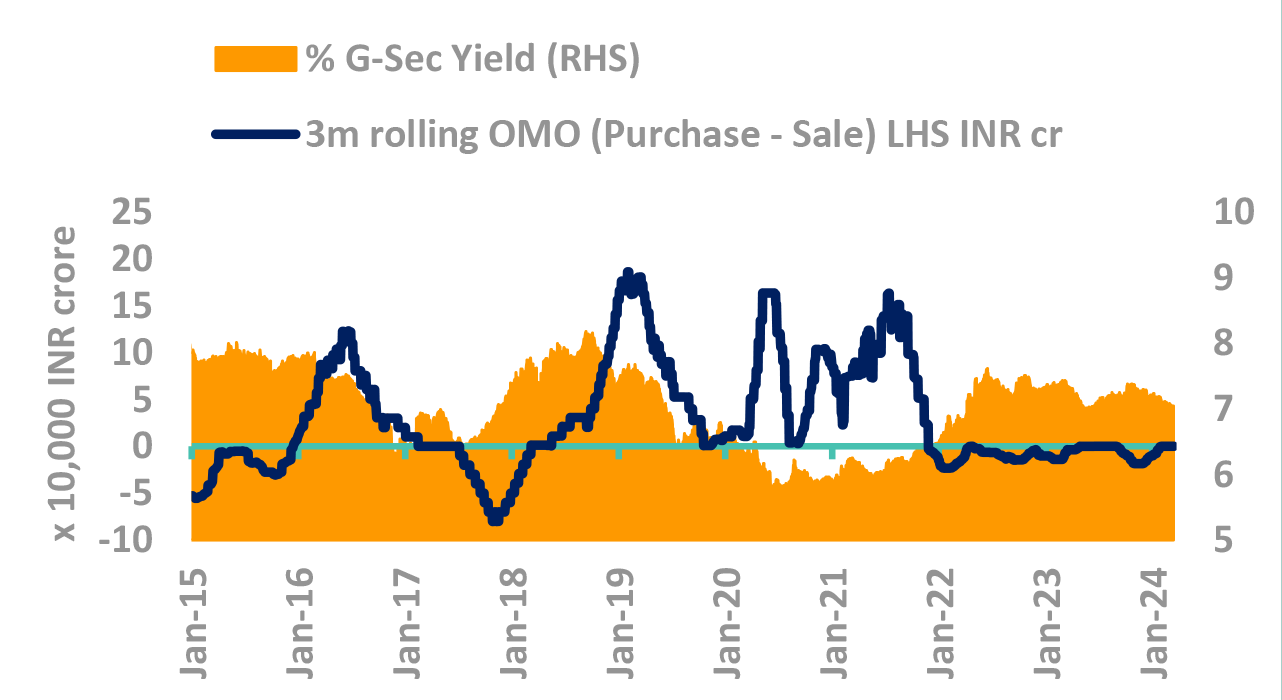
Takeaway:
Bank’s demand could shift to carry assets like SDLs and Corporate Bonds with the change in HTM regulations
Source – Bloomberg, DBIE, Internal OMO – Open Market Operations, SLR – Statutory Liquidity Ratio; G-Sec – Government Securities; RBI: Reserve Bank of India; SCB: Scheduled Commercial Bank; CIC: Currency in Circulation
FPI buying to drive excess demand in FY25
Takeaway:
Estimated excess demand of ₹ 0.75 lac crores.
Source – Internal, CGA G-Sec: Government Securities; OMO: Open Market Operation; RBI: Reserve Bank of India; FPI: Foreign Portfolio Investment; NPS: National Pension System; MF: Mutual Fund; SDL: State Development Loans; SLR: Statutory Liquidity Ratio; PF: Provident Fund; EPFO: Employees’ Provident Fund Organisation; NSSF: National Small Savings Fund
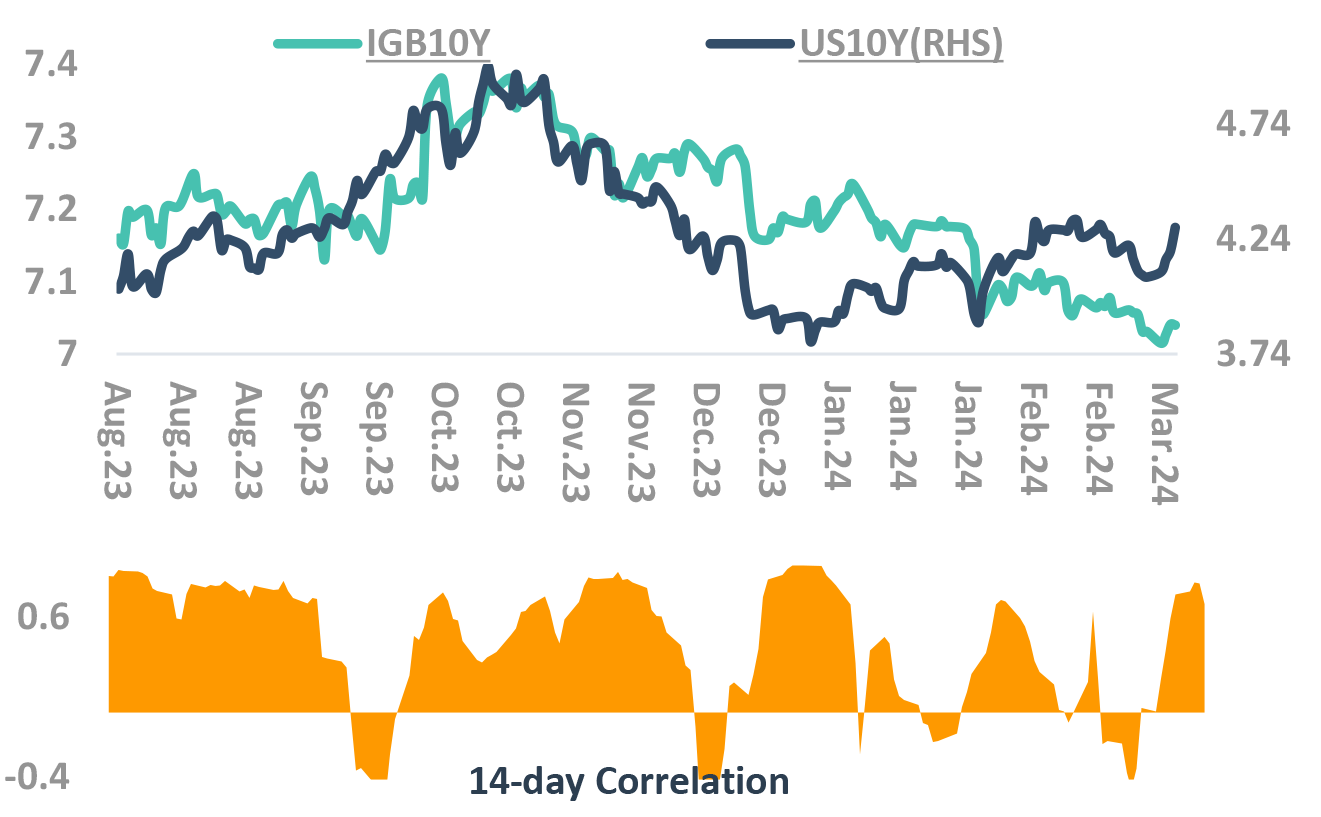
Indian yields tracking Global yields
But with lopsided beta
Impact of US yields on Indian yields
-
Expect correlation, but with lopsided beta
-
2-Year better reflection of FOMC
- If UST yield rise, IGB yields may rise somewhat
- If UST yield fall, IGB yields may fall significantly
Risk/Reward to play for lower yields
-
FOMC to give near term trajectory
- We go long duration in FOMC, aware that there may be transient spikes in UST yields

Takeaway:
Expect correlation, but with lopsided beta
Source – Bloomberg, Internal Fed: Federal Reserve; CPI: Consumer Price Inflation; RBI: Reserve Bank of India; IGB: India Government Bond; FOMC: Federal Open Market Committee; UST: US Treasury
Money Market Assessment Framework
Takeaway:
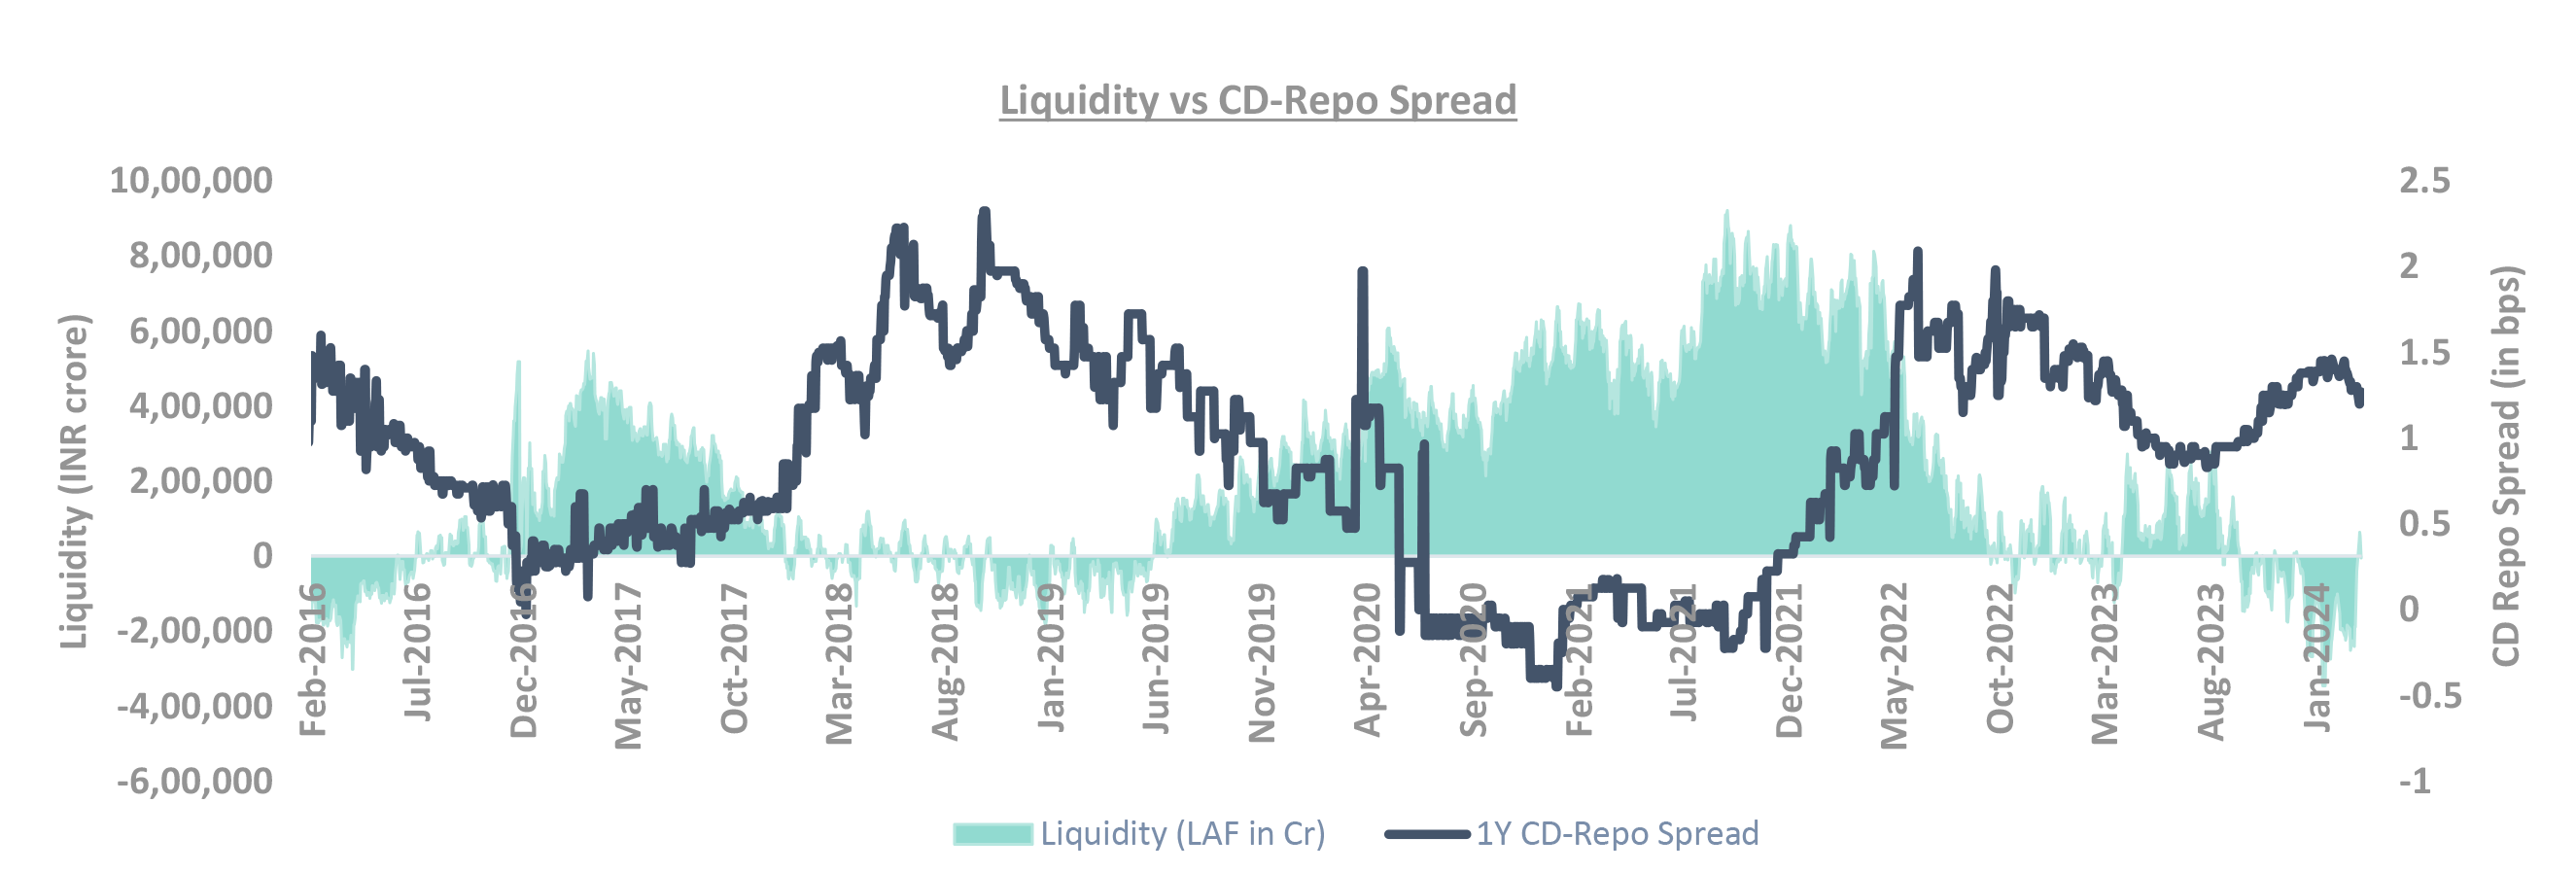
Money market yields have rallied since the peak, driven by banking system liquidity moving into neutral zone. We remain long in our money market funds as durable liquidity is in surplus and demand supply dynamics turn favourable next quarter.
CIC: Currency in Circulation; CD: Certificate of Deposits; OMO: Open Market Operations; VRR: Variable Rate Repo; VRRR: Variable Rate Reverse Repo; RBI: Reserve Bank of India: GOI: Govt of India
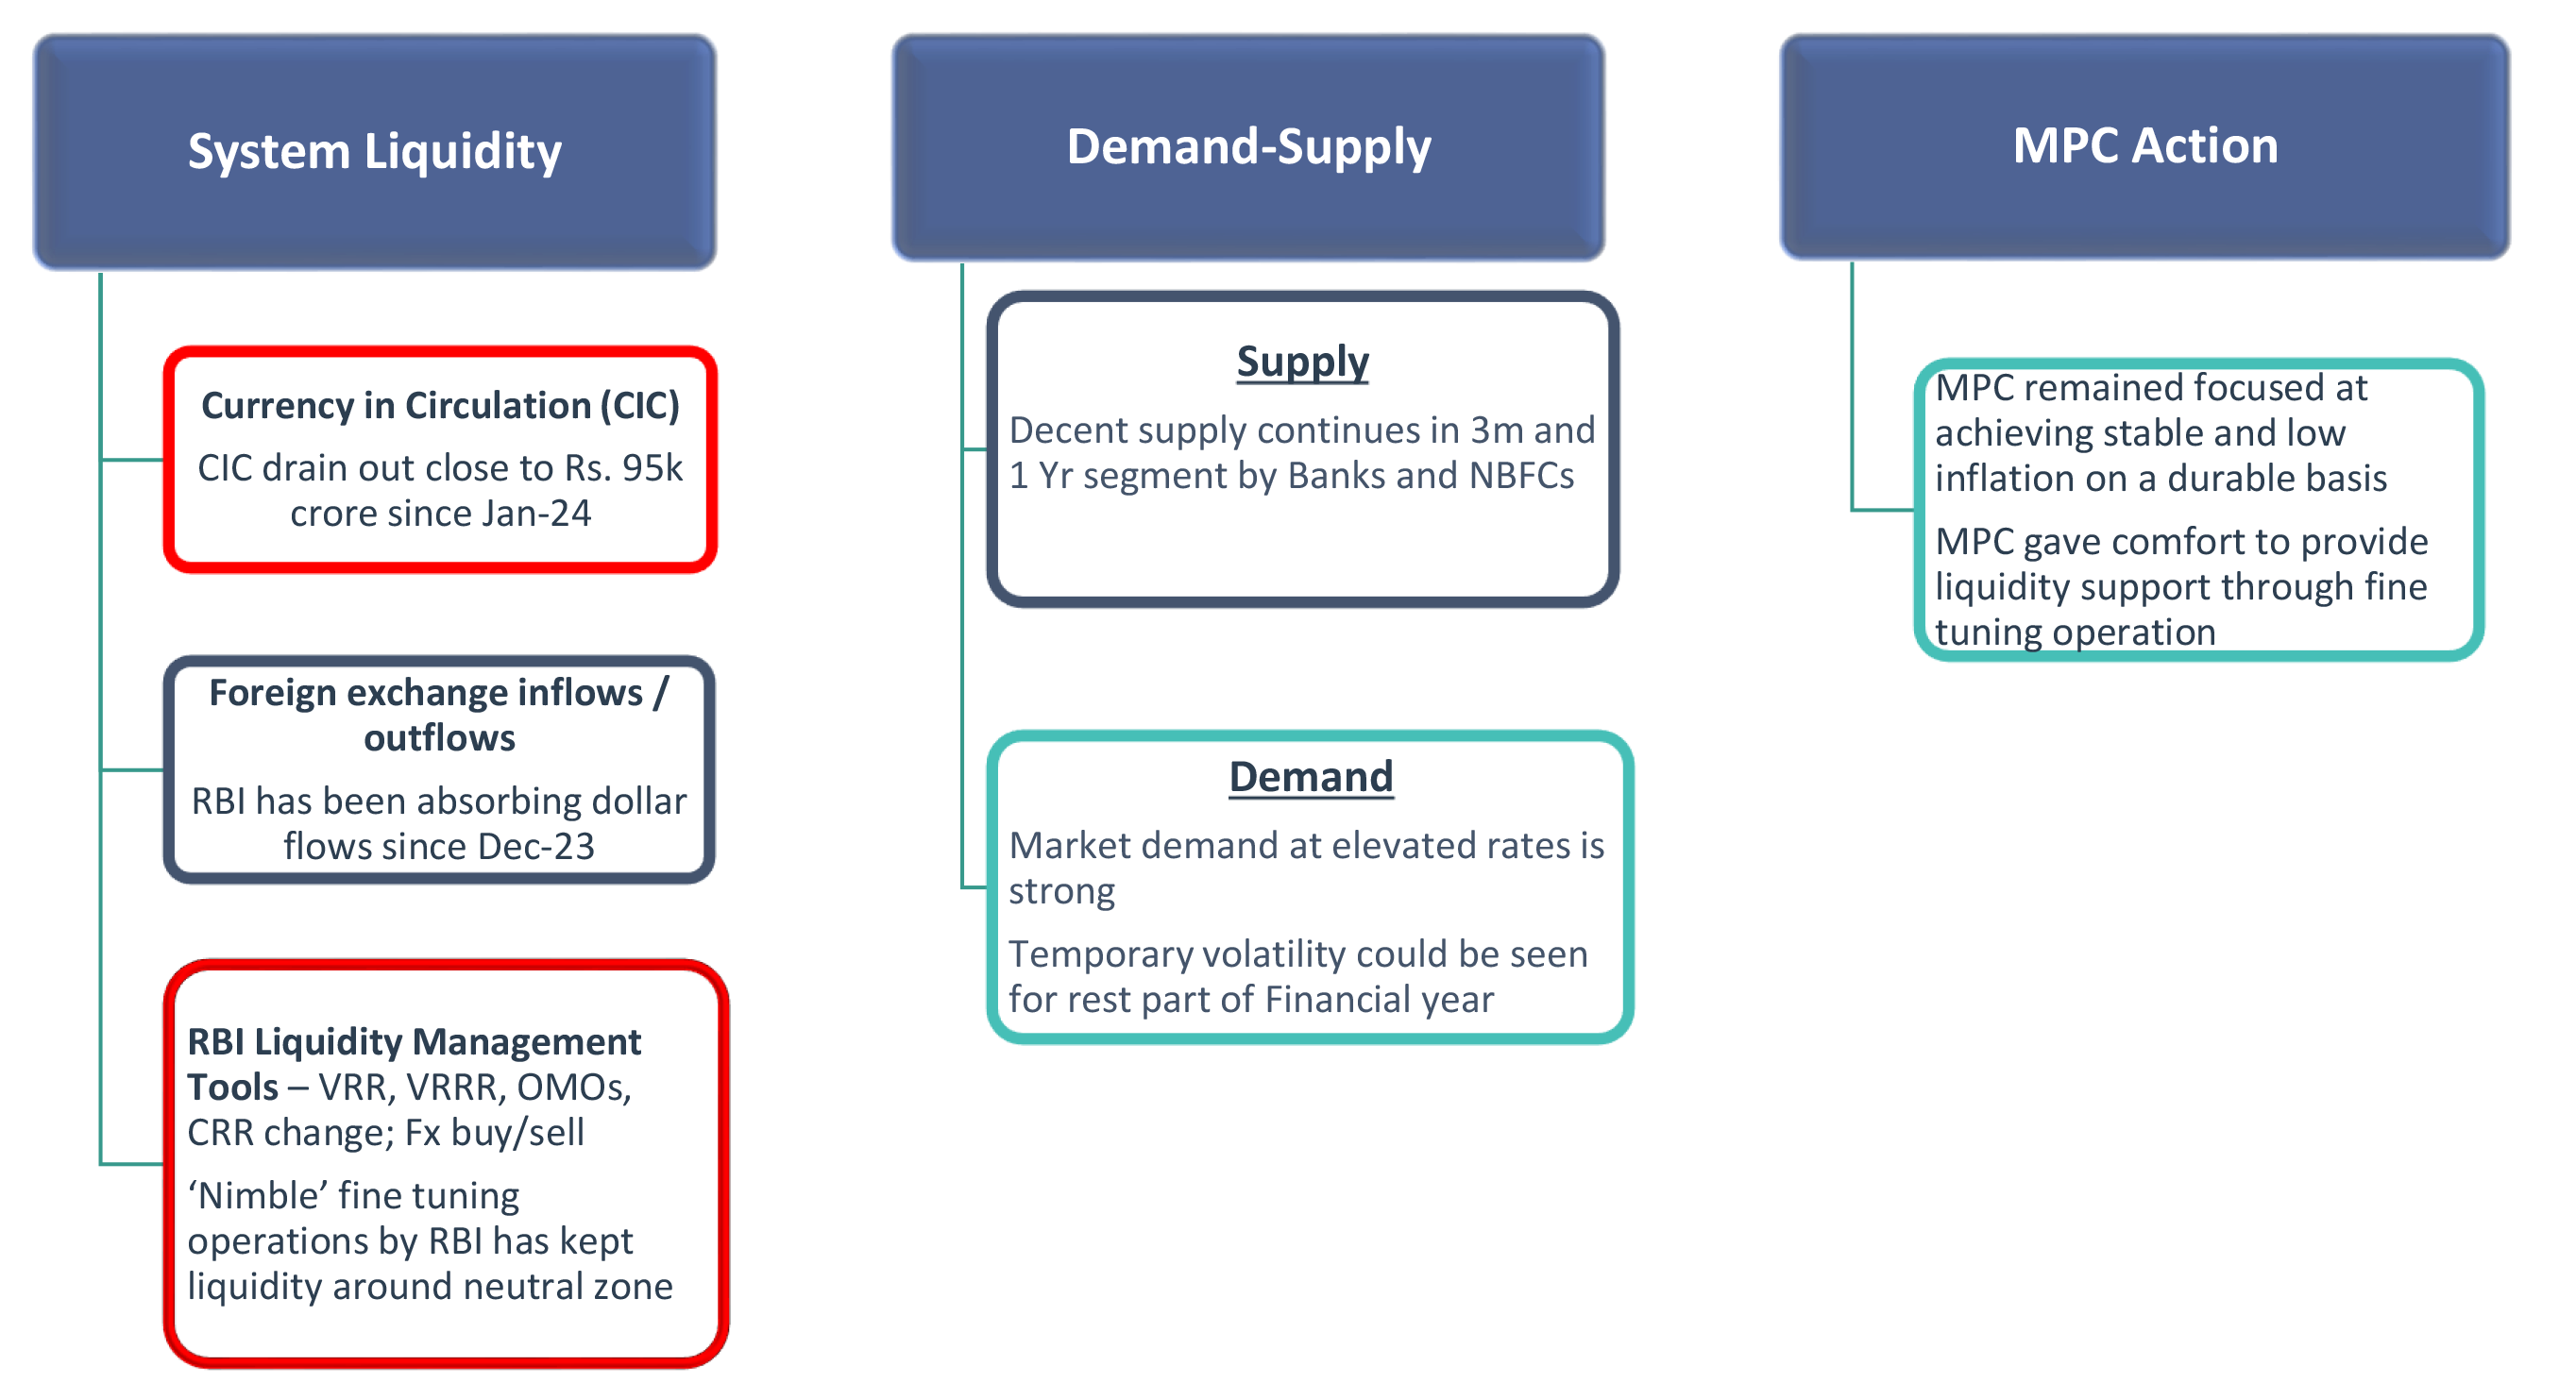
Banking system liquidity in neutral zone
-
Expect system liquidity to improve aided by govt spending and FX operations
- We saw a CIC drag of ₹ 94k crore from January 24 onwards
- Typically, from Jan-May it increases roughly by INR 2-2.5lakh crore, due to seasonal factors
- RBI absorbing FX flows since Dec-23. Swap maturity in Mar to partly absorb CIC increase
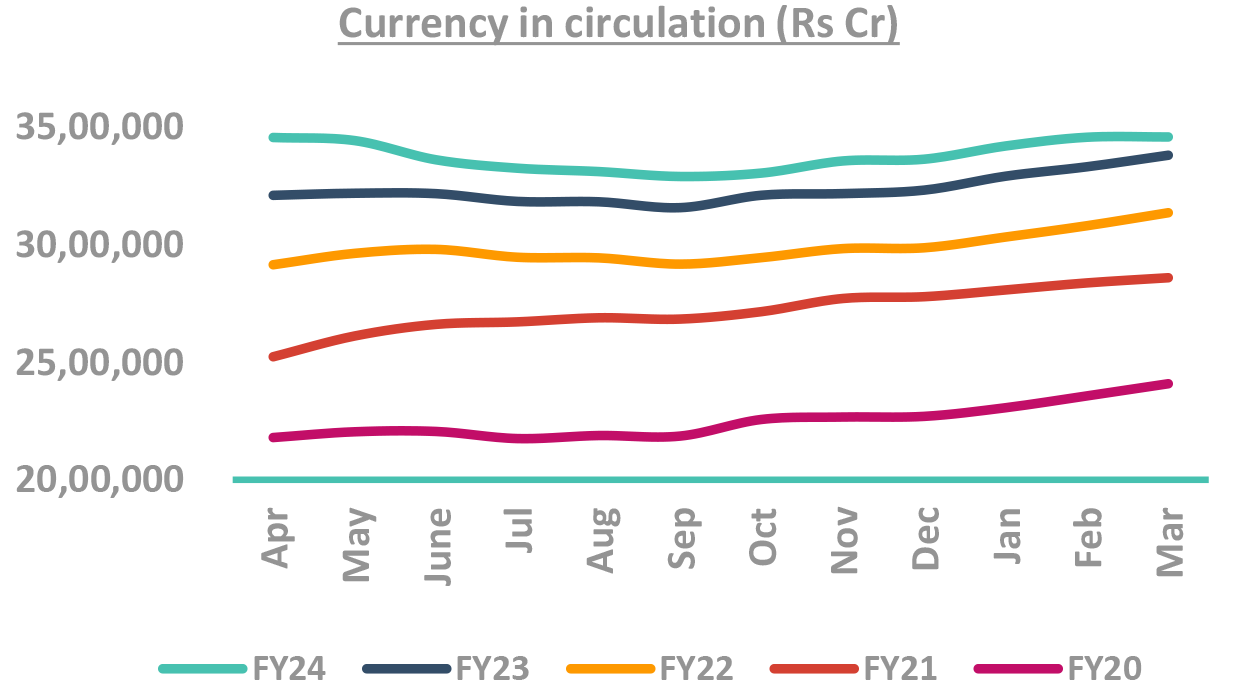
Takeaway:
Expect banking liquidity to move into positive zone by April
G-Sec – Government Securities; CIC: Currency in Circulation Source – Bloomberg, RBI, *Internal Estimates
Money market yields have rallied with improving liquidity position
Takeaway:
We continue to remain long across our money market funds
CD: Certificate of Deposits *Internal Estimates
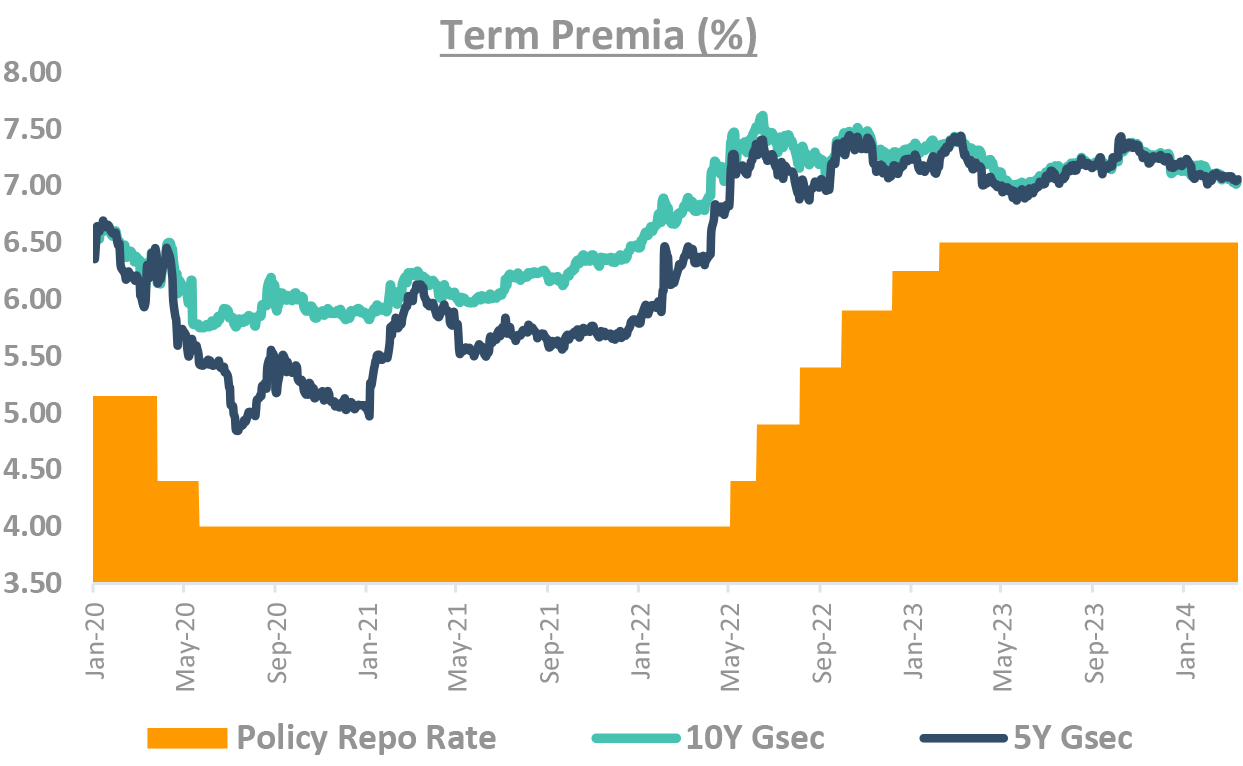
Term premia is still not low
-
Term premium falls sharply before rate cuts
- This time, the slope of the fall is much less
- If rate cuts get priced, the spread of 50bp will be high
-
Why do we prefer slope, not absolute levels?
- The slope removes the underlying demand/supply dynamics and thus can be compared across time
-
Even absolute levels are attractive
- Even absolute levels are attractive from prior regimes preceding rate cuts

-
Term premia: function of demand/supply and rate expectation
- During covid term premia high
- Supply high: Govt increased fiscal deficit
- Repo rates were expected to rise
- Post covid term premia fall is natural
- Supply low: reduced FY25 supply, FPI flows
- Rates are expected to fall
- During covid term premia high
-
The trend of high demand, low supply strong
- Unlikely that govt will leave fiscal consolidation
Takeaway:
Term premia is still attractive given favorable demand supply dynamics
Source – Bloomberg
DSP FI Framework checklist
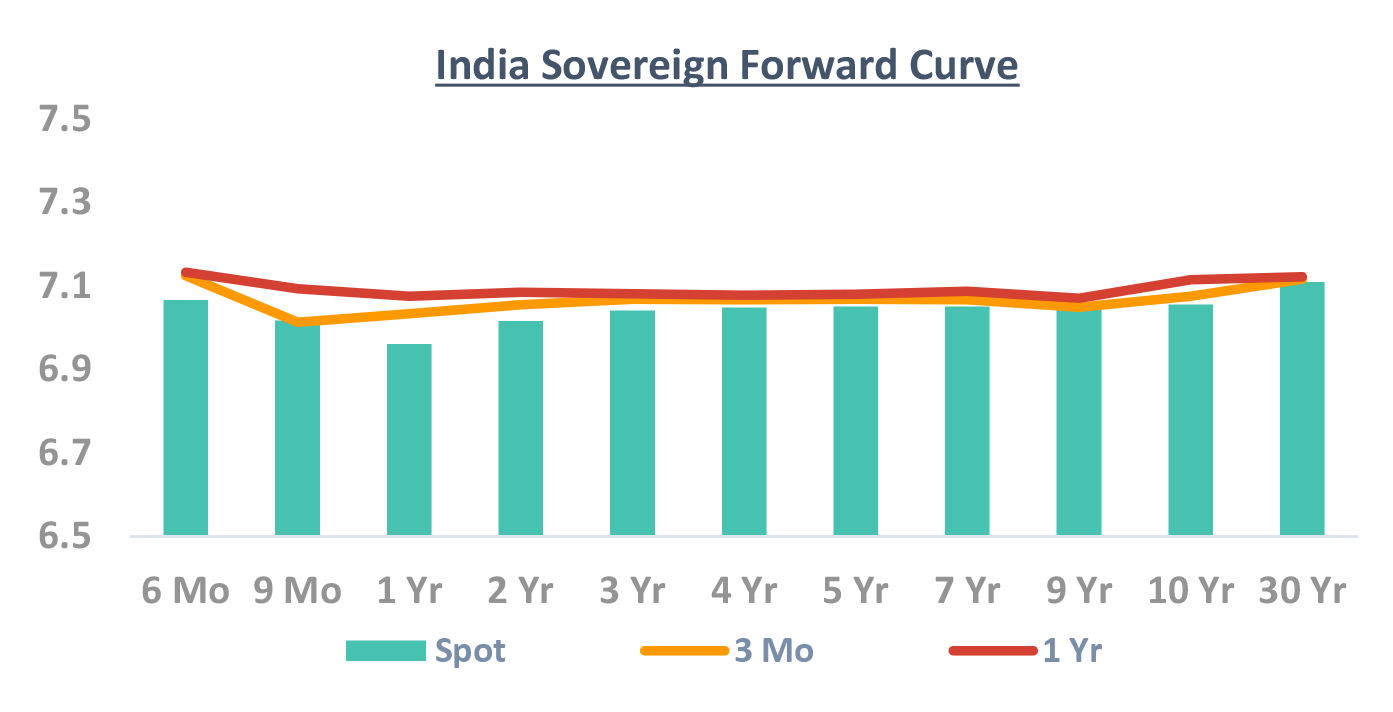
DSP Duration decision:
The chart shows how much expected yield fall/rise is already
priced in the current curve.
Large gap between the current yield and forward yield shows
that yield change is priced in – and thus yield change will not
give capital gain/loss.
Similarly small gap means that the market is not pricing change
in yields.
We have discussed duration and yield movement.
How do we choose corporates and credit?
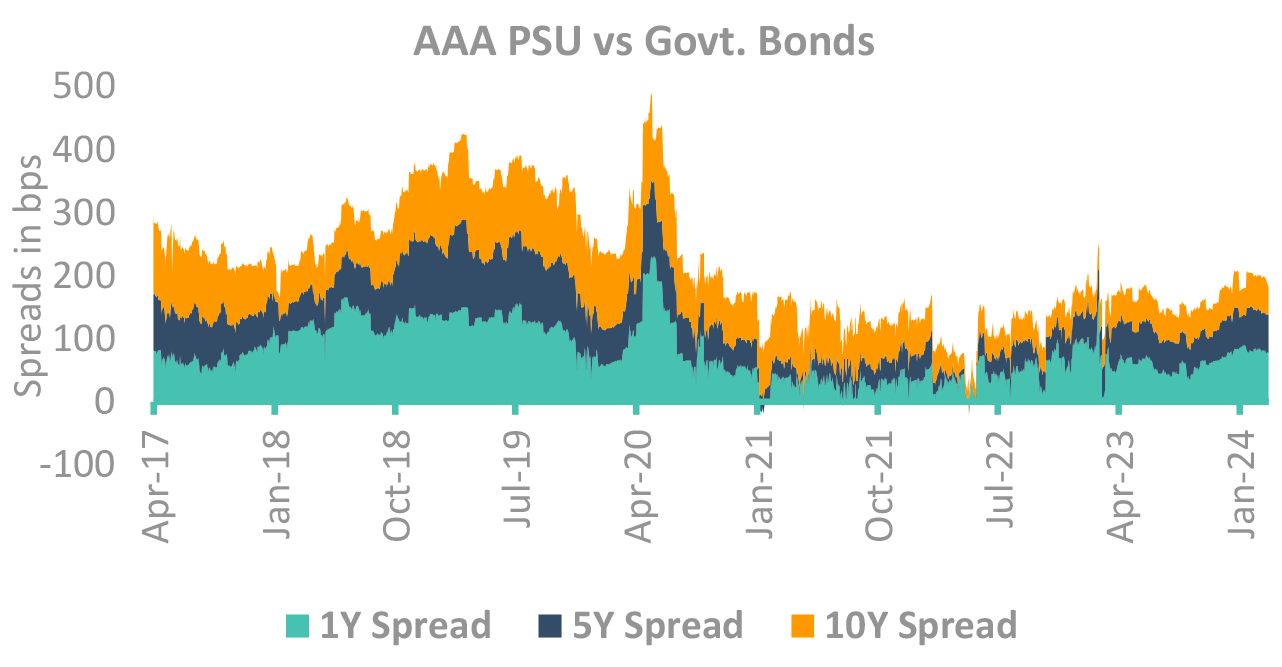
DSP Asset Allocation: Tight liquidity and supply to keep spreads high
-
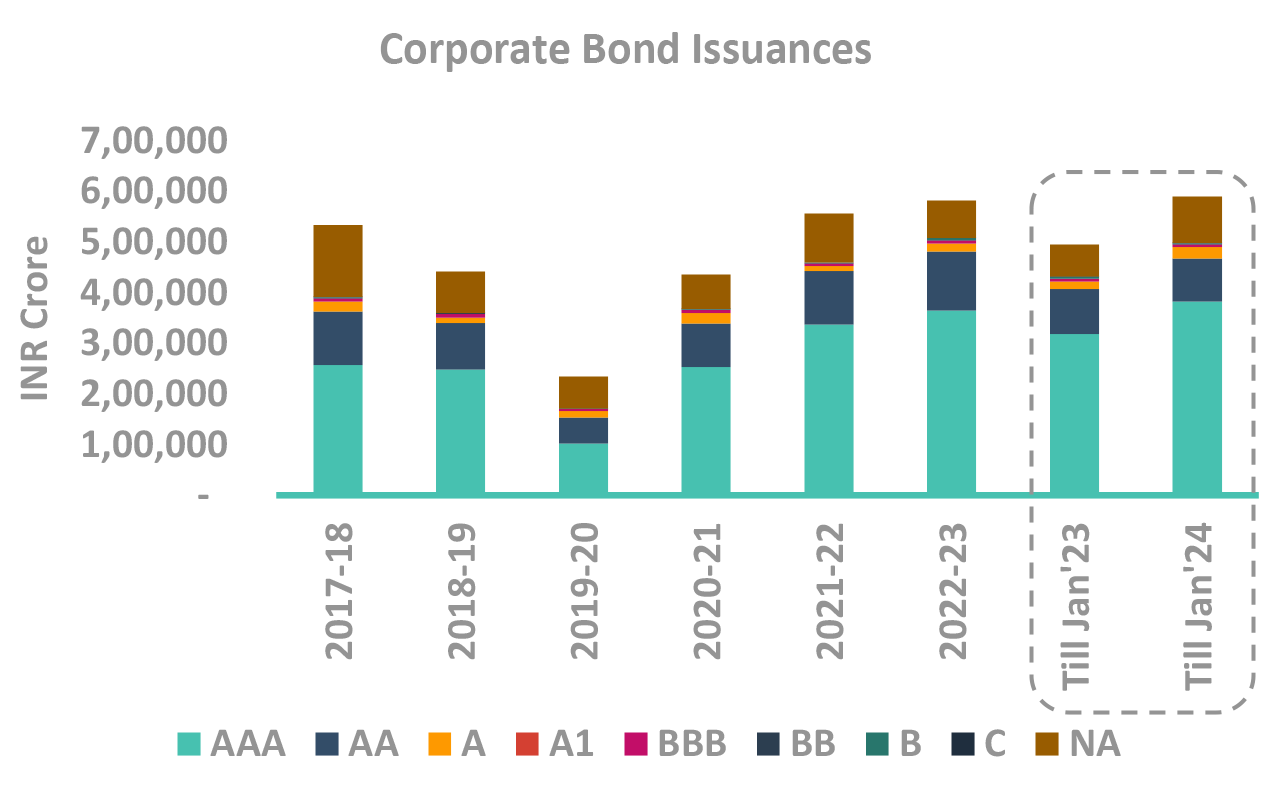
Supply has remained manageable so far
- Issuance till Jan’24 at 19% higher YoY (5.9 lac crores)
- Led by 20% higher supply in AAA rated issuances
- Supply in Feb higher at ~94k crores
-
Higher issuance by NBFCs led by increased risk weights
- 2-3Y NBFC Spreads are at high of 110-120 bps
- Attractive levels to remain invested/spreads should narrow with expected liquidity easing in next quarter
Takeaway:
Tight liquidity and continued supply to keep spreads at elevated levels for NBFCs and AAA PSU corporate bonds are well supported at all tenors.
Source – Bloomberg, CCIL, Internal PSU: Public Sector Undertaking, NBFC: Non-Bank Financial Companies
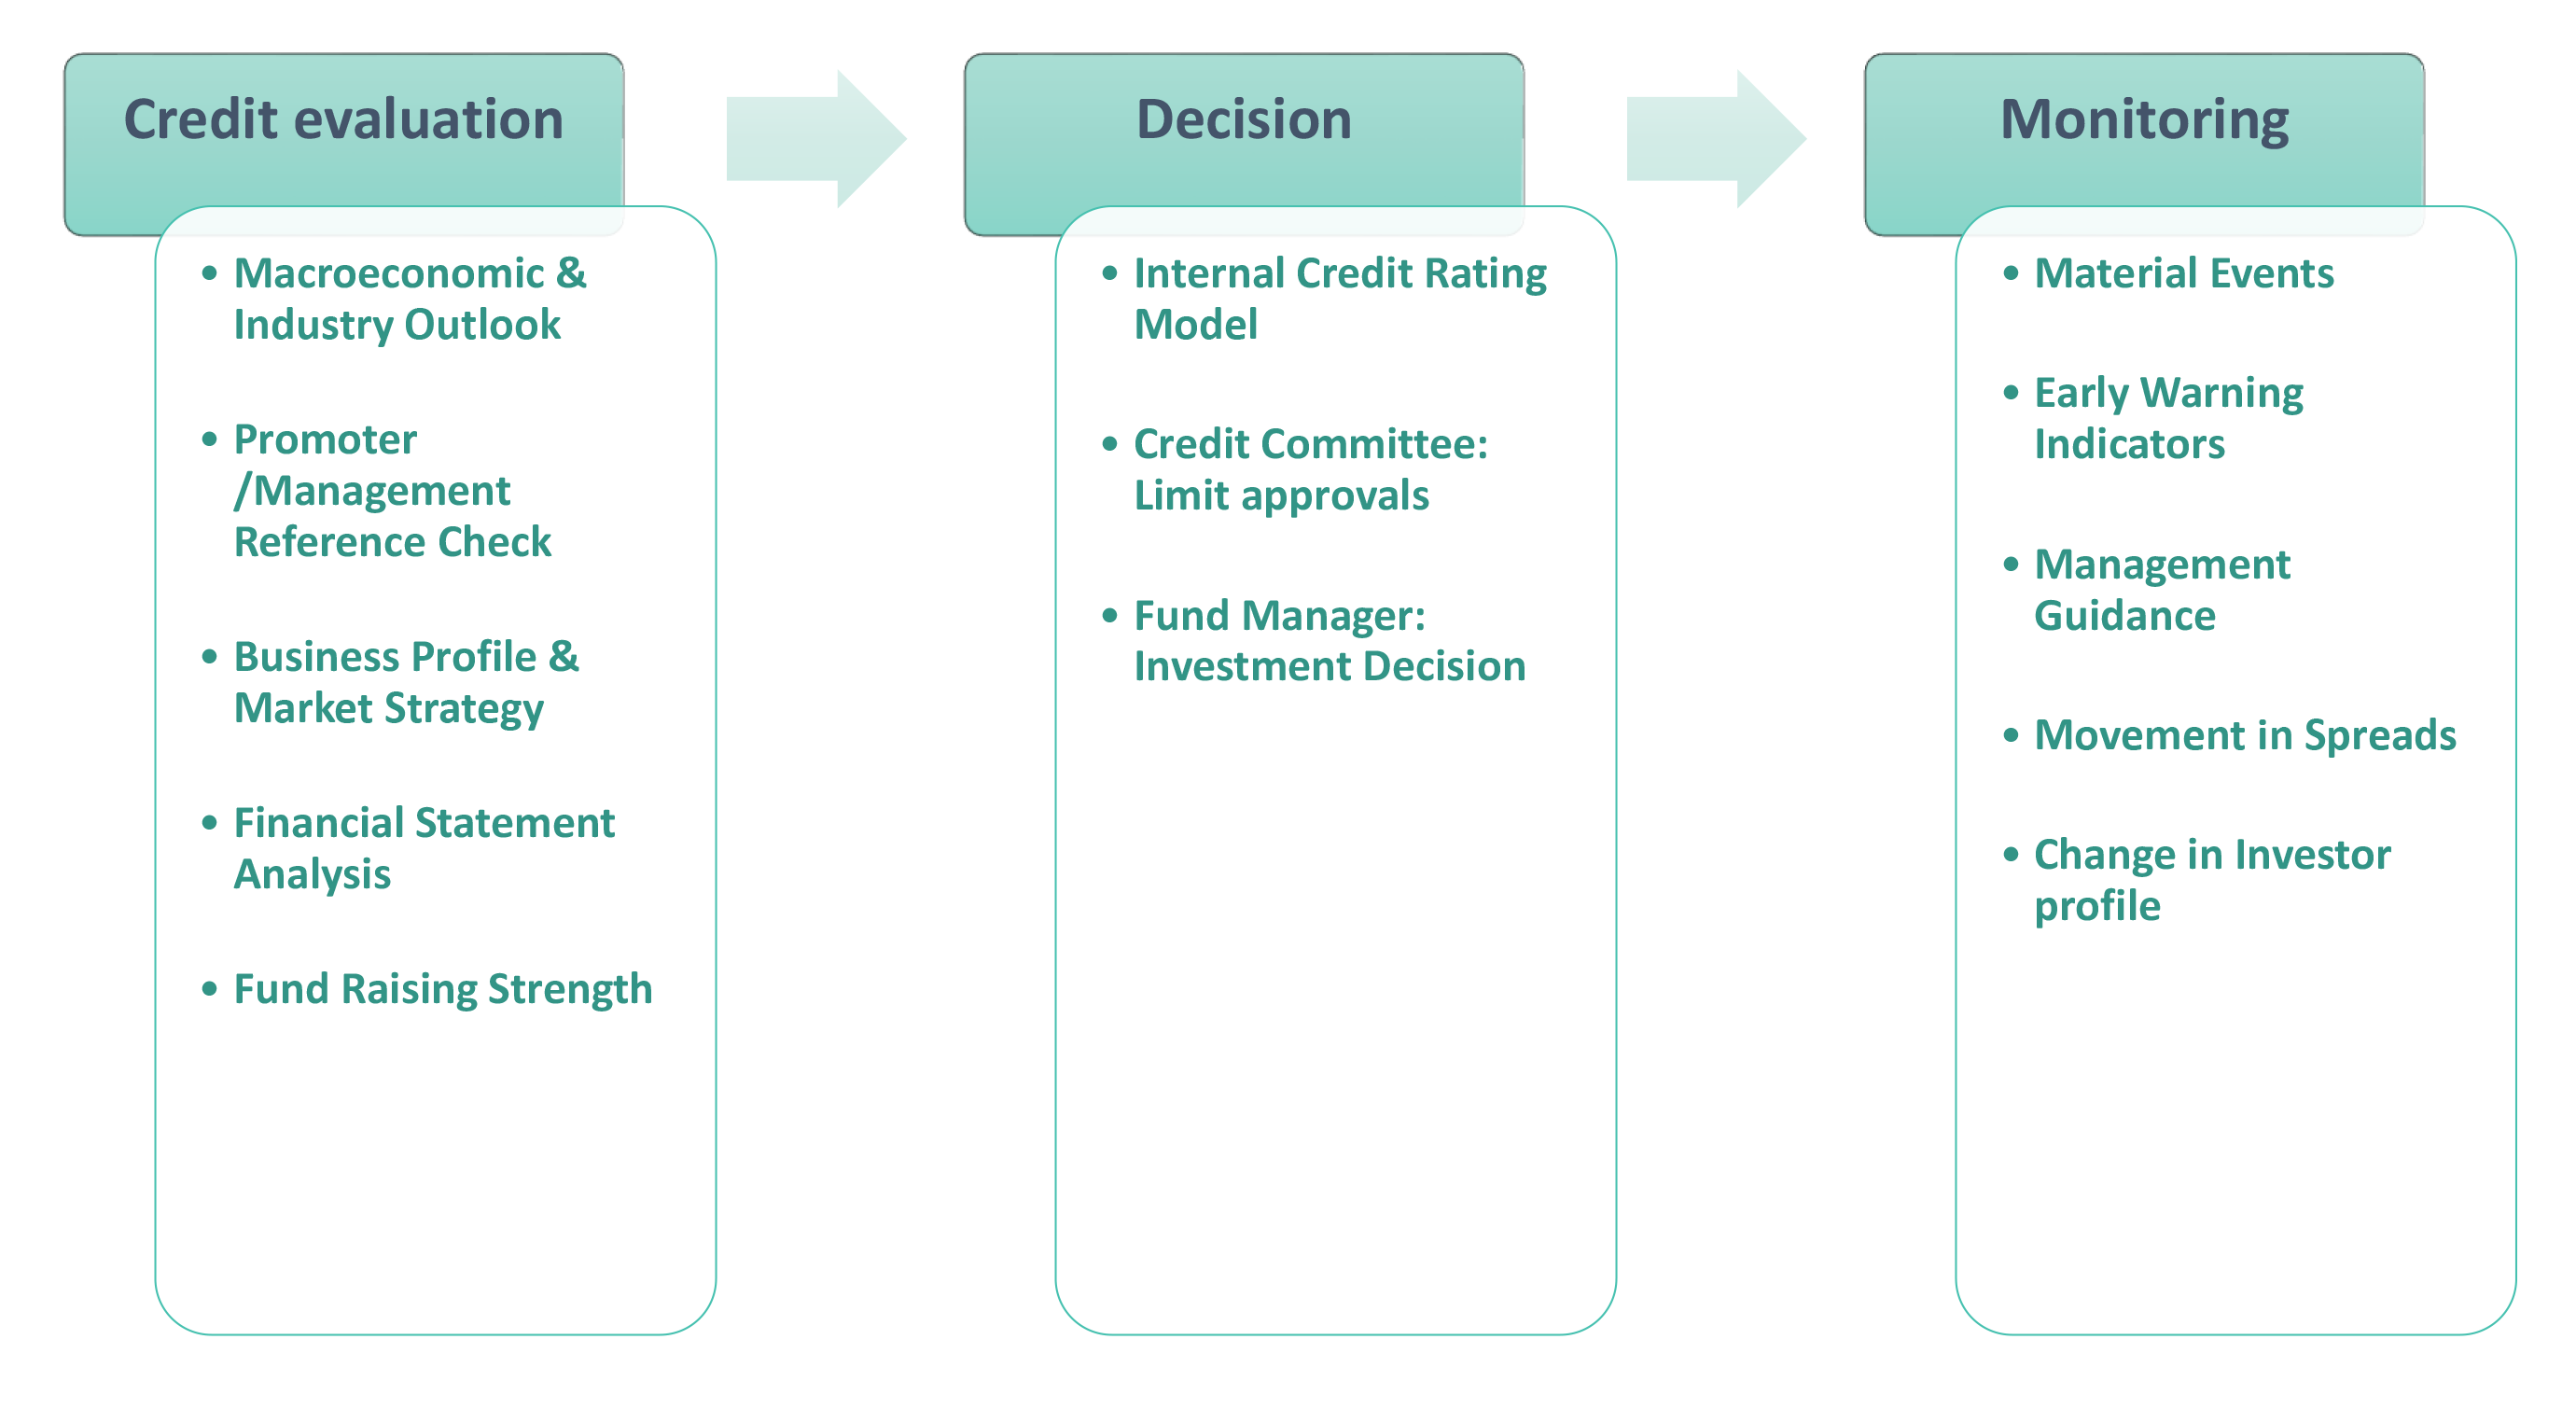
DSP Credit Investment Process – Focus on Governance
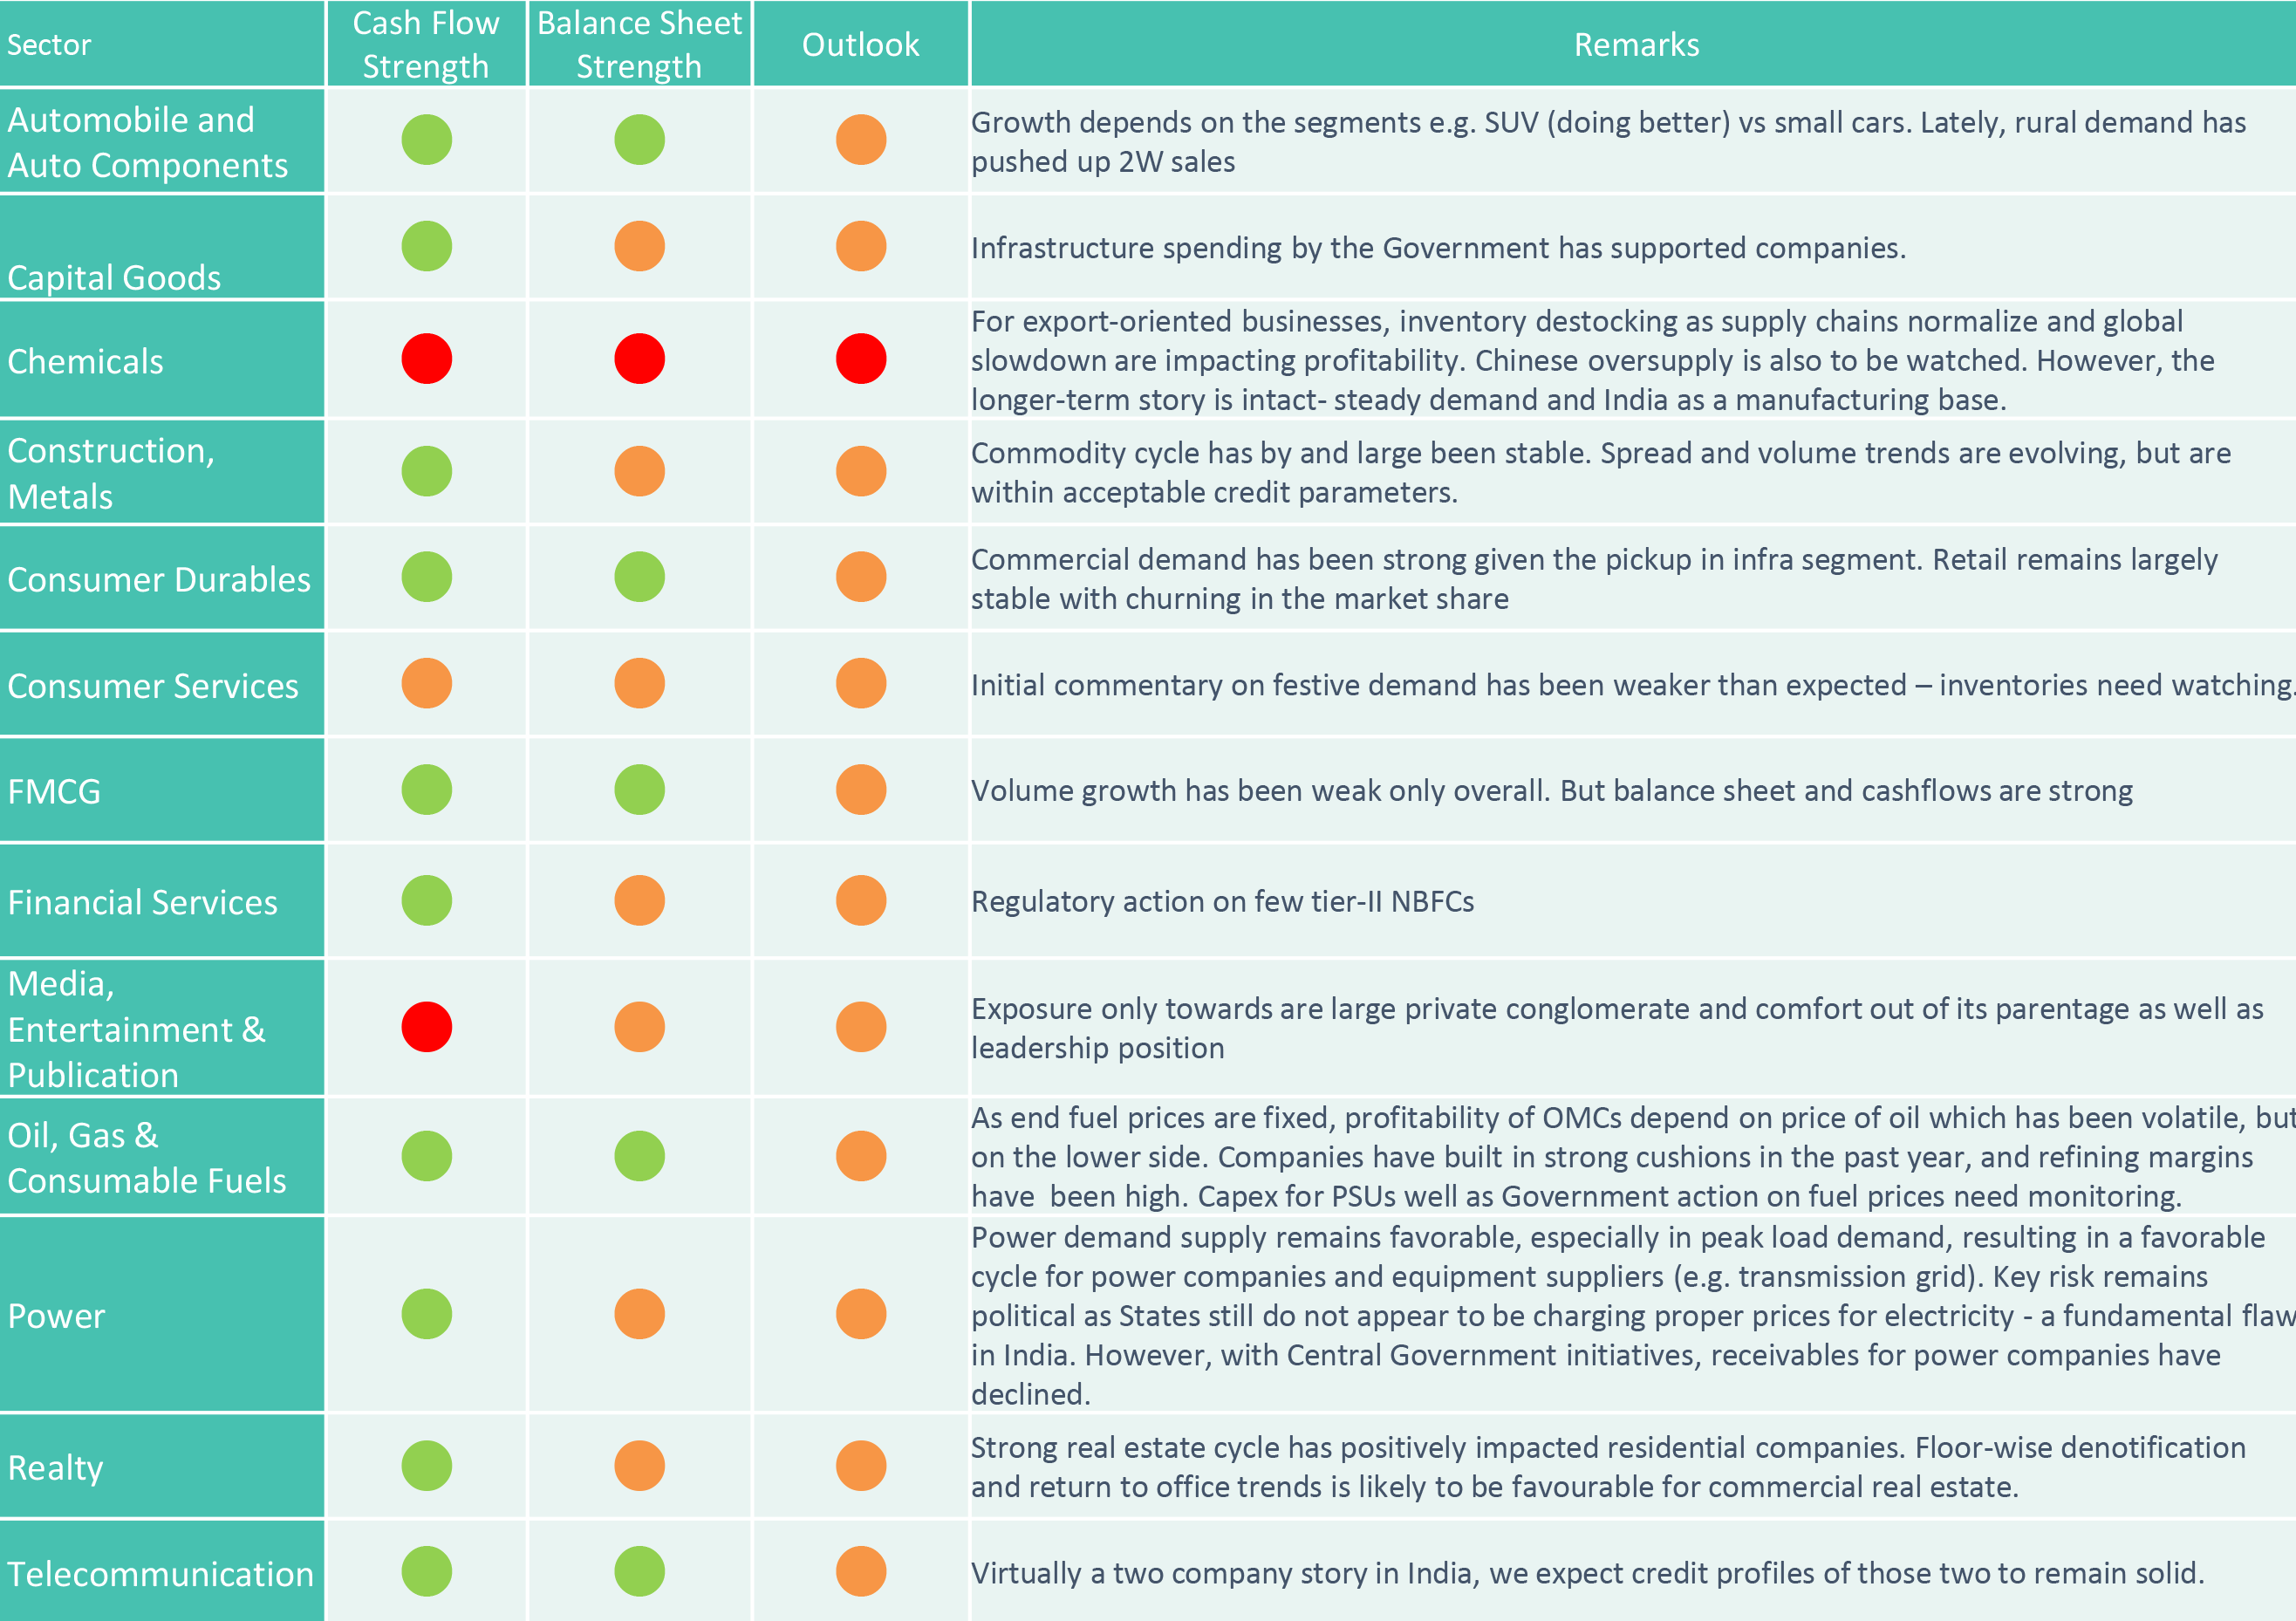
DSP Credit view on sectors
Done with our market view framework?
Now
Our Portfolio creation framework
DSP Portfolio Creation: Multi-step process
DSP Fixed Income Funds follow a defined methodology for fund portfolio construction
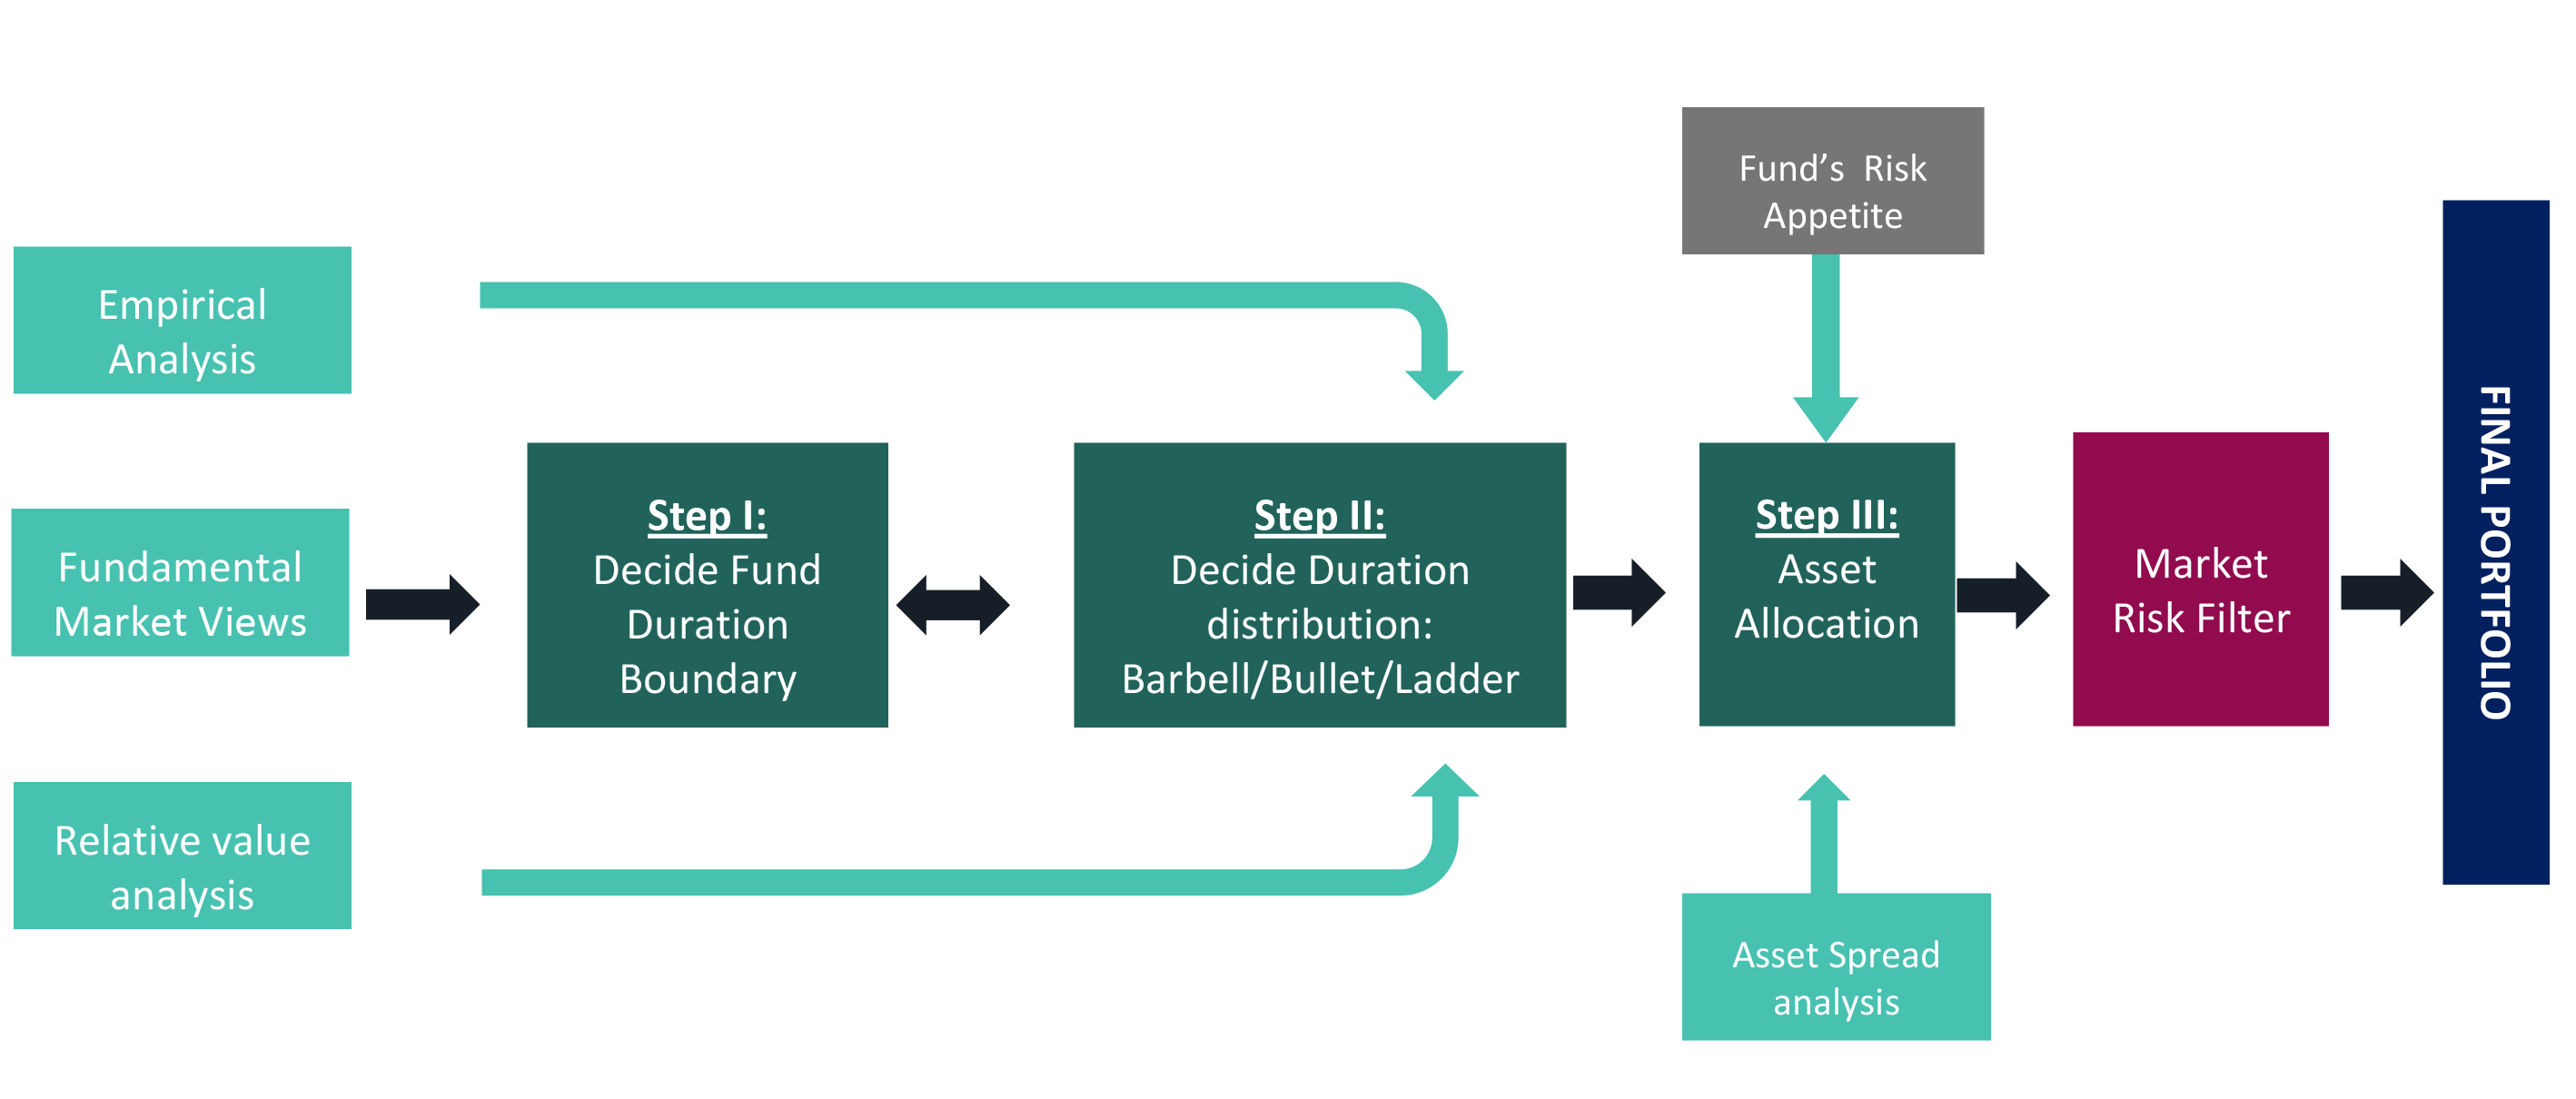
- We apply market risk filter which can help the Fund Managers not to take extreme risks. Thus, Value at Risk is limited by ensuring the positions are balanced.
Investment approach / framework/ strategy mentioned herein is currently followed & same may change in future depending on market conditions & other factors.
Key Risks associated with investing in Fixed Income Schemes
Interest Rate Risk - When interest rates rise, bond prices fall, meaning the bonds you hold lose value. Interest rate movements are the major cause of price volatility in bond markets.
Credit risk - If you invest in corporate bonds, you take on credit risk in addition to interest rate risk. Credit risk is the possibility that an issuer could default on its debt obligation. If this happens, the investor may not receive the full value of their principal investment.
Market Liquidity risk - - Liquidity risk is the chance that an investor might want to sell a fixed income asset, but they’re unable to find a buyer.
Re-investment Risk - If the bonds are callable, the bond issuer reserves the right to “call” the bond before maturity and pay off the debt. That can lead to reinvestment risk especially in a falling interest rate scenario.
Rating Migration Risk - - If the credit rating agencies lower their ratings on a bond, the price of those bonds will fall.
Other Risks
Risk associated with
- floating rate securities
- derivatives
- transaction in units through stock exchange Mechanism
- investments in Securitized Assets
- Overseas Investments
- Real Estate Investment Trust (REIT) and Infrastructure Investment Trust (InvIT)
- investments in repo of corporate debt securities
- Imperfect Hedging using Interest Rate Futures
- investments in Perpetual Debt Instrument (PDI)
 Account Statement
  Capital Gain Statement
  Key Information Memorandum
  PAN Updation
  Register / Modify KYC Online
  Nominee Registration
  Email / Phone Updation
  OTM / eNACH Registration
  Guidelines for Incapacitated Investors
  FAQs
FAQs Reach us


