Summary
Indian equities are rebounding but is the rally strong or shaky? Despite a 10% surge in the Nifty 50, weak market breadth, stretched SMID valuations, and their underperformance raise red flags. Dive into the latest Netra edition for data-driven insights on where the real strength may lie.
Investors are breathing freely again: we’re finally seeing a major rebound in Indian equities.
After hitting a low of below 22,100 on 4 March, the Nifty 50 index opened at 24,420 on 12 May: a rise of around 10% in two months!
However, not all rebounds are created equal, so it’s worth examining this latest surge using various metrics in order to understand it better.
And when we do so, the results turn out to be quite illuminating for investors:
1. Market breadth is weak
Market breadth is a stock market indicator that can be used to gauge the market’s direction and momentum in the near-term.
Essentially, it compares the number of stocks that are rising with the number of stocks that are falling.
Currently, the market breadth is weak from at least two vantage points.
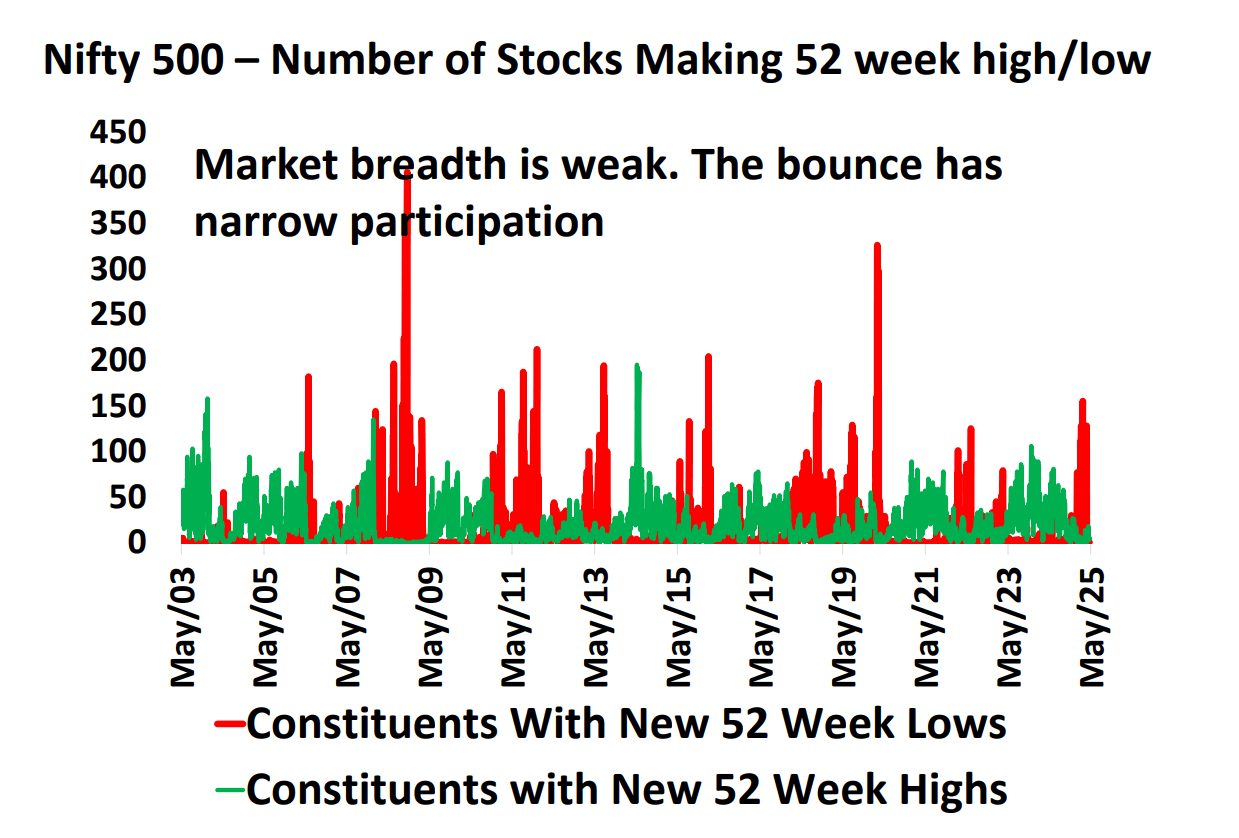
Firstly, more Nifty 500 constituents have made new 52-week lows than fresh 52-week highs, as can be seen below*. This indicates that a fair amount of weakness persists.

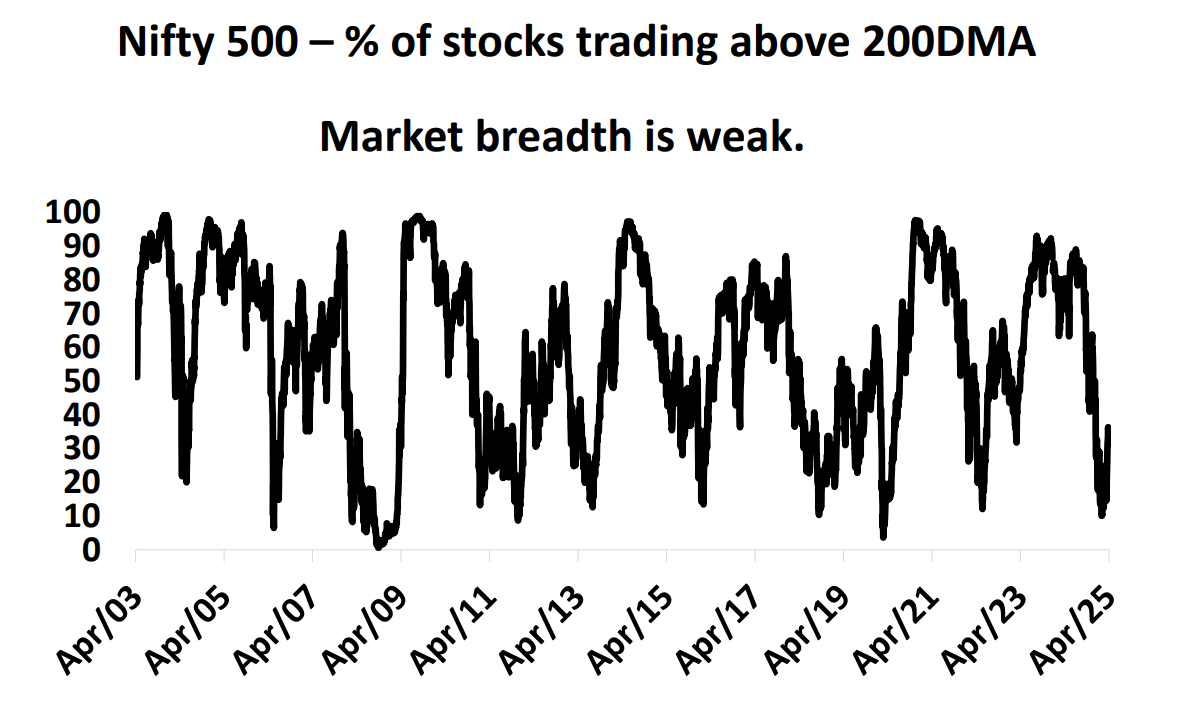
Secondly, the proportion of Nifty 500 constituents that are trading above their 200 DMA (day moving average) remains relatively low, as can be seen below.
This indicates that current price trends are still quite weak.

2. SMID market-cap-to-GDP ratio is high
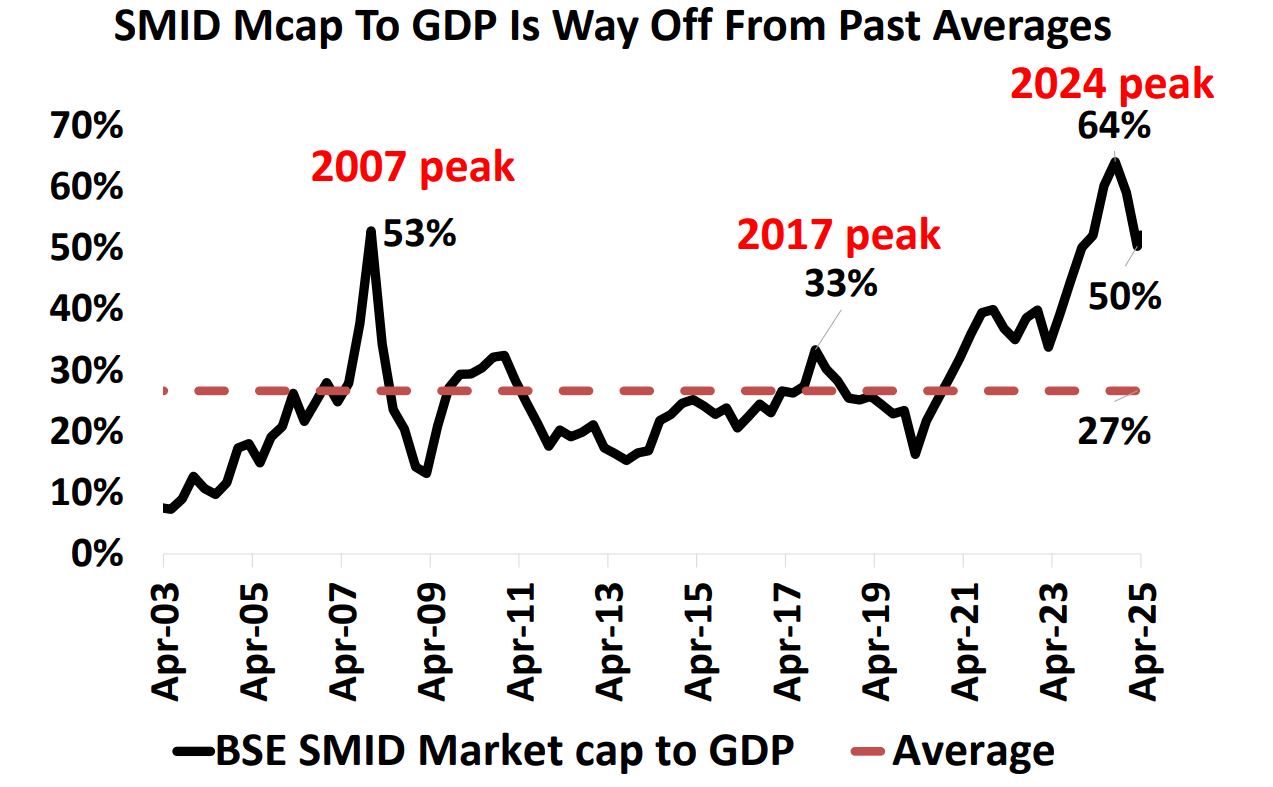
The market-cap-to-GDP ratio for small- and mid-cap (SMID) stocks is still much higher than its long-period average.
This ratio, peaked at 64% in Sep 2024, and is currently slightly over 50%, as you can see below. Its long-period average, though, is much lower, at 27%.

This suggests that SMIDs might still be relatively overvalued, and might not offer much margin of safety.
3. Relative underperformance for SMIDs
By comparing indices representing SMID stocks with an index representing large caps, we can get an idea of how well (or poorly) SMID stocks are performing relative to large caps.
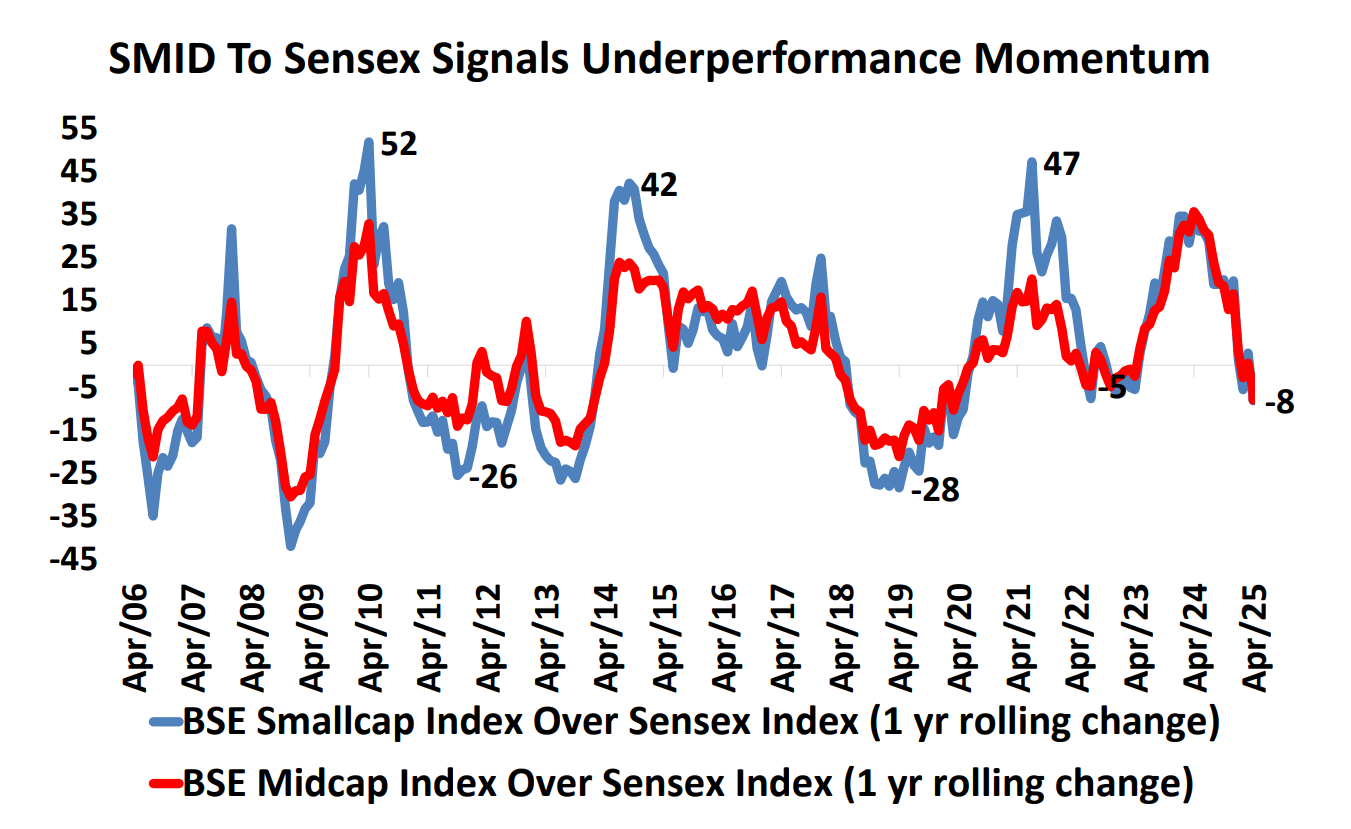
The chart below shows the ratios of the BSE Smallcap and Midcap indices to the Sensex for a 1-year rolling period.

As you can see, both these ratios are currently negative. So SMID stocks have begun to underperform large caps on a rolling 1-year basis.
This also indicates that SMIDs are seeing a rise in downside momentum on a relative basis.
Thus, at this point, large caps might be a better bet than SMID stocks.
For more actionable insights backed by data and analyses, we invite you to read the latest edition of Netra in its entirety.
-
- Source for all data: Bloomberg, DSP. Data as of Apr 2025. *
Industry insights you wouldn't want to miss out on.
Disclaimer
This blog is for information purposes only. The recipient of this material should consult an investment /tax advisor before making an investment decision. In this material DSP Asset Managers Pvt. Ltd. (the AMC) has used information that is publicly available, including information developed in-house and is believed to be from reliable sources. The AMC nor any person connected does not warrant the completeness or accuracy of the information and disclaims all liabilities, losses and damages arising out of the use of this information. Data provided is as of July 2024 (unless otherwise specified) and are subject to change without notice. Past performance may or may not be sustained in the future and should not be used as a basis for comparison with other investments. These figures pertain to performance of the index and do not in any manner indicate the returns/performance of this scheme. The statements contained herein may include statements of future expectations and other forward-looking statements that are based on prevailing market conditions / various other factors and involve known and unknown risks and uncertainties that could cause actual results, performance or events to differ materially from those expressed or implied in such statements.
All content on this blog is the intellectual property of DSPAMC. The User of this Site may download materials, data etc. displayed on the Site for non-commercial or personal use only. Usage of or reference to the content of this page requires proper credit and citation, including linking back to the original post. Unauthorized copying or reproducing content without attribution may result in legal action.. The User undertakes to comply and be bound by all applicable laws and statutory requirements in India.
Mutual Fund investments are subject to market risks, read all scheme related documents carefully.


Write a comment