up-arrow
arrow_back

Long Term Solution

Benchmark: NIFTY 50 info icon

96.25 lakh people have invested in this fund

View performance details

Return:

This solution

%

NIFTY 50

%

Gold

%

Invested

Earning

This solution

18.00%

NIFTY 50

%

Gold

%

Investment in this kind of strategy assumes that you understand downside risks associated with equity investments in the short to medium term. Invest in this solution only if you have the patience to weather the volatility while aiming at creating wealth over long-term

Funds in the solution

DSP Equity Opportunities Fund
  • Growth
  • Equity
  • Large-cap

Risk factor:

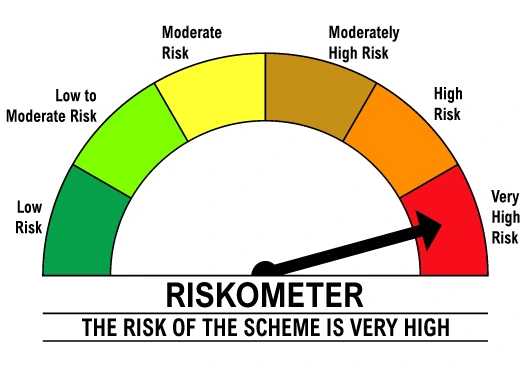
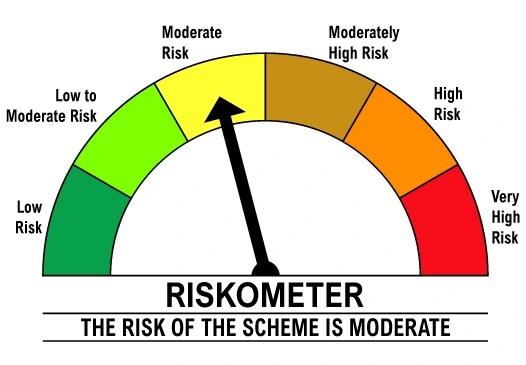
Very High Risk info

  • 50%

  • Share info

DSP Mid Cap Fund
  • Growth
  • Equity
  • Mid-cap

Risk factor:

Very High Risk info

  • 25%

  • Share info

DSP Banking & PSU Debt Fund
  • Growth
  • Debt

Risk factor:

Very High Risk info

  • 15%

  • Share info

DSP Ultra Short Fund
  • Growth
  • Equity
  • Large-cap

Risk factor:

Very High Risk info

  • 10%

  • Share info

Risk

Sudden & unexpected downsides

Goal of Investment

Create wealth over long term

Ideal holding period

Over 5 years

Past Returns

10.56%

5 years

19.04%

3 years

11.63%

1 year


Fund managers

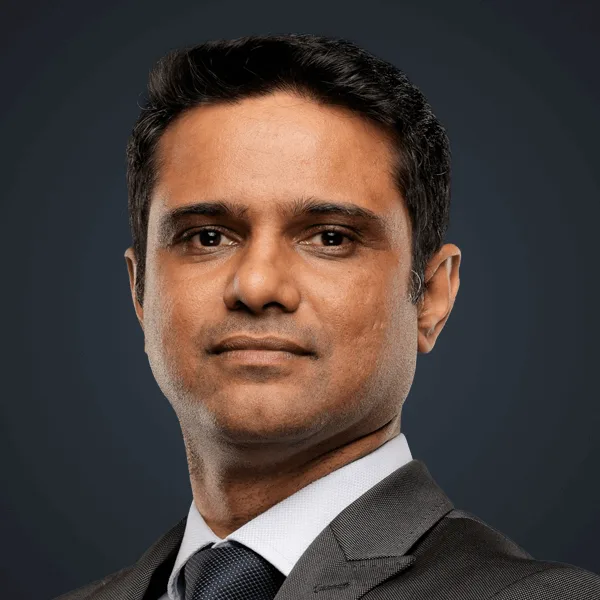
Rohit Singhania

Rohit Singhania

Managing DSP Equity Opportunities Fund in this solution.

right arrow iconSee funds managed by him

right arrow iconSee his investing philosophy

Charanjit Singh

Charanjit Singh

Managing DSP Equity Opportunities Fund in this solution.

right arrow iconSee funds managed by him

Jay Kothari

Jay Kothari

Managing DSP Equity Opportunities Fund, DSP Mid Cap Fund in this solution.

right arrow iconSee funds managed by him

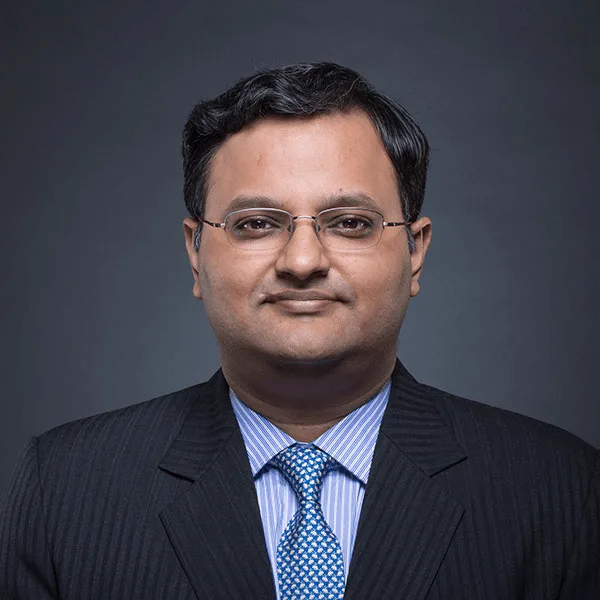
Vinit Sambre

Vinit Sambre

Managing DSP Mid Cap Fund in this solution.

right arrow iconSee funds managed by him

right arrow iconSee his investing philosophy

Resham Jain

Resham Jain

Managing DSP Mid Cap Fund in this solution.

right arrow iconSee funds managed by him

Abhishek Ghosh

Abhishek Ghosh

Managing DSP Mid Cap Fund in this solution.

right arrow iconSee funds managed by him

Shantanu Godambe

Shantanu Godambe

Managing DSP Banking & PSU Debt Fund in this solution.

right arrow iconSee funds managed by him

Vikram Chopra

Vikram Chopra

Managing DSP Banking & PSU Debt Fund in this solution.

right arrow iconSee funds managed by him

Kedar Karnik

Kedar Karnik

Managing DSP Ultra Short Fund in this solution.

right arrow iconSee funds managed by him

Karan Mundhra

Karan Mundhra

Managing DSP Ultra Short Fund in this solution.

right arrow iconSee funds managed by him

Compare Performance

Chart type

Invested as

Invested Amount

Invested since

This Solution

Vs

NIFTY 50

Gold

PPF

NA
Funds Annual returns Current Value Absolute Growth
  • There is no guarantee that investors goals will be met.
  • Scheme(s) referred in above chart are schemes of DSP Mutual Fund.
  • The above basket of portfolios are given only for investor’s convenience and Investor can invest in the individual scheme(s) as well. The portfolios are created without reference to any individual investor’s risk appetite/ their financial needs/ goals etc. and Investors should consult their mutual fund distributors or tax advisors before selecting the said portfolio. The portfolio(s) do not guarantee achievement of any goal or targeted/assured returns. For detailed information on individual scheme, investors are requested to read Scheme Information Document of relevant scheme available on www.dspim.com.
  • The returns chart for the portfolio is plotted based on initial investment as per the allocations specified. The portfolio will undergo rebalancing to initial allocations as & when the allocations bust 10% thresholds. For example, if allocation to specific scheme is 50% then rebalancing will trigger when the allocation to the said scheme as per current market value on that specific day busts 55%. This rebalancing is done to ensure portfolio stays true to the initial objective at the time of investment. The exit load & tax impact, if any, at the time of rebalancing aren’t accounted in the returns chart. Also, to prevent frequent rebalancing due to market volatility, rebalancing events are limited to once in a year. For example, if the last rebalance event has been executed on Jan 1, 2018 then no further rebalancing will happen prior to Jan 1, 2019 even if the 10% thresholds defined for rebalancing are breached.
  • Past performance may or may not be sustained in future and should not be used as a basis for comparison with other investments. For performance in SEBI prescribed format click on the scheme names mentioned above under “Schemes in this solution”
  • For lumpsum investments, if the investment period is less than 1 year then same return values are displayed for absolute & XIRR. For periods above 1 year, they are annualized. 1 Year is assumed as 365 days.
  • Returns for investments in income distribution cum capital withdrawal (IDCW) plans of schemes are calculated after assuming that the net income distribution cum capital withdrawal (IDCW) payouts post statutory taxes & levies, are re-invested back in the scheme.
  • For SIP returns chart, the start day for SIP investments is considered as 1st of every month. There is no end date to SIPs for the purpose of graphs.
  • For the purpose of NAV date applicability, if the investment date happens to be a non-business day, next business day's NAV is applied. Investment on inception date can happen on a non-business day.
  • Gold prices are available post 29 JAN, 2005 & are based on daily closing values on MCX.
  • PPF interest rate is assumed at 8.7% p.a. & interest received is compounded daily for the returns illustration in the charts.

Solution Details

Solution Details

Solution Description

Minimum Investment

1,000 Lumpsum

1,000 SIP - 12 instalments