
Most investors put their money in equity funds because they want higher returns. That instinct makes sense. But history suggests something else, that a mix of asset classes gives your portfolio a better chance to survive and grow through years of volatility. Not because any one asset outperforms. But because when one falls, another often holds. This is what asset allocation is about. And this is why it matters more than most investors realise.
Your favourite asset can go flat for years. Then what?
It has happened, and here are a few examples#.
#Source: DSP Internal.
Every asset class has had its dead years.
Yes, years.
Your allocation. Your numbers.
The answer is diversification. But we're not going to just tell you that. We want you to try it yourself.
We start at 100% equity, where most portfolios are. Add other assets and watch what happens to your return outcomes and risk. The table updates with every change you make.
To make the comparison more realistic, we are also comparing your numbers alongside an equal allocation portfolio and with a more thoughtful multi asset strategy.
100% equity. The worst 5-year return of Nifty 500 TRI was −1.4% and volatility is 20.6%. Move the sliders to add other assets and watch what happens.
| Allocation | Worst 5-yr | Avg 5-yr | Volatility |
|---|---|---|---|
| Your allocation | −1.4% | 12.8% | 20.6% |
| Equal split (25% each) | +7.0% | 11.6% | 8.6% |
| Multi Asset# | +5.3% | 12.4% | 11.8% |
Returns close to equity over time. Volatility nearly half. That's what a thoughtful allocation buys you.
The strategy above has been running as a live fund since September 2023. Here's where it stands today.
One fund across Indian equity, global equity, debt, gold, silver, REITs. Automated internal rebalancing. The simplest complete portfolio.
Built-in global diversification
This fund holds the mandate of investing in global equities too, you get a meaningful allocation without the need to track global markets.
Better tax efficiency
This fund rebalances allocations internally, so there is no tax event when shifts are made. Further, in the hands of investors gains are taxed as long term after holding the units for > 24 months.
(For SEBI prescribed performance details, click here)
A note on the returns above. For most hybrid funds, we recommend looking at average and worst-case returns across rolling 5-year periods, not just a single snapshot. That tells you what a typical investor actually experienced, not just what the best-case looked like.
This fund was launched in September 2023. With roughly 3 years of history, there is not yet enough data for a meaningful rolling-period analysis. The since-inception figures shown are the longest available period, and we are using them as a proxy for now, not as a performance claim. As the fund ages, we will replace these with rolling return data.
In the meantime, the underlying strategy has a longer track record. The returns table earlier on this page shows how a similar multi-asset approach has historically behaved across market cycles. That context matters more than the fund's short-term numbers.
Talk to your MFD
or advisor.
Or leave your details here and we will call you directly.
Most landing pages are designed to make you transact faster. This one is not.
The truth is: the biggest threat to your wealth is rarely the market. It is a decision made in panic, or in overconfidence, without the full picture. We have seen it happen in every cycle. So we try to build things that help prevent it.
Everyone already knows what they should do. The hard part is doing it when markets make that feel impossible. That gap, between knowing and doing, is where most wealth is lost. It is also where we think we can be useful.
We don't know what happens next. Nobody does. But investors who truly understand what they're in for tend to behave better when things get hard. This page exists for that reason. To set better expectations.
If you invest from here, invest with your eyes open. Not because we said so. Because you read this, and you were ready.
DSP Multi Asset Allocation Fund
An open ended scheme investing in equity/equity related securities, debt/ money market instruments, commodity ETFs, exchange traded commodity derivatives and overseas securities.
Product Suitability
This product is suitable for investors who are seeking*:
- Long term capital growth
- Investment in a multi asset allocation fund with investments across equity and equity related securities, debt and money market instruments, commodity ETFs, exchange traded commodity derivatives, overseas securities and other permitted instruments
*Investors should consult their financial advisers if in doubt about whether the Scheme is suitable for them.
Riskometer
Scheme
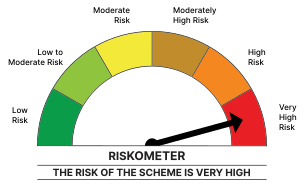
Benchmark^
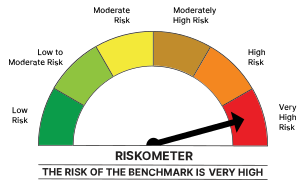
^Benchmark: 40% NIFTY500 TRI + 20% NIFTY Composite Debt Index+ 15% Domestic price of Gold + 5% iCOMDEX Composite Index + 20% MSCI World Index
# Source: DSP Internal
IL&FS stands for Infrastructure Leasing & Financial Services
Past performance may or may not be sustained in future and should not be used as a basis for comparison with other investments. There is no assurance of any returns/capital protection/capital guarantee to the investors in this scheme of DSP Mutual Fund. These figures pertain to performance of the index/Model and do not in any manner indicate the returns/performance of this scheme. The investment approach/framework/strategy mentioned herein are currently followed by the scheme and the same may change in future depending on market conditions and other factors. Investors are advised to consult their own legal, tax and financial advisors to determine possible tax, legal and other financial implication or consequence of subscribing to the units of the schemes of the DSP Mutual Fund. DSP Mutual Fund - SEBI Registration No.: MF/036/97/7.